Chapter 5: Pulse Code Modulation & Sampling
 Call Kai
 Learn
 Practice Test
 Spaced Repetition
 Match
 Flashcards
 Knowt Play
1/107

There's no tags or description
Looks like no tags are added yet.
108 Terms
How is this chapter different from the previous chapters, where we were discussing how to transmit digital data into a digital signal?
This chapter is different because it focuses on converting Analog signals into Digital Signals.
So instead of converting binary data to digital signals, we are focusing on how to convert Analog Signals such as:
Human voices
Music
Temperature readings
Microphone signals
into digital signals
What is the difficulty about converting analog signals such as human voices, music, temperature readings, microphone signals..etc. into digital signals?
The difficulty is that all of the analog signals we just mentioned are continuous.
This means that they cannot be easily represented as either a 0 or a 1 because they can take up a continuous range of values, or infinitely many values.
What methods do we use to convert analog signals into digital data? Name them.
Some of the methods include:
Quantization
Sampling
Encoding
What is sampling?
Sampling is the process of taking measurements of the amplitude of an analog signal at regular intervals.
What is a sample?
A sample is a single recorded measurement of the amplitude of an analog signal at a given moment.
What does the “Sampling Interval” measure?
The Sampling Interval refers to the amount of time taken between consecutive samples.
It is represented by the symbol: Ts
If the Sampling Rate is 0.01s, when does each sample occur?
Sample 1: 0.00s
Sample 2: 0.01s
Sample 3: 0.02s
…and so on.
What does the Sampling Frequency measure?
The Sampling Frequency measures the number of samples taken each second. It is represented by fs.
What is the formula for Sampling Frequency?
fs = 1 / Ts
Where:
fs = Sampling Frequency, measured in Hz
Ts = Sampling Rate, measured in seconds
Calculate the Sampling Frequency if the Sampling Rate is 0.0001 seconds.
Interpret the result.
fs = 1 / Ts
fs = 1/0.0001
= 10,000 Hz.
This means that 10,000 samples are taken every second.
We know this because Hz measures things in seconds.
Why isn’t it enough to sample just once?
Because if we only record one sample, we are not capable of reconstructing the original signal (obviously, we only have one point).
How do we decide how many samples of an analog signal are enough?
We use the Nyquist formula.
Let’s say we have an analog signal with infinite bandwidth.
Can we sample it?
No. Remember, infinite bandwidth means there are an infinite range of frequencies.
We simply cannot capture an infinite number of frequencies by sampling.
Therefore, we are limited to a maximum amount of bandwidth. This is what is known as Fmax
What does Fmax represent?
It represents the highest possible frequency component of an analog signal.
What are the 3 different methods used for sampling?
Method #1. Ideal Sampling
A purely theoretical sampling method where you measure the amplitude of an analog signal instantaneously, meaning you take one measurement after another with no time in between.
In other words, we take measurements instantly (in split seconds), capturing every point on the original signal perfectly.
Ideal Sampling is purely theoretical, doesn’t exist in real life.
Method #2: Sample & Hold (Or Flat-Top Sampling)
When we measure the amplitude at a specific instant in time and we hold the value of the amplitude measured until we reach the next sampling interval.
By the end, our waveform ends up looking like a staircase, because we held the value for so long that it created this constant stagnation on the graph.
For example:
At 1s, we might measure 2V. We hold that value of 2V until we reach our next sample. At 2s, we might measure 4V. We hold that value of 4V until we reach our next sample, and so on and so forth.
Method #3: Natural Sampling
Natural Sampling is when we allow a signal to pass through for a short interval of time during each sampling interval. It works similar to a switch: when the switch is open, it does not measure anything, and when the switch closes, it measures the amplitude of the analog signal at that moment.
For example, the switch might be:
Closed from 1.0 to 1.2ms, closed from 2.0 to 2.2ms, closed for 3.0 to 3.2ms, and during those intervals when the switch is closed, the amplitude is measured.
What is Convolution?
(Don’t need to know much or anything about this)
A mathematical way of analyzing sampling and seeing how the different sampled waveforms combine to form one digital wave.
What does Nyquist allow us to figure out or tell us?
The Nyquist formula tells us how frequently we need to be taking samples so that those samples contain enough information to reconstruct the original analog signal.
What is the problem with the current way we are sampling here?
We have an analog signal whose highest frequency component is 1000Hz.
We only sample 500Hz, which means 500 samples per second.
The problem is that we are taking samples far too infrequently and losing out on large portions of the waveform which are never measured.
What did Nyquist discover about how often sampling should be conducted?
He discovered that if the highest frequency present in an analog signal is fmax, then the sampling frequency must be at least twice that value.
Therefore, his conclusion was that the Sampling Rate must be at least fs >= 2fmax.
Or in other words, the minimum sampling rate must be: fN = 2fmax.
What is the formula for Nyquist Rate? What does the Nyquist Rate tell us?
fN = 2fmax.
The Nyquist Rate tells us the minimum number of samples (of an analog signal) that we would need in order to accurately reproduce the original signal to a decent degree.
Common Exam Problem: Why is it that the Sampling Rate must be at least twice the Highest Frequency?
It must be twice the highest frequency because this is the discovery Nyquist made.
Nyquist proved that the Number of Samples taken must be at least twice the highest frequency in order to contain enough information to accurately reproduce the original analog signal.
What is Pulse Code Modulation (PCM)?
PCM is the entire conversion process from analog to digital signals.
Sampling is only the first step in this process, but Pulse Code Modulation actually contains 2 other steps as well:
Sampling
Quantization
Encoding
What is Pulse Amplitude Modulation (PAM)?
Pulse Amplitude Modulation just describes the output that is produced after sampling.
What is the purpose of Quantization? Which step in the PCM process is it?
The purpose of Quantization is to take the values produced by Sampling, which typically look like this:
1.358395893 V
4.722412125 V
2.125712975 V
and map them to a finite number of discrete levels.
This is necessary because computers don’t typically like working with continuous values. In fact, by the end of the PCM process, we need to have all of these continuous values mapped out to binary digits because we need to represent this as a digital signal. So Quantization first allows us to map them to a finite number of discrete levels which can then easily be mapped out to binary.
Quantization is the second step in the PCM process.
What is the actual definition of Quantization?
Quantization is the process of mapping a continuous range of sample amplitudes to a finite set of discrete values.
For example, it might convert sampled values such as: 1.3V, 2.4V, 4.4V
into discrete numbers that only allow it to choose from a finite number of amplitudes: 1, 2, 3, 4…
Is Quantization an approximate process?
Yes. The entire Quantization process relies on approximation.
For example, the actual amplitude measured might be: 3.8V,
but Quantization could map this value to 3V or 5V depending on the scheme. Regardless, the value is no longer exact.
Lets say that we finished the Sampling process, and we found that the amplitude of our analog signal ranged from -20V to 20V.
We also know we have L = 8 Quantization Levels.
Describe the Quantization steps required to map out these amplitudes to discrete values.
Step 1: Divide the range of Amplitudes into Zones using the Quantization Levels
Use the formula:
Zone Width = (Vmax - Vmin) / L
Zone Width = (20-(-20)) / 8 = 40/8 = 5 V.
This means every zone is 5V tall (because it represents amplitude).
Step 2: Create the zones using the appropriate Zone Widths
Zone 0: -20 to -15
Zone 1: -15 to -10
Zone 2: -10 to -5
Zone 3: -5 to 0
Zone 4: 0 to 5
Zone 5: 5 to 10
Zone 6: 10 to 15
Zone 7: 15 to 20
Step 3: Assign midpoints to each zone by finding the middle value
To find the middle value, use: lower bound + upper bound / 2
Zone 0 middle bound: -20+(-15) / 2 = -17.5
Zone 1 middle bound: -12.5
Zone 2 middle bound: -7.5
Zone 3 middle bound: -2.5
Zone 4 middle bound: 2.5
Zone 5 middle bound: 7.5
Zone 6 middle bound: 12.5
Zone 7 middle bound: 17.5
Step 4: Determine which Zone each sample belongs to, Replace the Samples with their Corresponding Midpoints
For example, if a sample equals: -6.1V, we can see that it falls in the -10 to -5 region, which is Zone 2. Then we replace the value of this sample with the midpoint that corresponds to Zone 2, which is -7.5.
So -6.1V became -7.5V.
This is the result of the Quantization.
What is the formula for finding Quantization Error? What is Quantization Error?
Quantization Error = Quantized Value - Actual Sample Value
It represents the error created by approximation in Quantization.
What is Encoding?
Encoding is where each Quantized level is converted back into a binary code word.
It is the last step of the PCM (Pulse Code Modulation) process
In Encoding, what is the formula for figuring out the number of bits to use for the binary code word?
nb = log2L
Where nb = number of bits per sample or bits/sample
L = the number of levels
Let’s say we’ve already figured out that one of our samples: -6.1V
lands in Zone 2, and can be represented by the quantized value -7.5.
We know that we have 8 Levels.
Show the process of mapping this sample to a binary code word.
We use the formula:
nb = log2L
= log28
= 3 bits per sample.
8 Levels also means we have 8 different zones.
We can represent each zone with 3 binary digits by counting up in binary from 000.
Map Bits to Every Zone:
Zone 0 = 000
Zone 1 = 001
Zone 2 = 010
Zone 3 = 011
Zone 4 = 100
Zone 5 = 101
Zone 6 = 110
Zone 7 = 111
Since we know the sample is in Zone 2, we can represent it using the binary code word: 010.
Answer: 010
What is the formula for bit rate expressed using Sampling Rate?
bit rate = fs x nb
Where:
bit rate = Measured in bps
fs = Sampling Rate or Sampling Frequency, measured in Hz
nb = Number of bits
Given that fs = 8000 Hz and L = 8, find the bit rate.
Use the formulas:
nb = log2L
and
bit rate = fs x nb
Solve for the number of bits first:
nb = log2L
nb = log2(8)
nb = 3 bits.
Solve for the bit rate:
bit rate = 8000 × 3 bits
bit rate = 24000 bits/second
What does L actually represent? We know it represents the number of levels, but what levels specifically?
L represents the number of Quantization levels/zones.
It tells us how many different amplitudes are allowed after quantization occurs.
Why is having L=256 better than having L=6?
L = 256 means there are 256 quantization levels, and therefore 256 different amplitudes that we can assign our values to after Quantization occurs.
This is much better than L = 6, because with L = 6, you only have 6 possible amplitudes to assign to, and that reduces the accuracy of estimation significantly.
Why don’t we just make L huge if it improves the accuracy of estimates in Quantization?
Why don’t we make it 1 million?
While more levels, even 1 million levels would make it more accurate, it would also require more bits, which would mean a higher bit rate, and therefore, a higher bandwidth.
How do we decide how many Quantization levels we should have?
In other words, how do we decide on the value of L?
There is no set way of defining the number of values for L.
If your signal only contains two possible amplitudes, such as something representing ON/OFF or OPEN/CLOSED, then having L = 2 is perfectly fine.
Otherwise, if you have a signal like a voice, which has a continuous range of amplitudes, we choose L = 256. There is no particular reason behind this, it’s just the classic technique used by PCM (Pulse Code Modulation).
What is the formula for Maximum Quantization Error?
Where does this formula come from?
The formula for MAX quantization error is:
Max Quantization Error <= The width of the zone / 2
The formula comes from the fact that the Quantized value is the midpoint, and the greatest possible distance from the midpoint to any point in the zone is half the width of the zone:
|—————midpoint—————|

Why is Quantization Error often called noise?
It is often called noise because through the process of Quantization, we change the actual amplitude values into approximations, which means the signal has been altered by a slight amount, and we have introduced a bit of error.
For example: -3.8 V being altered to -4.1 V.
The alteration to the amplitude values act like noise, or like an unwanted signal, and therefore we refer to it as Quantization noise.
How does L affect noise?
A larger L means you have more Quantization levels, or in other words, more zones that can be used to represent the range of amplitudes in your signal.
More zones also means that each zone contains a narrower range of amplitudes. As a result, there is less Quantization error, because you can more accurately map the measured amplitude to a corresponding discrete value.
Less Quantization error also means there is less Quantization noise.
What is the formula for calculating the Signal to Noise Ratio specifically for the PCM (Pulse Code Modulation) Process?
SNRdb = 6.02nb + 1.76
Where:
nb = number of bits used to represent our sample
SNR = Signal to noise ratio measured in decibels
If we increase the number of bits per sample, what happens to the amount of noise?
SNRdb = 6.02nb + 1.76
When we increase the number of bits per sample, we also increase SNR.
Since we know SNR is: Signal Power / Noise Power, this means that we had less noise, because more noise would’ve given a smaller SNR value.
Therefore, more bits per sample also means less noise.
What is Uniform Quantization?
Uniform Quantization is a Quantization process where every zone has an equal width.
This is actually the entire process we’ve been discussing so far.
Why can Uniform Quantization sometimes be inefficient?
Uniform Quantization can be inefficient because it focuses too much on representing the total range of amplitudes in our sample rather than focusing on the amplitudes which appear to be most common in the sample.
For example: most speech amplitudes happen to be around 0V.
The signal spends very little time at other extreme amplitudes, and so many levels are wasted.
What is Non-Uniform Quantization? Where do we most commonly see it used?
Quantization that does not use equal widths for each zone.
It’s most commonly used with analog signals coming from speech, which tend to range around 0V. It focuses on precision in the amplitude regions that show up the most.
What formula do we use to compare the amount of bandwidth in a digital signal vs an analog signal?
We use the formula:
BDigital = nb x BAnalog
BDigital = Represents the bandwidth of the Digital signal
BAnalog = Represents the bandwidth of the Digital signal
nb = number of bits per sample
If we have 8 bits used to represent each sample, what can we conclude about the bandwidth of the Analog Signal vs the Bandwidth of the Digital Signal?
What can we conclude about the PCM process in general?
Use this formula: BDigital = nbBAnalog
BDigital = nbBAnalog
BDigital = 8BAnalog
This means that the Digital Signal has 8 times the bandwidth of the Analog signal.
We can also conclude that the PCM process typically leads to digital signals with a much higher bandwidth than their original analog signals.
When we want to convert Digital data back into Analog data, what are we actually doing?
Are we trying to convert bits (0110001) into music or voice?
No, not at all. This section is not discussing the data transmission of music or voice, its discussing digital modulation, where the bits are already the message, and we just want to represent it as analog.
What is a carrier signal?
A carrier signal is a high frequency sine wave used as the foundation for transmitting information.
Mathematically, it’s just a simple sine wave, and it is completely clean, meaning it carries no data.
Why do we need a carrier signal?
We need a carrier signal because it acts like the base signal that we can modify using bits.
For example:
If we are trying to transmit 1011, we need a starting signal to influence in order to create our analog signal. This starting signal is referred to as our carrier signal.
What characteristics can we change about a sine wave?
We can change:
Amplitude: which determines how tall the wave is
Frequency: how quickly it oscillates
Phase Shift: where the wave starts
There are only 3 properties we can change, no others.
What is Modulation?
Modulation is changing the properties of a carrier signal in order to represent digital data.
What are the 3 Modulation Techniques most commonly used?
ASK = Modifies the Amplitude
FSK = Modifies the Frequency
PSK = Modifies the Phase
In what kind of conversion from digital data to analog data do we use Modulation?
We only use Modulation in Broadband Transmission (Recall from Chapter 3).
What is ASK? What does it stand for?
ASK stands for Amplitude Shift Keying. It is a modulation technique in which the amplitude of the carrier signal changes to represent digital data.
Note: The Frequency and the Phase Shift remain constant.
For example: If the frequency is 1000 Hz, we keep the frequency at 1000 Hz, and only change the Amplitude.
What is Binary ASK?
Binary ASK is a modulation technique where we use two possible amplitudes to represent the binary values 0 and 1.
For example:
Binary digit 0 = amplitude of 0
Binary digit 1 = amplitude of 5
What is a special case of Binary ASK?
OOK (On-Off Keying) is a special case of ASK where one of the amplitudes is 0 (usually the amplitude used to represent the binary digit 0).
It’s called on-off keying because it looks like we’re turning a switch on and off.
For example:
When the binary digit is 0 = Wave has 0 amplitude and looks like this: ____________
When the binary digit is 1 = Wave has an amplitude and looks like: /\ /\/\/\
For Binary ASK, how many signal elements do we have? How do you know?
Remember: Signal elements refer to physical signals that carry data.
In Binary ASK, we only have 2 signal elements.
We know this because binary digit 0 is represented by a signal with an amplitude of 0, and binary digit 1 is represented by a signal with an amplitude greater than 0. This means that there can only be 2 possible signals/signal elements.
For Binary ASK, how many bits does each signal element carry?
Each signal element can only carry 1 bit.
This is because:
binary digit 0: represented by a signal element with an amplitude of 0
binary digit 1: represented by a signal element with an amplitude greater than 0
What is Multi Level ASK?
Multi Level ASK is when we use more than two amplitudes to represent multiple bits on each signal element.
For Example:
Amplitude A (0V): 00
Amplitude B (5V): 01
Amplitude C (10V): 10
Amplitude D (15V): 11
Why might we need Multi-Level ASK?
We need Multi-Level ASK if we want to transmit more than 1 bit per signal element.
Why isn’t Multi-Level ASK used everywhere if it’s capable of representing multiple bits on a single signal element? :(
We don’t use Multi-Level ASK everywhere because whenever its used, it brings the amplitudes closer together.
For example:
Amplitude A might be 1V
Amplitude B might be 2V
Amplitude C might be 3V
All of these voltages are very close together. Any small changes as a result of noise could turn 3V into 2.8V, and suddenly make the receiver confused as to which amplitude is being represented.
What is one advantage and one disadvantage of Multi Level ASK?
One Advantage: It is more efficient at representing bits
One Disadvantage: It has a greater chance of error.
What is FSK? What does it stand for?
FSK (Frequency Shift Keying) is a modulation technique where the frequency is changed to represent digital data, while everything else (amplitude and phase) stays constant.
What is Binary FSK?
Binary FSK is a modulation technique where we use two carrier frequencies to represent 0 and 1.
For example, we might use:
0 = 1000Hz and 1 = 5000Hz in order to represent 0 and 1.
Now the receiver’s only job is to measure frequency.
Why is BFSK generally better than BASK?
BFSK is better because it is more resistant to noise. This is because noise tends to alter amplitude much more than frequency.
What is multi-level FSK?
Multi-level FSK is when we use more than 2 frequencies to represent multiple bits.
For example, we might use four different frequencies to represent 2 bits each:
1000Hz to represent 00
2000Hz to represent 01
3000Hz to represent 10
4000Hz to represent 11
What is PSK? What does it stand for?
PSK stands for Phase Shift Keying. It’s a modulation technique where we only change the phase of a wave to represent digital data, nothing else.
Remember that when we change the phase of a wave, all we are changing is its horizontal displacement. This means that nothing about the amplitude or the frequency changes, it just starts a little bit later.


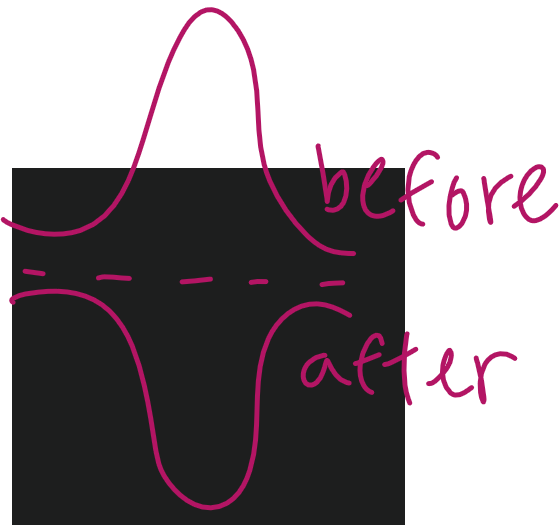
What would a 180 degree phase shift look like if the original wave looked like this?
Draw it on paper.
The only difference is that the wave has been inverted.
The positive peaks now become negative peaks.
Why is PSK more resistant to noise?
Phase is more resistant to noise because Phase is unaffected by Amplitude, which is most influenced by noise.
Even if your amplitude changes by quite a bit because of noise, your horizontal displacement remains the same.
Why don’t we just use PSK everywhere instead of ASK if it’s more noise-resistant?
We don’t use PSK everywhere because it makes it harder for the receiver to determine what we’re trying to send. Instead of determining the amplitude, the receiver now has to determine what the phase is, which is more difficult to measure.
So PSK requires more sophisticated hardware.
What is Binary PSK?
Binary PSK is when we use two different phases to represent the two binary values.
These phases are typically 0 degrees and 180 degrees.
How would you transmit 0110 using Binary PSK?
You know that the rule is:
0s are represented by 0 degrees
1s are represented by 180 degrees
0 degrees
180 degrees
180 degrees
0 degrees
Now the receiver would just measure the phase of each signal element to reconstruct the binary digits.
How many bits per signal element are there in Binary PSK?
We know that Binary PSK uses two different phases in order to represent 0s and 1s.
And we know that a 0 is represented by one phase, while a 1 is represented by another phase.
Therefore, we know that it takes 1 signal to represent each bit.
So there is only 1 bit per 1 signal element.
Compare the bandwidths of BPSK, BASK, and BFSK.
BPSK (Binary Phase Shift Keying) and BASK (Binary Amplitude Shift Keying) have roughly the same bandwidth.
However, BFSK (Binary Frequency Shift Keying) has a greater bandwidth than the other two. This is because BFSK requires the frequencies to be separated far enough that they can be clearly distinguished from each other to represent 0s and 1s.
So: BFSK > BPSK and BASK
What is QAM? What does it do?
QAM (Quadrature Amplitude Modulation) is a more specialized modulation technique that combines phase shifts and amplitude changes to represent many different signal elements.
Why is QAM more powerful than ASK or PSK?
QAM is more powerful because it COMBINES ASK and PSK.
For example:
If ASK is capable of representing 4 signal states and PSK is capable of representing 4 signal states, then QAM is capable of representing 16 signal states = 4 × 4 (one from ASK, and one from PSK).
How many carrier waves does QAM use? Why does it use this many?
QAM uses 2 carrier waves. Both waves have the same frequency, but they have a different Phase shift (they are separated by 90 degrees) and different Amplitudes.
It uses 2 different carrier waves in order to combine the effect of having different Amplitudes and Phase shifts (from PSK and ASK), and to have double the amount of data.
What is a Constellation Diagram?
A constellation diagram is a graph that represents all possible signal elements that exist in a modulation.

What does each part of the following Constellation Diagram represent?
The x and the y axis represent one carrier wave each. The x axis represents the carrier wave known as the “Quadrature Carrier” and the y axis represents the carrier wave known as the “in-phase carrier”. The two waves are separated by an angle of 90 degrees.
A single point on the graph represents one signal element, which can either correspond to one bit or a group of bits, depending on the modulation.
The angle represents the phase shift.
The distance from the origin represents amplitude. The farther from the center it is, the larger the amplitude. The individual lengths of the x and y axis represent the amplitudes of each individual wave.

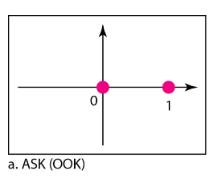
Why does the constellation diagram for Binary ASK only have a single axis representing a single wave?
Because Binary ASK only changes the amplitude of a wave.
In a regular QAM diagram, we use both of the two axis because we’re showing changing two parts of our wave: the amplitude (how far a point is from the center), and the phase (the angle around the center).
If we’re not modifying the phase at all, then the angle around the center is 0, and so we only need the x axis.
Draw the constellation diagram for Binary ASK given that the peak amplitudes are 1V and 3V.
In this question, it decided to represent one of the bits using an amplitude of 1 V, and the other bit using 3V.
So let’s say we assign:
Bit 0 = 1 V
Bit 1 = 3 V
Since we know that Binary ASK only exists on a single axis (the x axis), we can plot these point as such:
(1, 0) = this means 1 on the horizontal axis, 0 on the vertical axis
and
(3, 0) = this means 3 on the horizontal axis, 0 on the vertical axis
So the final answer would look like:


Why does BPSK also only use one axis, the x axis?
BPSK only modifies the phase, meaning it modifies the angle around the center.
So unlike QAM, it’s not modifying both Amplitude and Phase, which is why there’s no need to use both the x and the y axis.
In the example above, you can clearly see that the only difference between the two points is their phase (represented by the angle around the center).
Draw the constellation diagram for BPSK, with a peak amplitude value of 2 V.
This means we only have a single point, with an amplitude value of 2 V.
Remember: BPSK uses the phase shift 0 degrees, and 180 degrees, so we must represent both on our graph.

Draw the constellation diagram for 8-QAM with two different peak amplitude values, 1 V and 3 V, and four different phases.
Note: Whenever we draw QAM constellation diagrams, we need them to look relatively symmetrical.
Notice that we have 4 different angles here, and 8 symmetrical points.


What is this diagram showing?
This diagram is showing a 16-point QAM.

In a QAM diagram, where do we start measuring angles from?
We start measuring angles from the In-Phase (x-axis) going counter-clockwise.
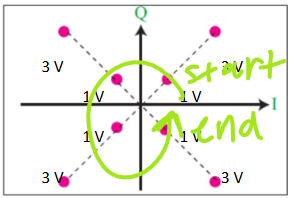
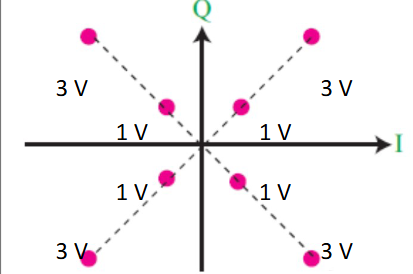
How can we tell how many signal states are present based on the number of points on a QAM diagram? How can you tell how many bits per signal each point represents?
Answer the question below to find out:
How many bits are represented by each signal state in the following QAM Diagram?
We know that each point can either represent 1 bit or a group of bits.
To figure out how many bits are represented by each signal state, we use the formula:
r = log2(n)
r = the number of bits per signal
n = the number of points on the QAM diagram
Here, there are 8 points, so we know that:
r = log2(8)
= 3
This means: 3 bits per signal element.
If we have an analog signal (let’s say the analog signal of Michael Jackson’s singing voice), and we want to transmit this analog signal, what techniques do we use?
Name them.
AM
FM
PM
You may have already heard about these in relation to the radio.
Just be careful, these are techniques for converting an already analog signal to an analog signal that can be transmitted. It is different from PSK, FSK, and ASK, which were techniques for converting digital signals to analog signals.
Why is it not possible to transmit an already analog signal (like somebody’s voice) directly over the radio? Why do we need to do an analog to analog conversion?
We cannot transmit the analog signal directly because radios are built around specific frequency ranges.
For example, AM and FM radio both tend to operate at much higher carrier frequencies than regular analog voice signals. So for this reason, we need to convert our already analog signal to an analog signal of a different frequency.
What is a carrier signal again?
A carrier signal is just the simplest sine wave that carries no information and is used as the foundation for transmission.
Its information comes from other sources, typically voices, music, or some kind of audio that influence the shape of the carrier signal. We call these other sources: voices, audio of some kind, modulating signals.
What is a modulating signal?
A modulating signal is the original signal which carries the information we actually want to transmit. It is used to influence the shape of the carrier signal (by modulating it).
So the carrier signal acts as the transmission mechanism, and the modulating signal is the actual information being sent on the transmission mechanism.
What does AM, FM, and PM stand for?
AM = Amplitude Modulation
FM = Frequency Modulation
PM = Phase Modulation
What is AM (Amplitude Modulation)?
AM is a modulation technique where the amplitude of the carrier signal changes according to the amplitude of the modulating signal.
In plain terms, what actually happens when we use AM with the sound of a person’s voice?
Whenever the voice signal gets louder, the carrier amplitude becomes larger.
If the voice gets quieter, the carrier amplitude becomes smaller.
The carrier signal essentially follows the shape of the voice.
What is the formula for the bandwidth of AM?
BAM = 2BM
BM = represents the bandwidth of the modulating signal (the signal that influences the carrier frequency)
BAM = represents the bandwidth of the AM modulated signal
Both are measured in Hz.
Why do radio stations need to be separated? How are they separated?
Radio stations must be separated by frequency, because if they’re not, their frequency ranges overlap and interference occurs.
What does FM (Frequency Modulation) do?
Frequency Modulation is a technique used to convert analog-analog where it only changes the frequency of the carrier signal according to the amplitude of the modulating signal.
In plain terms, what actually happens when we use FM with the sound of a person’s voice?
When the person increases the volume of their voice, their amplitude goes up, and therefore it swings over a wider range of frequencies in the carrier wave.
When the person lowers the volume of their voice, their amplitude decreases, and therefore it swings over a smaller range of frequencies in the carrier wave.
Why does FM radio sound better than AM radio?
Because AM changes the Amplitude of the carrier signal, and Amplitude is very sensitive to noise.