Pricing Strategy
 Call Kai
 Learn
 Practice Test
 Spaced Repetition
 Match
 Flashcards
 Knowt Play
1/7

Earn XP
Description and Tags
ECON127 L5
8 Terms
What is Game Theory
Simultaneous single- move games
They are simple static games - one off decision
-dominant strategy - no matter what x company is going to do, company y is going to do the same
-best response
-Nash equilibrium
Both companies move the same time, only moving once

explain what is happening here - prisoners dilemma
Oligopoly example
A - both charge the same, both earn the same
B - X undercutting Y, X attract more of market, more profit
C - Y undercutting X, Y ""
D - same as A
A - maximise both markets as they both get £10 mil
Dominant strategy for Y is to always charge £1.80, best outcome for it.
X does the same. As it is a simultaneous game both of them don’t know what their decision will be.
D - Nash equilibrium
End up in D as both X and Y both undercut each other. They are both earning less as they are competitive. If they worked with each other then they would get more. Always a temptation to compete so both end up getting worse what could have happened.
Could always work with each other but there is always temptation to compete and undercut each other to get better. Bet idea would be to collude but they compete instead and get Nash equilibrium.
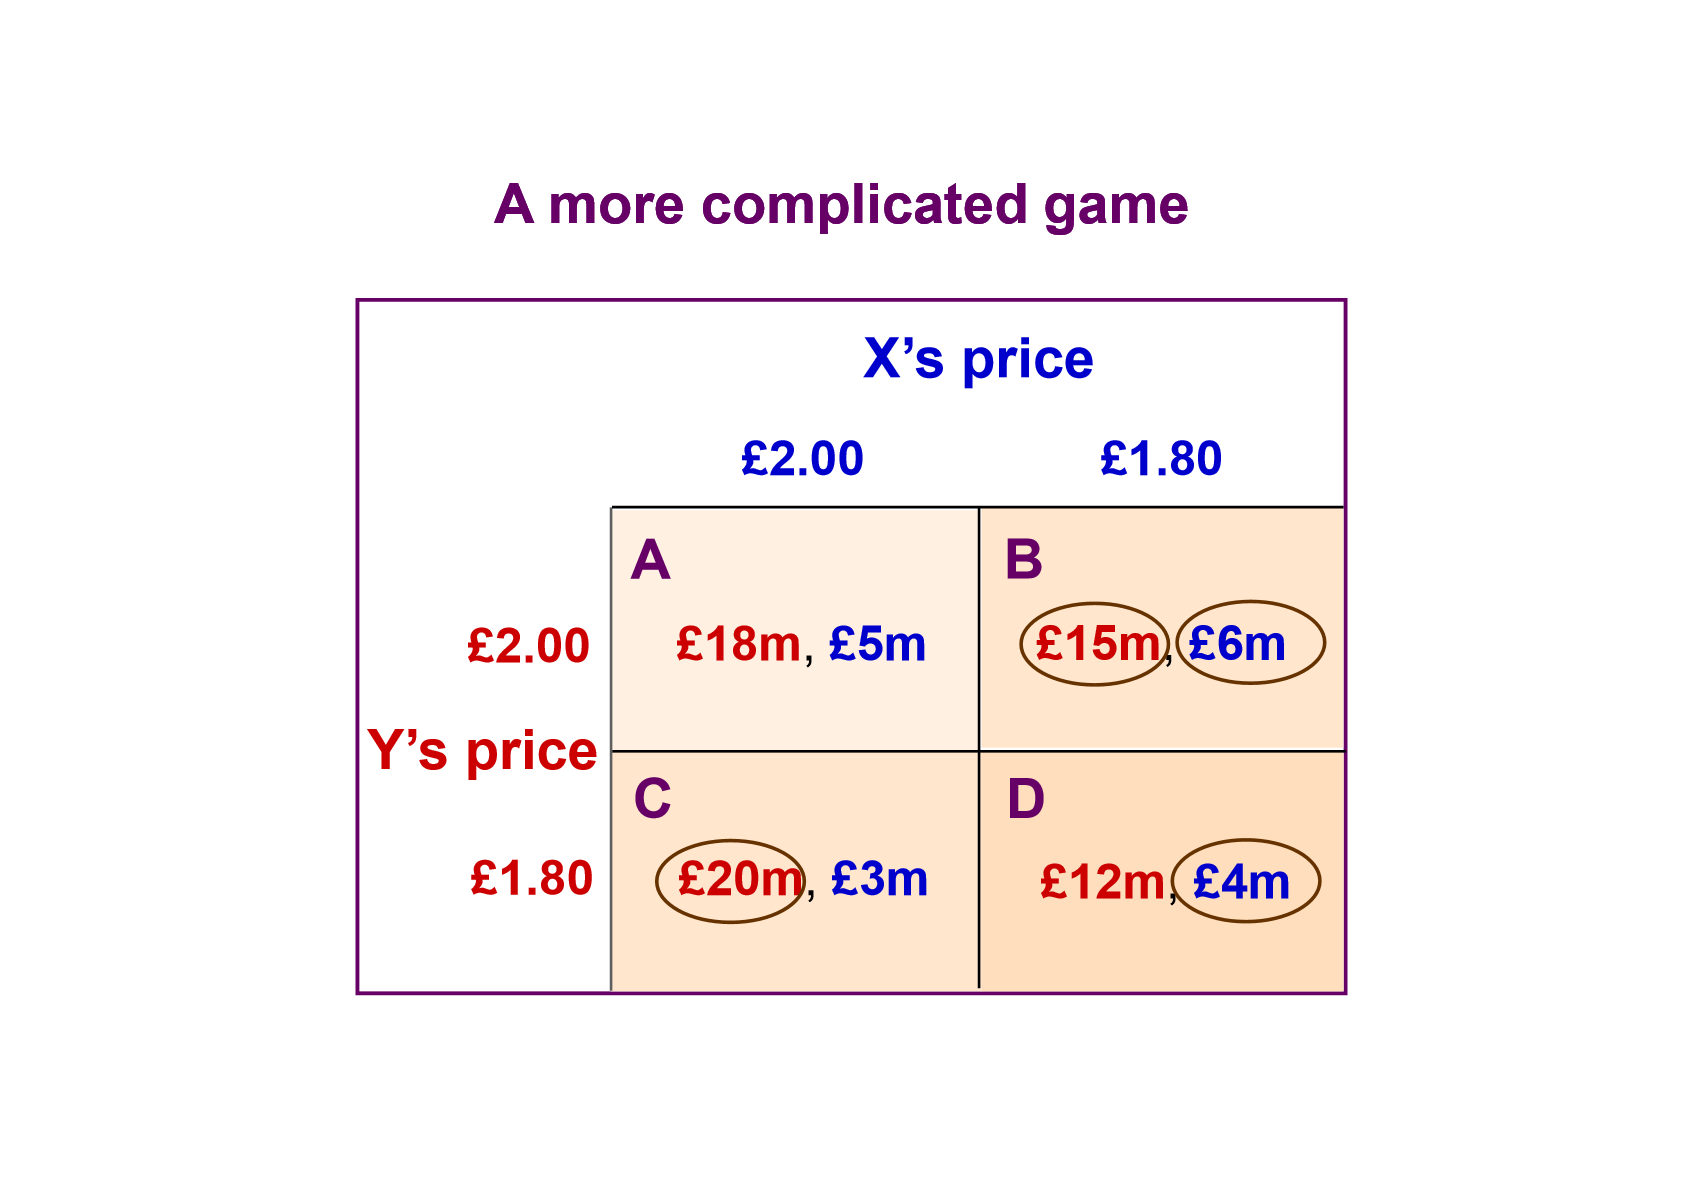
A more complicated game
Strategy of Y changes. If X will charge £1.80 then better for Y to pick £2. but if X charges £2, then better for Y to pick £1.80.
Nash equilibrium in B.
Price discrimination
Charging one price to one set of customers and another price to another set of customers#
First degree - price discrimination
Each customer charged the maximum they are willing to pay.
Charge everyone a different number. So maximum that the company can get
Light shaded area is the normal amount of revenue a business can get
Dark shaded is the additional as ablet to charge more.

Second degree - price discrimination
Customers offered the same range of pricing options and choose
discounts according to quantity purchased
timing of the purchase
(costco bogof etc)
Third degree - price discrimination
customers split into groups based on easily observable characteristic (students)
purple is the revenue from a single price
teal is the increased revenue from price discrimination.
able to gain a higher revenue

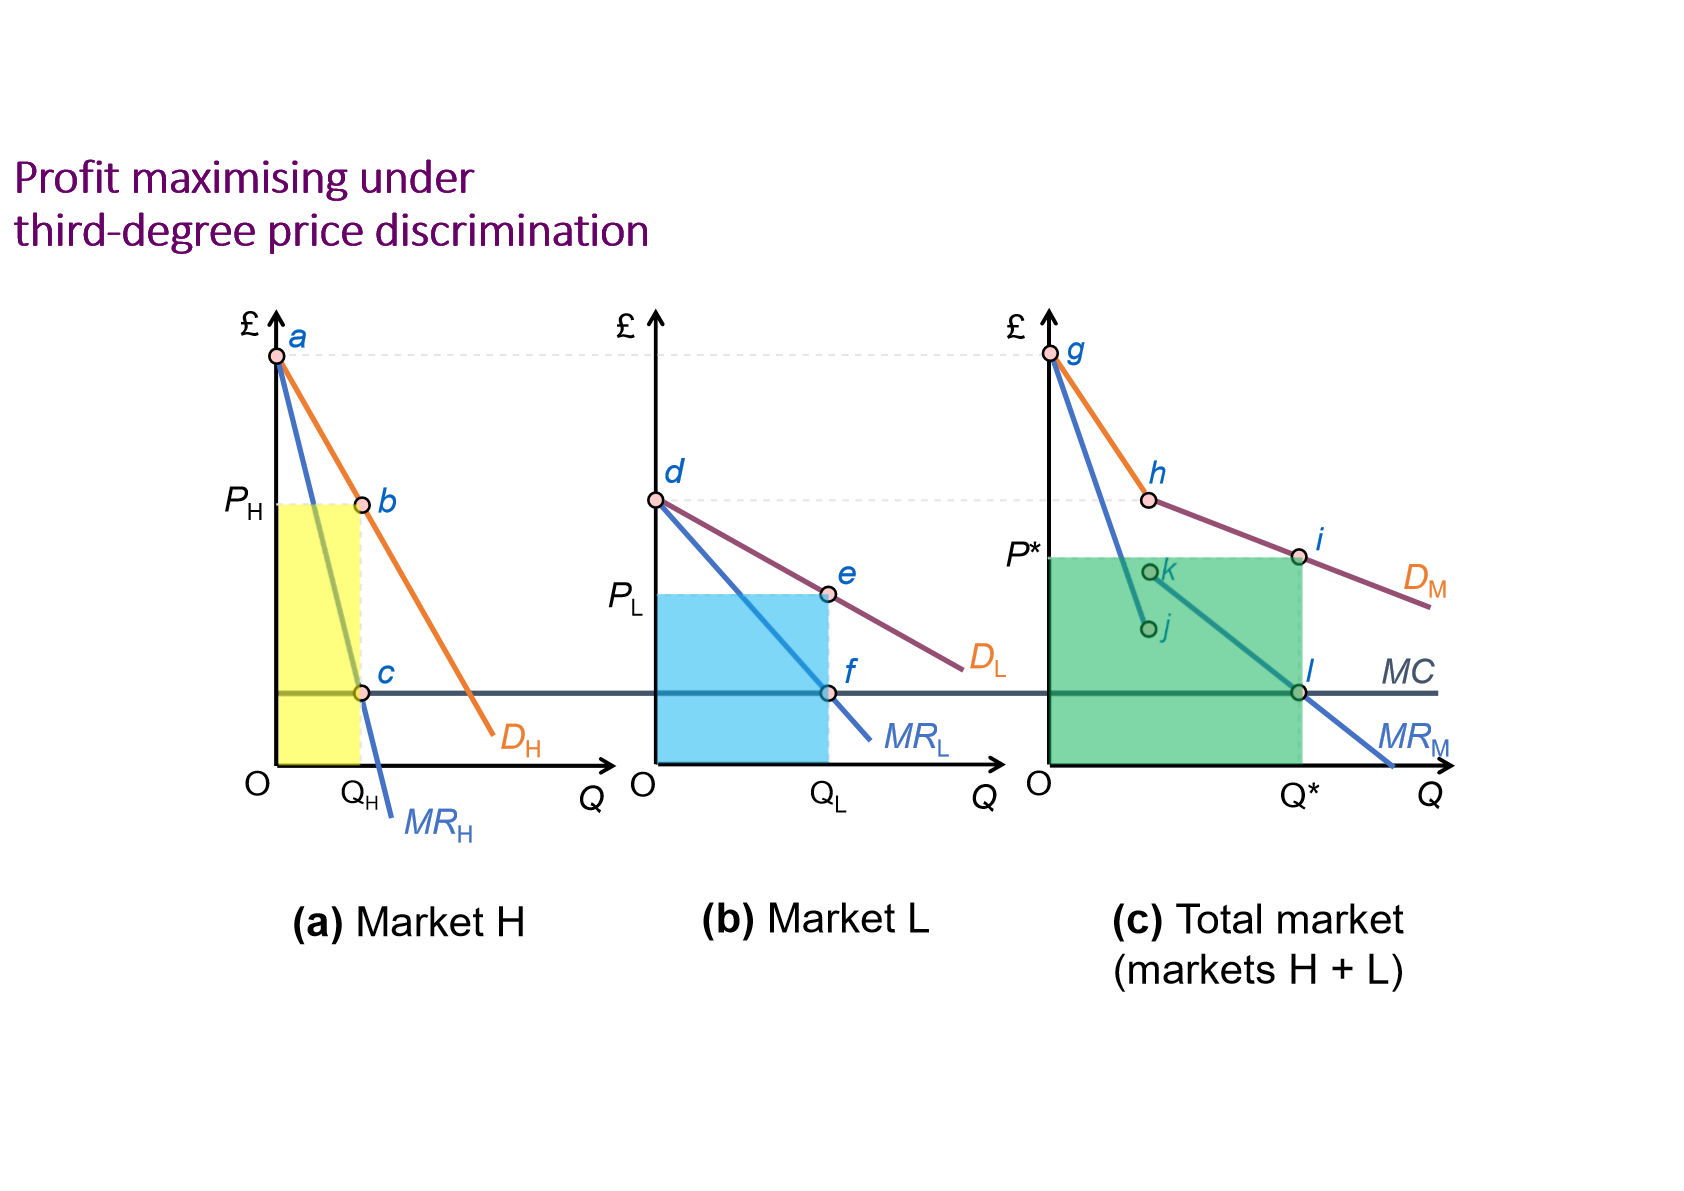
Profit maximising under a third degree price discrimination
Just showing two diff markets, marginal revenue high and marginal revenue low.
g and h are both d and a on the other graphs.
g to h is the demand for market H, from h onwards its the demand curve for market L
g to j is the marginal revenue for market H, k to down its the marginal rev for L
constant marginal cost, end up with equib
charging two diff prices in this market
High part out of Market H and lower part in market L
kings demand function