FINC 446 - Wilson Exam 1 - TAMU
 Call Kai
 Learn
 Practice Test
 Spaced Repetition
 Match
 Flashcards
 Knowt Play
1/156

There's no tags or description
Looks like no tags are added yet.
157 Terms
What are the four Real Keys to making money?
1) Objective Indicators
2) Discipline
3) Flexibility
4) Risk Management
What are Objective Indicators?
1. Used by all legendary traders rather than gut emotions
2. Mathematical, long historical analysis to show effectiveness
What is Discipline?
1. Investor must be loyal, faithful to their systems through good and bad times
2. Avoid pitfalls of character flaws
What is flexibility?
1. seemingly at odds with discipline
2. Indicators can change
3. When wrong, change course
4. Flexible to change minds when the evidence shifted
What is risk management?
Controlling losses
Business of making mistakes
When wrong, change course
Successful investors are Risk Managers
What are the four negative behaviors and attitudes that can lead to poor investment returns?
Failing to take losses
Being overly fearful at market bottoms and overly optimistic at market tops
Failing to take responsibility for your own money
Not following a disciplined strategy
(T/F) Crowd psychology and liquidity (potential demand) are inversely related?
TRUE
Increasing optimism --> Falling liquidity
Rising Pessimism --> Rising liquidity
What are the Nine Rules of Ned Davis Research Group?
Don't fight the tape
Don't fight the Fed
Beware of crowd extremes
Rely on objective indicators
Be disciplined
Practice Risk Management
remain flexible
Money Management Rules
Those who do not study history are condemned to repeat its mistakes
What was the stock that we tracked in class after its earnings call? (Hint: Prof Wilson kept saying Nirvana in class)
Nvidia
What is Tracking Error Risk?
It is the divergence of the Fund's performance from that of its investment objective
Further explanation if you are confused (like me)
For example: A Fund/ETF will aim to replicate 2x the percentage change of a stock. However, it cannot do this perfectly due to transaction costs, over exposure and other frictions.
(Like the 2x Nvidia ETF that we bought in class)
Principal Risks of investing in the Fund? (No shot he asks this, but, in case he does, you can't blame me)
Underlying Stock Risk
Effects of compounding and market volatility
Correlation Risk
Leverage risk
On-Demand business and Technology Services Company Risks
counterparty risk
Derivatives Risk
Exchange Traded Fund Structure Risk
Fixed Income Securities Risk
Management Risk
Market and Geopolitical Risk
Non-diversified Risk
Swap Risk
Rebalancing Risk
Trading Halt Risk
Tracking Error Risk
US treasury Risk
Tax Risk
(Good luck memorizing all of these)
What was the stock that lost a ton of value in the market due to accounting practices?
Super Micro Computer (SMCI)
What are the two main functions of Technical Analysis?
Identification
Forecasting
What is identification?
Identifies and describes past and present price action
Serves as a historical record of what has transpired in the markets
What is forecasting?
Once price or market action is identified, the technician may interpret the information to infer what the data actually means before inferring future price action
Inference based on assumptions that price patterns are repetitive to some reasonable degree
What are the three approaches to price forecasting?
Fundamental Analysis
Technical Analysis
Information Analysis
What is a Trend?
A directional movement of price that remains in effect long enough to be identified and still be profitable
An Uptrend has higher peaks and higher troughs
A downtrend has lower troughs and lower peaks
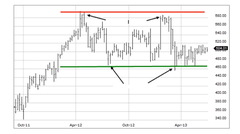
A sideways (flat) trend occurs when prices trade bound by support and resistance
Picture of Downtrend

Picture of Uptrend

Picture of Sideways trend
How are trends identified?
-Linear Least-Square regression
-Moving Averages
-Trend lines
What are trend lines?
lines drawn from top-to-top and bottom-to-bottom
Helps get a "feeling" of price direction and limits
What does the "fractal" nature of trends mean?
It is the ability of trends to act similarly over different periods
(T/F) Determining when a trend begins and ends is the same regardless of trend length and time period?
TRUE
(T/F) Pattern analysis is universal and independent of time.
TRUE (hopefully I've gotten the point across)
What are the lengths of trends?
Primary (months or years)
Secondary (weeks or months)
Short-term (days)
Intraday (minutes and hours)
What are the Basic Beliefs of Technical Analysis?
Price is determined by Supply and Demand
Price discounts everything
Prices are nonrandom
History will repeat itself
Trend lines and price patterns are fractal
Emotions are affected by earlier emotions (emotional feedback)
What are the basic tenets of Dow Theory?
The averages discount everything (pricing in information)
The market has three trends
Primary trends have three phases
A trend persists until its reversal is indicated
the averages must confirm one another
Volume must confirm the trend
Who is the father of modern technical analysis?
Charles Dow (Dow theory and Dow Index)
What industries did Dow's first stock index contain?
Railroad (9) and Industrials (2)
What are the three Dow Theory Hypotheses?
1. Primary trend is inviolate
2. The averages discount everything
3. Dow Theory is not infallible
Primary trend is inviolate
While the secondary and minor motion of the averages could be manipulated, the primary trend CANNOT be manipulated
The averages discount everything
Prices are the result of people acting on their knowledge, interpretations, and expectations
Dow Theory is not infallible
Investment requires serious and impartial study
Ideal Market picture according to Dow Theory theorems

What are the Dow Theory Theorems?
1. The ideal market picture consists of an uptrend, top, downtrend, and bottom - with retracements and consolidations in there
2. Economic rationale should be used to explain stock market action (Why Dow included industrial and railroad averages)
3. Prices trend. (Prices have a general direction in which they move)
What are the Dow Theory Trends?
Primary Trend (most important)
Secondary Trend (intermediate trend)
Minor Trend
Primary Trend
Represents the overall, broad, long-term movement of security prices
Duration of this trend can be several years
Secondary Trend
Runs counter to the primary trend
A secondary, deceptive reaction to the primary trend
Usually lasts a few weeks to months and can retrace 33-66% of the gain
Minor Trend
• The stock market is not logical in its movements from day to day.
• Typically, unimportant and can be considered noise.
What is the longest of the three trend types?
Primary trend (Can be several years. Overall, broad, long-term movement of security prices)
What is the most important factor of successful speculation?
Correct determination of the primary trend
What are primary bull markets characterized by?
1. Reviving confidence from the prior primary bear market
2.Represents the response to increased corporate earnings
3. Speculation becomes dominant and prices rise on "hopes and expectations"
What are primary bear markets characterized by?
1. Abandonment of hopes upon which stocks were purchases
2. Selling due to decreased earnings
3. Distress seeing, regardless of value, by those who believe the worst is yet to come/those forced to liquidate
Example of Dow theory trends

What is Confirmation?
the necessary means for recognizing in what direction the primary trend is headed
What are the usual method of confirming a primary trend today?
Confirmation between S&P 500 (Large Cap Stocks) and Russell 2000 (Small cap stocks)
Example of confirmation

What is the importance of Volume?
Volume can be an important SECONDARY confirmation signal
What are examples of Volume confirmation?
High market prices accompanied by less volume on rallies and more activity on declines usually suggests an overbought market
Extremely low prices with dull declines and increased volume on rallies suggest an oversold market
Example of volume confirmation

What are the criticisms of Dow Theory?
1.Investors will act after rather than before at market tops and bottoms
2.The different trends are not strictly defined
3.Dow Theory is too specific about requirements needed to identify a change in trend
(T/F) The Stock Market is logical in its movements from day to day.
FALSE (is not logical day to day)
What captures all information about the supply and demand for a security?
Price
What are the benefits of using charts?
Charts provide concise price history
Charts can provide a good sense of market volatility
Charts can be a useful tool for fundamental analysis (correlation of fundamental event to price movement)
Charts can serve as a timing tool
Chart can be used as a money management tool
Charts reflect repetitive patterns in market behavior
What is the importance of Price?
A summary of supply and demand
Represents market forces (Patterns, Volatility)
Fundamental analysis
What are the three most common types of charts?
Line Charts
Bar Charts
Candlestick Charts
Point and Figure Charts
What is the most basic type of chart, usually based on the closing price for the day?
Line chart
What are also called vertical line charts, they also record the high and low for the day?
Bar Charts
What evolved from bar charts but were visually more appealing and became widely used?
Candlestick Charts
What chart only records price changes that deviate from earlier prices by a specified amount?
Point-and-figure Charts
Line Charts
Most basic type of chart
Continuous line
Information on price and time
Only plots closing prices
useful when studying Long-Term Trends
Helps identify support and resistance levels, trends, and patterns
Bar Charts
Show at least three pieces of info (High, Low, and close price for each time interval)
Time interval = one bar
Bar Chart Example

Candlestick Charts
High and low are shown by thin line (wicks) above or below body of the candle
Filled/Red Candle = lower than open
Hollow/Green Candle = higher than open price
Example of Candlestick chart

What is a doji?
A doji is when a security's open and close are virtually equal (looks like the candle almost isn't there)

What are the two types of scales that are used on stock charts?
Arithmetic Scale
Semi-Logarithmic Scale
What is an arithmetic scale?
It shows the price units along the vertical scale at the same price intervals.
Ex) Distance of a change from $1 to $2 would be the same a change from $10 to $11 or $100 to $101
What is a semi-logarithmic scale?
Vertical distance represents the same percentage change in price
Ex) Price increase from $1 to $2 (100% increase) would show up as a way larger increase than $100 to $101 (1% increase)
Which scale does Prof Wilson say that we should use?
Semi-Logarithmic (It is better used when looking at a securities price movement over long periods of time, like 20 years for example)
What is commonly portrayed at the bottom of the price chart, with its own scale, using a vertical bar to represent the Toal volume for each interval?
Volume
When a price advance halts with high volume...
Potentially a top
When price decline halts with high volume...
Potentially a bottom
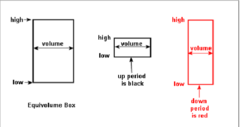
What is an Equivolume chart?
Equivolume box consists of three components (price high, price low, and volume)
How Equivolume is shown?
Price high = top of box
Price low = bottom of box
Volume = width (Wider the box the more volume that time period)
Equivolume Example
What was the tool used in class to show Fed rate cut probabilities?
CME's FedWatch Tool
What did the Fed do after the September (2024) meeting?
Cut Fed Funds rate by 50 basis points (0.50%)
What are the Keys to Profit?
1. Determine, with minimum risk of error, when a trend has begun, at its earliest time and price
2. Select and enter a position in the trend that is appropriate to the existing trend, regardless of direction
3. Close the position when the trend is ending
What is the basis of trend analysis?
Trends define a direction in prices
Trends are fractal, behavior is the same regardless of period
Trends tend to continue rather than reverse
Any particular trend is influenced by its next larger and next smaller trend
Uptrend
Higher highs (peaks) and higher lows (troughs)
Downtrend
Lower highs (peaks) and lower lows (troughs)
Trading range
Peaks and troughs at same relative level
(T/F) Trend will always be always be straight up or down
FALSE
The trend is the direction and there can be retracements and consolidations
What are trading rangers also known as?
consolidation or congestion areas
What is a resistance point?
When prices rise then reverse downward, the highest point of the rise is referred to as a resistance point
What is a support point?
When prices decline then reverse upward, the lowest point of the decline is a support point
What happens with previous support points are broken?
The previous support will become the new resistance point and vice versa
Example of resistance and support

Ways reversal points are determined? (I'm not sure if we need to know these or not)
DeMark or Williams Method
Percentage Method
Gann Two-day Swing Method
High Volume Method
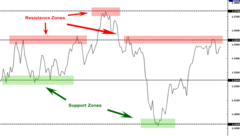
How are support and resistance zones drawn?
To construct a support (or resistance) zone, draw a horizontal line through each significant trough (or peak) in the past and future
Where these lines bunch together around the same price level is the support or resistance zone
Support and resistance zone
What are the two major ways that analysts use trading ranges?
Mean reversion
Breakout Trading (We focus on this one)
What is Breakout Trading?
Once the price breaks out of the trading range, positions are put on
What are the three main tools to determine trend reversals?
Regression Line
Trend line
Moving Averages
What are trend lines?
Trend lines are drawn with a ruler
Need at least two support or two resistance levels
Accelerating and decelerating trend lines (fan lines)
Moving averages
Simple average of prices over a specified time period
Regression Line
Line of best fit for the Data
Can add standard deviation to the line to provide bounds for data