Veg meg midterm
 Call Kai
 Learn
 Practice Test
 Spaced Repetition
 Match
 Flashcards
 Knowt Play
1/102

Earn XP
Description and Tags
From (Study Guide) & Video quiz
103 Terms
Inventory
systematic collection of information describing the resources at a particular time. (What is here?)
Assessment
Evaluation of current ecological conditions relative to some expectation, reference, objective or criterion (What condition is it in?)
Monitoring
Repeated measurements thru time used to detect change & evaluate progress toward objectives. (Is it changing? Are we meeting our objectives? Did our treatment work?)
Explain how ecological questions are translated into measurable evidence and progression from measurement → analysis → interpretation → informing management decisions
Recognize the importance of distribution, abundance and change thru sapce and time
Distinguish between target population and population of inference
Target population: where we want conclusions to apply
Population of inference: where the sampling design allows conclusions to apply.
How can site selection affect relationship between target population and population of inference?
Poor or restricted site selection can make the population of inference smaller than the target population.
Evaluate factors that should influence site selection and explain why the ecological or management question should determine which variation matters.
Factors include:
Physical environmental (soils, topo, climate, hydrology, ecological site)
Vegetation (species composition, distribution, state, rare species, invasive species)
Animal, Disturbance, management (livestock & wildfire use, timing of grazing, animal concentrations, water & salt locations, fire, treatments, roads, other disturbances)
Scale and logistics (Size & area of boundaries, acces, management units, fences, sampling feasibility)
These factors might explain the response we are studying so we need to evaluate our question, the differences between study sites and how much those factors might have to do with our question.
Site selection has 2 jobs
Represent the population we want to understand
Capture or control the variation relevant to our question
Exclusion criteria
Pre-established conditions that make a potential sampling location unsuitable for answering the study/monitoring question.
Should be justified by the question and target population.
EX: Should you include/exclude roads, rocky outcrops, steep slopes??
Explain how selection/exclusion criteria and documentation reduce problems with site selection
It justifies your decisions for choosing not to sample in a certain area. It establishes parameters for site selection which can help with repeatability. And it can help identify and reduce bias because the exclusion criteria explains why you don’t select a site for your study.
Every site selection choice must be
Deliberate (tied to criteria)
Documented (so others can repeat it)
Defensible (in management and in court)
3 types of areas for site selection
Critical area: Areas that should be evaluated separately from other areas in management unit because they have special or unique values.
Key area: Areas that reflect what is happening on a larger area as a result of on-the-ground management actions
Reference area: areas where natural biological and physical processes are functioning normally
How to select a Key Area
Need to
Represent the area in which its located
Contain key species
Be capable of showing a response to management action
Key species
Important part of plant community, indicates change
Key species may change from season to season.
tied directly to objectives
Document criteria for selecting key species
Can be forage oriented, wildlife habitat oriented or indicator only
Why should we stratify
Landscapes can contain a lot of variability which makes it harder to draw reliable statistical inferences so we break down the big landscape into pieces that are similar to one another.
How do we stratify
Geography & topography
similar vegetation, soil type, management, current status
Response to changes in management or disturbances
What should photo monitoring include
Date, location, project, plot/site name, Bearing, coordinates, other details
Vegetation Measurements Toolbox (10)
photo monitoring
plant species inventory
biodiversity
cover
density
frequency
biomass/production
utilization
structure
fuel
Photo monitoring
Strengths: permanent visual record, inexpensive, spatial patterns, allows for comparison
Limitations: viewpoint/season differences, difficult to ID species, not quantitative data
Uses: plant abundance, plant/patch size, vegetation cover, spatial distribution shifts
Plant species inventory
Systematic record of the plant species present in defined area
Uses
Detect important species
describe community composition
track change
inform management
Biodiversity
Variety of species within a community, including both the number of species present and their relative abundances
Uses:
Describe community structure
Detect ecological change
Compare communities
Inform management
Cover
The proportion of the ground surface occupied by vegetation or other surface features. Expressed as percentage
Uses:
plant abundance, community composition, ground protection, habitat structure, change thru time, treatment success
Density
The number of individual plants per unit area
Uses:
population abundance, establishment & recruitment, population change, treatment response, rare or invasive species
Frequency
The proportion of sample units in which a species occurs (yes/no).
How consistently it occurs across an area NOT how many individuals are present.
Uses:
describe distribution, detect change, evaluate treatment

Biomass & Production
Biomass: amount of plant material present per unit area at a given time
Production: the amount of new plant biomass produced per unit area during specific time
Uses:
Forage availability, site productivity, treatment & disturbance response, fuel loads
Utilization
Measuring something that has been removed
Tells us what happened during a grazing period but NOT whether grazing was good/bad
Uses:
evaluate grazing intensity, assess management objectives, understand grazing distribution, inform future management

Vegetation structure
Describes the physical arrangement of vegetation, particularly its height and vertical distribution
Uses:
wildlife habitat
grazing/forage condition
fuel structure
Fuels
Wildland fuels are living and dead plant materials that can ignite and contribute to fire behavior
Uses:
predict fire behavior, assess fuel continuity & conditions, characterize fuel load
Video quiz questions
why are multiple transects generally preferred over a single transect wihtin a monitoring plot?
They better capture variability within the plot
why might you use more than one monitoring method at a site?
Different methods provide information about different attributes of the ecosystem
What is the first step in developing a monitoring program
Clearly defining the objectives of the monitoring
what is the primary purpose of monitoring rangelands
to detect change and provide information for management decisions
why should the pin be dropped vertically at each sampling point in during a line-point intercept transect
to provide a consistent sampling point and avoid bias in which plants are intercepted
At each point along a line-point intercept transect what is recorded?
Each plant species intercepted verticaly and the soil-surface category
what does the line-point intercept method primarily measure?
vegetation cover and soil surface cover
Why is a plant species inventory often conducted alongside other vegetation measurements?
provides a record of the species present that can help with subsequent monitoring and interpretation
Why are multiple transects generally preferred over a single transect within a monitoring plot?
they better capture variability within the plot
Pros & cons to density
Pros: Fast and easy, Insensitive to seasonal/yearly variation, Works well in sparse vegetation
Cons:
only gives # individuals present NOT plant size, cover, biomass, vigor.
defining an individual can be difficult
may not reflect ecological importance (high density but little biomass/cover)
Sampling design (4)
Non-random: we deliberately choose where to sample
simple random: anywhere randomly
Systematic: regular spacing after random start
Stratified random: randomly within predefined groups
You’ll combine these approaches into a defensible sampling design
how many sampling units do we need?
Need to characterize population with precision needed to meet objective.
Variability in population —> desired precision —> available resources
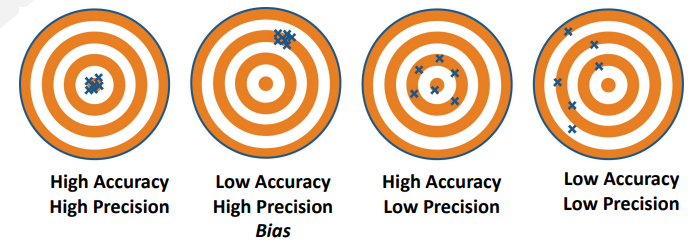
**Bias, accuracy & precision
Bias: tendency for our sample to over/underestimate the true population value
Accurate: how close our estimate to the true population value
Precision: how much uncertainty or variability there is in our estimate
we prefer low accuracy but with high precision over high accuracy low precision
Standard deviation & Standard error
Standard deviation: Describes the variability among samples
High SD: sample values are more spread out, greater variability
Low SD: sample values are more similar, less variability
Standard error: describes the uncertainty in our estimate of the population mean
High SE: more uncertainty in estimate, lower precision
Low Se: less uncertainty, higher precision
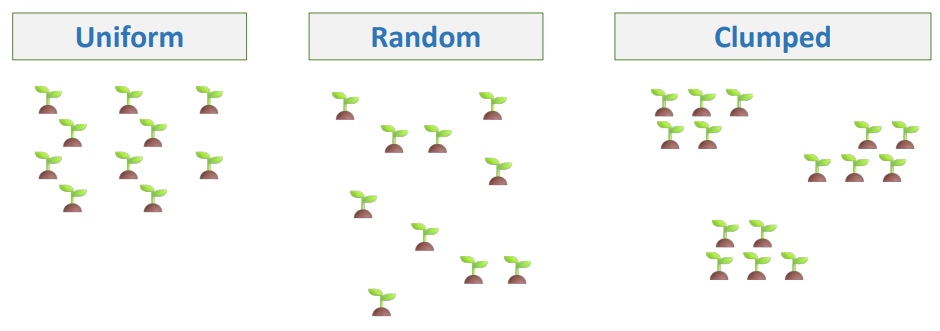
Sampling designs for uniform, random and clumped distribution
Uniform: Systematic & simple random sampling
Random: Systematic & simple random sampling
Clumped: Stratified random sampling (may need more samples to characterize the population)
Quadrat
sampling unit with known area
Quadrat size depends on
Size of plants: large plants = large quadrat
spacing/density: Sparse = large
spatial pattern: clumped = larger/more quadrats
target species & objectives
Needs to be big enough to capture vegetation and small enough to sample efficiently

Too small / too large quadrat
Too small:
lots of zero counts
high variability
more plants fall on boundaries
poorly represent sparse/large plants
Too large:
more time per quadrat
can average over fine-scale patterns
inefficient for small, abundant plants
As quadrat size increases
Perimeter:area ratio decreases
More edge = more borderline decisions
(Smaller quadrats have more edge relative to area sampled)

Plant species inventory protocol
Mark out standard plot area of 1641 m2
search entire plot for 15 minutes with 1 person searching, other recording
move systematically thru plot
record a plant only if >50% of base is inside plot boundary
flag unknown species to identify after 15 min
7 Functional groups
Large perennial bunchgrasses (LPBG)
Small perennial bunchgrasses (SPBG)
Invasive annual grasses (IAG)
Annual forbs (AF)
Perennial forbs (PF)
Shrub
Trees
Pros & Cons to Frequency
Pro: repeatable, fast, describes distribution, good for detecting change
Con:
Doesn’t tell us what changed (density, cover or spatial pattern)
Dependent on quadrat size & shape
Can lose sensitivity in the extremes at 0% or 100%
Requires accurate species ID
Pros & Cons to Cover
Pros:
ecologically meaningful (related to abundance, community composition, habitat and soil production)
Efficient and repeatable
Multiple variables from one method (LPI can give species, function group cover, total cover and ground cover
Non-destructive
Cons:
Sensitive to timing & environment conditions (precipitation, phenology, season. Require consistent sampling timing)
Sensitive to grazing and disturbance
Method matters (how you define cover; using visual estimates can introduce bias)
Rooted frequency, shoot frequency & mere presence
Rooted frequency: species is present when it’s rooted in the quadrat
Shoot frequency: species is present when at least one rooted shoot is in the quadrat (goof for rhizomatous/stoloniferous species)
Mere presence: Species is present if any of the part occurs in the quadrat even if its rooted outside
Rule must be applied to and consistent across all quadrats & observers
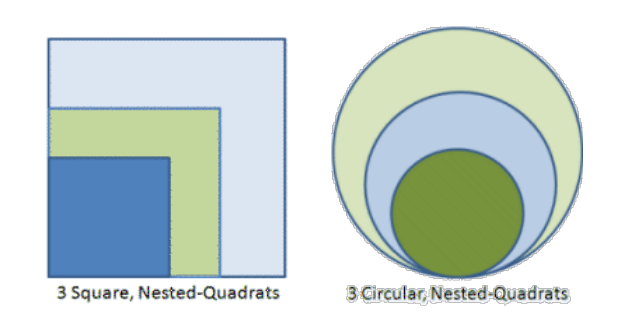
Collecting nested frequency
start with the smallest quadrat, record the species present.
Go to the next largest quadrat and record additional species encountered
(High frequency at small size suggests species is widespread across the sampled area.)

Types of cover
basal
canopy
foliar
ground
Basal Cover
Area occupied by plant bases at the soil surface
more stable year to year, less affected by grazing utilization.
Good for long-term trend comparisons
Measure for long-term vegetation change

Canopy cover
Area beneath the outer perimeter of plant’s canopy
based on outer perimeter of the canopy
includes gaps between stems & leaves
sensitive to weather, growth and grazing
Can exceed 100% when cover is summed across species or vegetation layers
Measure for vegetation structure or habit

Foliar cover
Vertical projection of exposed leaf area. Equals the shadow cast by the plant
overlapping foliage counted once. Openings in canopy excluded
highly susceptible to yearly fluctuations due to climatic and biotic factors
difficult to measure for some growth forms. Easiest to measure with broad leaved forbs, shrubs and succulents
Measure if you want actual leaf area or current vegetation response

Ground cover
What is protecting/occupying the soil surface.
Measured to look at soil protection, erosion risk and resistance to invasion.
(plant base, rocks, duff/litter, moss, biocrust, mineral soil)
Methods for estimating cover (3)
points
step point, line point intercept
Line
line intercept
Area
Ocular
Daubenmire
methods for estimating cover
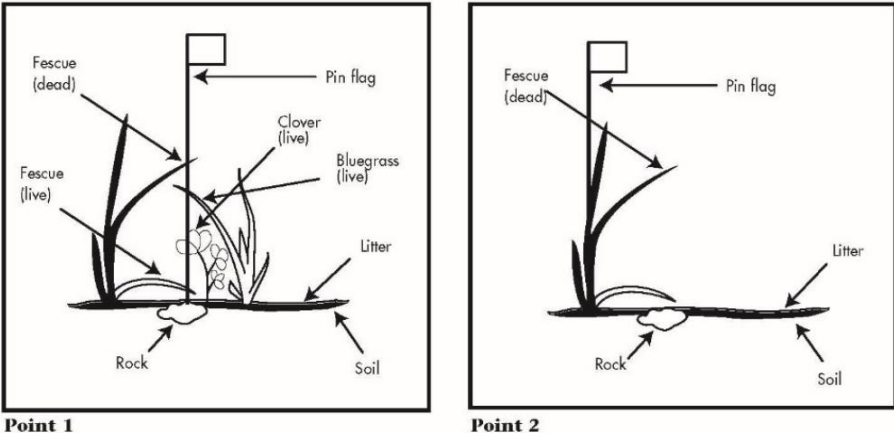
what counts as a hit in a point intercept method
one point can have multiple vegetation hits but only one soil-surface hit
Cover =
(number of points with a hit/total number of points) x 100

Step point technique
select a bearing across landscape and at step intervals, record the cover type at the sampling point

Line intercept
Measure the length of a line intercepted by vegetation.
record where each plant intercept begins and ends or record the total intercepted length
intercepts count as:
Same species: overlapping canopies only count once
different species; measure each species separately
small gaps: use a defined gap rule
Cover = (total intercept length / total line length) x 100

Cover vs composition
Cover: how much of the ground is covered by this vegetation?
total intercept length/total line length
Composition: of the vegetation present, how much belongs to each group?
grass canopy cover/total vegetation cover
composition sums to 100%!!!
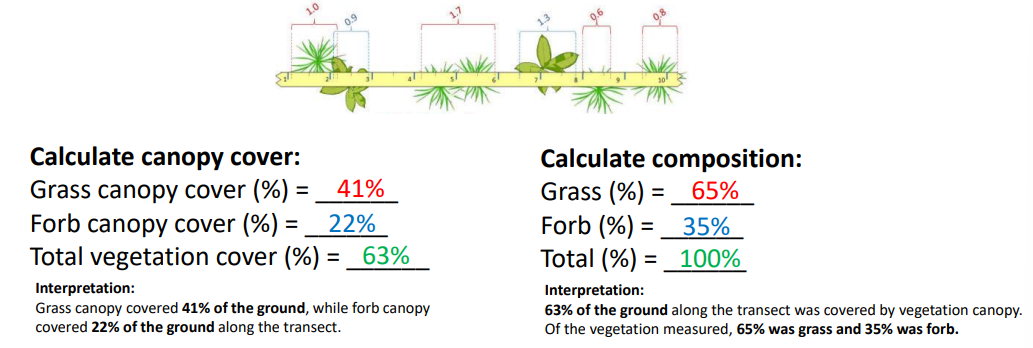
Ocular estimates with plots or quadrats
Estimate the proportion of a defined area covered by vegetation
Efficient, good for detecting rare species
How to:
place quadrat frames along transect at specified intervals
estimate each species independently
species can overlap vertically so summed species canopy cover may be over 100%
**Daubenmire method (type of ocular estimate for cover)
Semi-quantitative ocular estimate of canopy cover
Each species is assigned to one of 6 cover classes
Cover classes are converted to midpoints for analysis
Use frame markings to calibrate estimates
Average across quadrats to estimate mean cover for each species

Biomass Pros & Cons
Pros:
direct & quantitative
comparable
ecologically meaningful
can indicate dominance based on plant mass. reflects veg structure and resource accumulation.
useful for management
forage availability, fuel load, vegetation productivity
Cons:
Time & labor intensive
destructive sampling
difficult for woody vegetation (trees, belowground biomass)
highly variable
timing matters
biomass changes with plant growth and herbivory
peak standing crop changes according to species & sites
Gross primary production (GPP)
total carbon fixed by plants thru photosynthesis
Plant respiration (R)
Carbon released as CO2 when plants break down sugars
Net primary production (NPP)
The rate at which plants accumulate carbon in new organic material after accounting for plant respiration
Carbon available for building new plant tissue
NPP = GPP - R
Standing biomass (standing crop)
The amount of plant biomass present per unit area at a given time
Peak standing crop
maximum standing biomass observed during a growing season
Residual biomass
plant biomass remaining at a specified time, often following grazing or at the end of a growing season
herbage
aboveground biomass of herbaceous plants (grasses, grass-likes and forbs)
woody biomass
mass of woody plant material. includes stems, branches and twigs
Browse
Leaves & tender shoots of woody plants available for browsing animals
Forage
Herbage or browse that is accessible and suitable for grazing and browsing animals
Necromass
dead plant material. Includes standing dead vegetation, downed woody material and litter
Mast
fruits, nuts and seeds
Methods of measuring biomass (3)
Direct measurements
harvesting, drying and weighing vegetation
Visual estimation
use reference units or comparative yield
Double sampling
combine visual with harvested
Direct measurement - harvest
select sampling locations (quadrat size and sampling design)
Define what will be harvested (species, plant part, growth period)
Clip vegetation
dry & weigh
calculate biomass per unit area
convert dry mass per quadrat to kg/ha or lb/acre
**Fresh weight vs Dry weight
Fresh weight: includes plant tissues and water
varies with species, growth stage and environmental conditions
Dry weight: plant tissue, no water
more consistent basis for comparing plant biomass
Ex: 100 g of fresh grass would contain less dry biomass than 100 g of dormant grass
Use the chart to estimate dry mass

Reference unit method
Estimate biomass by comparing vegetation to reference unit with known mass
Estimated biomass = number of units x dry mass per unit

Comparative Yield Method
Estimate biomass by comparing sample quadrats to reference quadrats representing increasing amounts of biomass
establish five reference quadrats for range of biomass at the site (1 = lowest, 5 = highest)
Assign a rank (1-5) to each sample quadrat based on similarity to reference quadrats
Clip, dry and weigh the reference quadrat to determine the biomass associated with each rank
estimate biomass in sample quadrats using the calibrated ranks.

Double sampling
estimate biomass in all sample quadrats using visual estimate
Select a subset of quadrats for harvesting. Use a sampling design that represents the biomass variation
clip, dry and weigh the vegetation in the selected quadrats to get measured biomass
Develop relationship between estimated and measured biomass. Use it to predict biomass in remaining quadrats. (linear progression)
Remember: quadrats should be estimated first then random procedure should be used to pick plots to be clipped.
Allometric relationships
Used to estimate biomass of shrubs and trees
Crown area (area of circle)
Crown volume (area of cylinder)
Utilization % =
(Forage removed/total forage produced) x 100
ex: Total forage production: 1000 lb/acre
forage removed: 300 lb/acre
utilization = 30%
Relative use vs annual utilization
Relative use: proportion of forage produced to date that has been consumed by animals
We’re looking for just one month so the denominator will be the production for that one month
ex: the relative use for the month of July
100/200 = 50%
Annual utilization is interested in the whole year. Denominator will be the production for the end of the growing season.
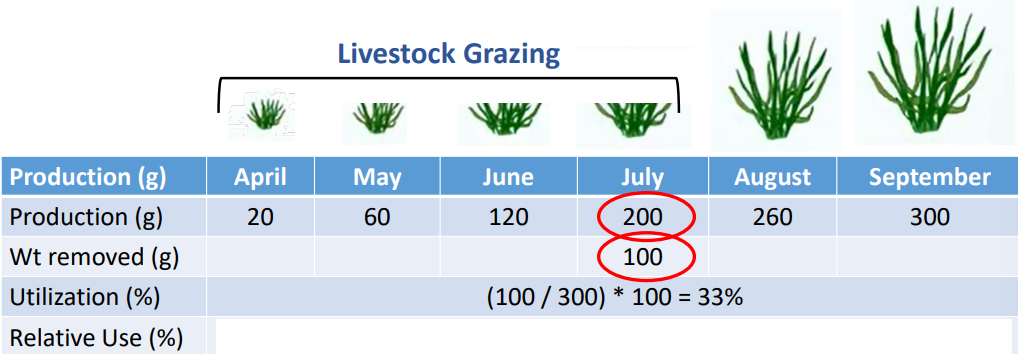
harvest efficiency vs utilization
Harvest efficiency: percent of forage production consumed by grazing animals, excluding forage lost thru other ways
Utilization: includes forage removed through trampling, fouling, etc.
50/25/25 guideline
50% remains to support plant growth, recovery and soil
25% is eaten by grazing animals
25% is allocated to other losses (trampling, fouling, inaccessible)
where do we measure utilization
key areas: representative area used to evaluate grazing
critical areas: requires special attention due to sensitive resources
utilization measurement methods
Direct comparisons
Paired plots
unpaired plots
Indirect
Grazed-Class method
landscape appearance method
Grazed-plant method
Height-weight (using the wheel)
Paired plots
establish pairs with similar vegetation before grazing starts
similar vegetation, comparable site conditions. Repeat it
Randomly assign 1 plot in each pair to be caged
clip, dry and weigh current-year biomass in both plots
Calculate utilization (removed/produced)
unpaired plots
caged & uncaged plots sampled independently, not in pairs
Compare mean biomass of protected and grazed plots
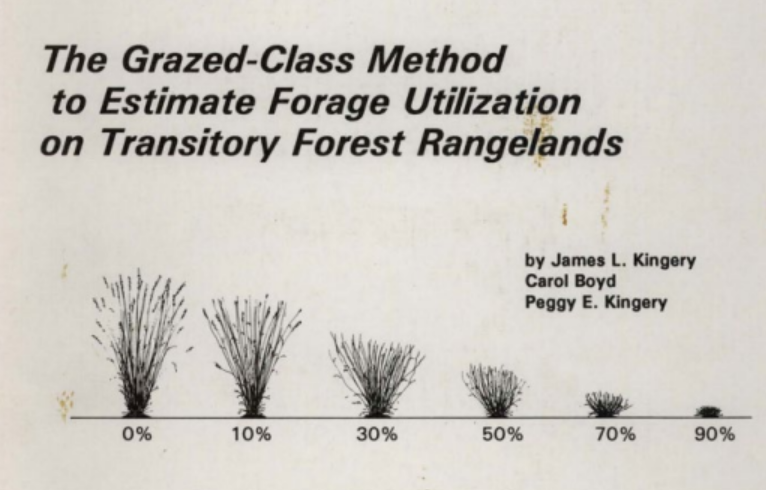
Grazed-Class method
Visually estimate proportion of ofrage removed from individual plants by
comparing plants with species-specific photograph guides
assigning each plant to a grazed class (0,10,30,50,70 or 90%)

**Landscape Appearance method
visually assess grazing intensity based on appearance of vegetation
sample at intervals along transect
assign observations to utilization classes using standardized descriptions
calculate mean estimated utilization using class midpoints
land PKS

Grazed plant method
sample plants along transect
classify as grazed or un-grazed
find percentage of plants grazed
use regression to estimate utilization
EX: percent of plants grazed = 60%
Plug into regression equation: y = 0.8377(60) - 3.4316 = 46.8%