Micro Economics
 Call Kai
 Learn
 Practice Test
 Spaced Repetition
 Match
 Flashcards
 Knowt Play
1/86

There's no tags or description
Looks like no tags are added yet.
87 Terms
What is the Professor’s St. Claire’s brother’s name?
,Max (DONT FORGET THE COMMA)
Chapter 1: Supply Curve
It’s the production for products and goes upwards on the PPF
Chapter 1: Demand Curve
It’s the demand for wants and needs and goes downwards on the PPF
Chapter 1: Equilibrium
The price on the PPF where supply and demand meet (everyone’s satisfied) (middle intersection on PPF)
Chapter 1: Production Possibility Frontier
A curve that shows the maximum feasible amount of two goods that can be produced with available resources and technology. It illustrates the trade-offs between the production of different goods.
Chapter 1: Market Failure
When a Market left on its own does not allocate resources efficiently.
Chapter 1: Scarcity
The limited nature of society resorues.
Chapter 1: Economics
The study of how society manages its scarce resources.
Chapter 1: If people want one thing, what do they face?
People face trade-offs. They must give up one thing in order to get another thing.
Chapter 1: What is efficiency in economics?
The property of society getting the most it can from its scarce resources.
Chapter 1: What is equality in economics?
The property of distributing economic prosperity uniformly among the member of society.
Chapter 1: Opportunity Cost
Whatever must be given up to obtain some item.
Chapter 1: Rational People
People who systemically and purposefully do the best they can to achieve their objectives.
Chapter 1: Sunk Cost
What has already occurred and cannot be recovered: it should not determine a current marginal decision.
Chapter 1: Incentives
Something that induces a person to act. It can sometimes create unintended consequences.
Chapter 1: Marginal Change
An incremental adjustment to a plan of action.
Chapter 1: What do Policies intend to do regarding to Equality and Efficiency
Increase equality that can involve trade-offs with incentive and efficiency.
Chapter 1: Can Trade make everyone bettter off?
It CAN, but NOT ALWAYS
Chapter 1: Marginal Rate of Transformation
The opportunity cost of what the producer gives up.
Chapter 1: Market Economy
An economy that allocates resources through the decentralized decisions of many FIRMS and HOUSEHOLDS as they interact in markets for GOODS and SERVICES.
Chapter 1: What is Adam Smith’s idea and what is it associated with?
Adam Smith’s idea is “Invisible Hand”, and it’s related to the market economy guiding itself (people within the economy) to promote general economic well being.
Chapter 1: How does the Government interact with the Market Economy?
Enforcing property rights, promoting efficiency, or addressing distributional concerns.
Chapter 1: Externality
The production or consumption of a good affect’s bystanders.
Chapter 1: Positive Externality vs. Negative Externality
An action that avoids problem (taking vaccines to prevent sick contamination) vs. An action that causes a problem (pollution)
Chapter 1: Market Power
A buyer or seller has substantial influence over market price.
Chapter 1: Property Rights
The ability of an individual to own and exercise control over scarce resources.
Chapter 1: Business Cycle
Fluctuations in economic activity, such as employment and production.
Chapter 1: What is a country’s standard a of living depends on?
It’s ability to produce goods and services (productivity)
Chapter 1: What happens when too much money is created?
Prices rise (inflation)
Chapter 1: Macroeconomic Term
Society can face a short-run trade-off between inflation and unemployment.
Chapter 2: What dose and economist do?
They use observation, theory, data, assumptions, and models to study how the world works.
Chapter 2: What is the scientific method of studying how the world works that economists use?
The method involves observation, developing a theory, and furthering observation to evaluate the theory.
Chapter 2: How do Economists learn about the economy?
They often view controlled experiments as impractical, so they also learn from natural experiments and historical evidence.
Chapter 2: How does models help Economists?
They simplify reality by deliberating omitting details so important relationships are easier to understand. Models are built on assumptions and can be revised.
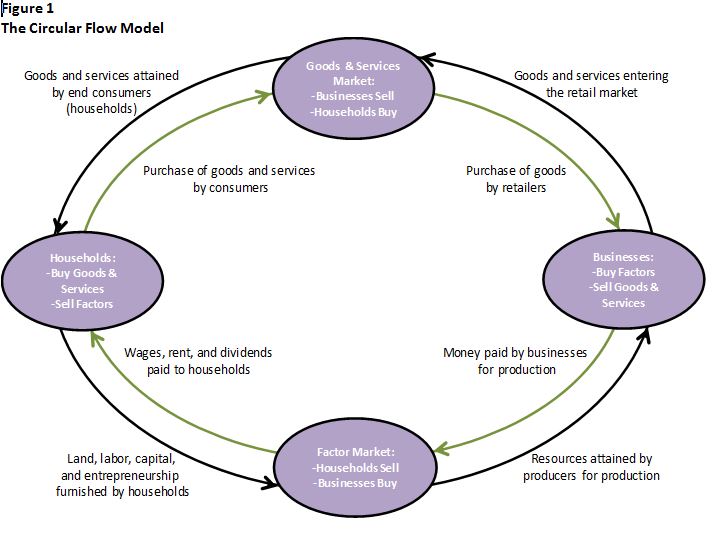
Chapter 2: What is the Circular Flow Diagram?
A visual model of the economy that shows how dollars flow through markets among households and firms.
Chapter 2: How do firms and households interact with each other in markets for goods and services?
Firms produce and sell goods and services and households buy goods and services. (The flow of inputs and outputs goes right and during the upper half of the diagram).
Chapter 2: How do firms and households interact with each other in markets for factors of production?
Households sell labor, land, and capital and firms hire and use factors of production (The flow of inputs and outputs goes left and at lower half of the diagram.)
Chapter 2: How does dollars work in the markets for goods and services?
Households spend money on goods and services, and firms use that revenue to hire factors of production with wages, rent, and profit, which turn into income for households. (Flow of income rotates counterclockwise)
Chapter 2: What does the circular flow market look like?
Chapter 2: What happened if the PPF shifted outward
More resources or improved technology
Chapter 2: Why does a bowed out PPF curve have increasing opportunity cost?
Resources differ in their suitability for producing the two goods.
Chapter 2: Opportunity Costs Calculations
Item whose cost you are finding the denominator; what is given is the numerator.
If producing 20 additional airplanes requires to give up 1,000 tons of soybeans:
Opportunity costs of 1 airplane = 1,000 / 20 = 50 tons of soybeans
Opportunity cost of 1 ton of soybeans = 20 / 1,000 = 0.02 airplane
Chapter 2: Why would economists disagree with each other?
Due to different scientific judgements about theories or the size of economic relationships or they may simply have different values.
Chapter 3: Interdependence
Relying on other people or countries for good and services while providing to be self-sufficient.
Chapter 3: Imports are what?
Goods and services that are produced abroad and purchased domestically.
Chapter 3: Exports are what?
Chapter 3: Goods and services produced domestically and purchased by foreign buyers.
Chapter 3: Absolute Advantage
Compares productivity or the inputs required to produce a good. The producer who can produce more with fewer inputs have the absolute advantage.
Chapter 3: Comparative Advantage
The ability to produce a good at a lower opportunity cost than another producer. This is the basis for mutually beneficial specialization in this model.
Chapter 3: Opportunity Cost Reciprocal:
if 1X costs 2Y, then 1Y cost 1/2X
Chapter 3: What is the Comparative Advantage Calculation Method?
1) Choose which product is X and which is Y.
2) Determine X and Y or the maximum output of each good
3) Cost of 1X = Y / X
4) Cost of 1Y = X / Y
5) Compare the two producers’ costs of X.
6) Compare the two producers' costs of Y.
7) Determine Absolute Advantage separately by comparing
Chapter 3: Why can’t someone determine comparative advantage just by looking at it?
Comparative advantage requires the opportunity cost calculation.
Chapter 3: Can a country consume more than out of it’s PPF?
Yes, that is one of the gains of trade.
Chapter 3: Trading Price/Terms of Trading
A mutually beneficial trading price most fall between the two producers’ opportunity costs. Convert a stated trade into a per-unit rate before comparing it with each producers’ opportunity cost.
Chapter 3: Example of Trading Price/Terms of Trading
If Producer A gives up 0.5Y to produce 1X and Producer B gives up 1.5Y to produce 1X. a trading price between 0.5Y and 1.5Y per Y can rvide gains to both sides.
Chapter 4: What is a market?
A group of buyers and sellers of a good or service.
Chapter 4: How many buyers and sellers are in a competative market?
Many sellers and Many buyers
Chapter 4: What does demand represent?
Consumers and their decisions making process
Chapter 4: What does demand represent specificaclly
How much consumers would buy at every possible price
What is Quantity demand?
Quantity Demanded (Q^D) is the amount (or quantity) of a good that buyers are willing and able to purchase
Chapter 4: What is Q^D value correspond?
Price
Chapter 4: What relationship does Price and Wuanityt Demanded have?
Negatively (As price rise, quantity demanded falls)
What is the Law of Demand?
As price rises, quantity demanded falls ceteris paribus (holding all else constant or equal)
Market Demand curve is the sum of individual demand curves
True
The heigh of the Demand curve tells us the __ consumers are willing to pay (for that unit)
Most
The height of Demand curve tells us the Marginal __ (of that unit)
Benefit
What is consumer surplus
Amount willing to pay - amount actually must pay
Where is consumer surplus on a supply and demand chart?
Above the supply curve and below the demand curve
What does supply represent?
Producers and their decision making process
What is QUANTITY SUPPLIED?
The amount) or quantity) of a good that sellers are willing and able to sell
What is Supply?
The entire set of prices and corresponding quantity supplied values for a given market.
Supply represents how much would be produced at…
Every possible price point
What is the relationship that Price and Quantity supplied have?
Positively
Law of Supply
As price rise, quantity supplied rises
The sum of all individual supply curves yields the Market Supply curve
True
The height of supply curve is the __ the seller is willing to accept
Least
The height on the Supply curve tells us the Marginal ___ (of that unit)
Cost
What is Prodecer Surplus?
(The difference between the price suppliers actually receives (i.e. market price) and the minimum price they would be willing to accept)
Where is the producer surplus?
Above the supply curve and below the demand curve
What is equilibrium?
P^E = (Q^D = Q^S)
in Economic Efficiency, a situation in which __ of the potential gains from trade are realized
All
An action is efficient only if it creates more benefit then __
Cost
How can market equilibrium be effiecient
With well-defined property rights and competition
At P^E, is total Consumer Surplus and Producer Surplus maximized?
Yes
In a market disequilibrium, a surplus (glut) makes what happen?
Q^S more than Q^D, puts a downward pressure on the price, and as prices rises, Q^D rises and Q^S falls (Law od Demand and Law of Supply)
In a market disequilibrium, a shortage makes what happen?
Q^S less then Q^D, puts an upward pressure on the price, and as price rises, Q^D falls and Q^S rises (Law of Demand and Law of Supply)
A change in quantity demanded means there was a change in, due to a change, which depicted as a movement __ the demand curve
Consumption, Price, Along