Building the IS curve - 4a
 Call Kai
 Learn
 Practice Test
 Spaced Repetition
 Match
 Flashcards
 Knowt Play
1/29

There's no tags or description
Looks like no tags are added yet.
30 Terms
What does IS stand for on the IS curve
Investment and saving
What does the IS curve show
What is going on in the market for goods and services
What does the LM curve stand for
Liquidity and Money
What does the LM curve show
Shows what is happening to the supply and demand for money
What links both the IS and LM together
What does the IS/ LM model show
The interest rate because it affects both money demand and investment
Shows the interaction between the goods market and money market and how they determine national income
Difference between how prices and income are determined in short run and long term
prices are flexible in the long run and AS determines income
While in the short run prices are sticky and AD determines income
What is actual expenditure
What is planned expenditure
Amount households, firms and governments spend - equal to GDP
Amount households, firms and government plan to spend
What is the formula for planned expenditure when the economy is closed
PE = consumption + Investment + Government spending
What is the formula which determines household consumption expenditure
C = C(Y-T)
Y - income
T - tax
Y- T = disposable income
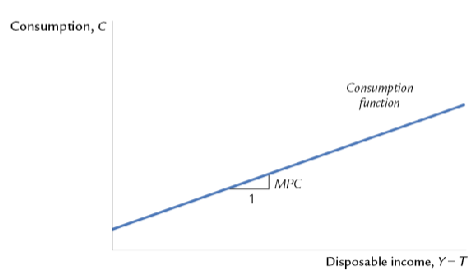
Relationship between consumption and disposable income is called the consumption function
What is MPC
What is the formula of MPC
The amount consumption changes when disposable income increases by £1
MPC = change in consumption/ change in disposable income
Draw the slope of the MPC with axis
How do both firms and households invest
Firms : Buy investment goods to add to their capital stock and replace pre existing capital that has been worn out
Households : purchase new houses
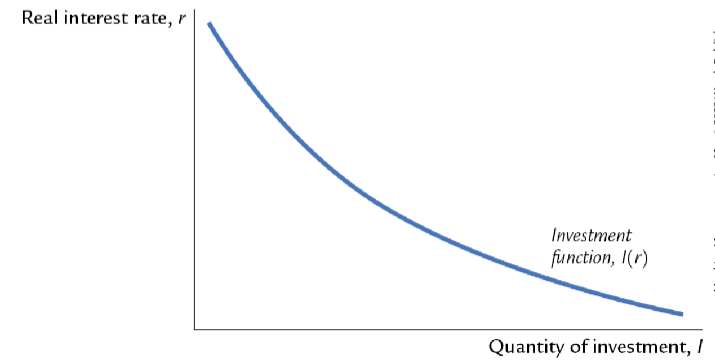
Draw the investment function showing how interest rates affect the level of investment
Give 3 examples on what the government spends money on
Welfare, Health, education and debt interest
What is an exogenous factor
A factor determined outside of the equation/ environment
How do we show a factor is exogenous
A line above the letter
In the Keynesian cross model what is the planned expenditure formula

Draw the Keynesian cross diagram
Highlight where the equilibrium is
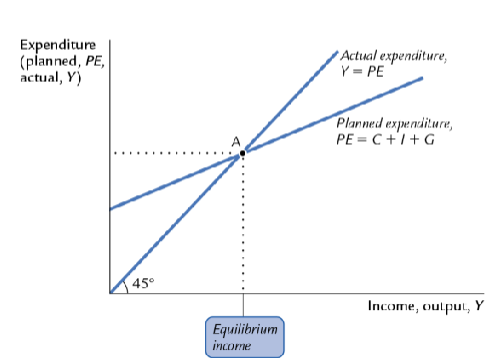
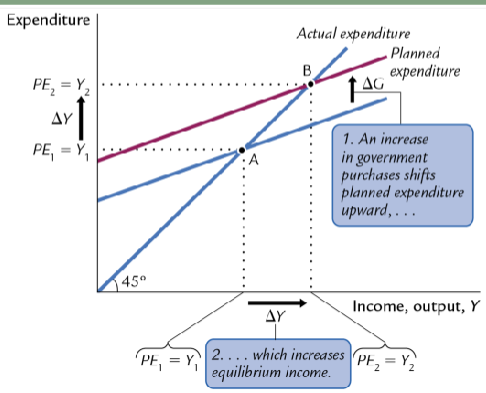
Draw the Keynesian curve after an increase in government spending labelling the increases in factors
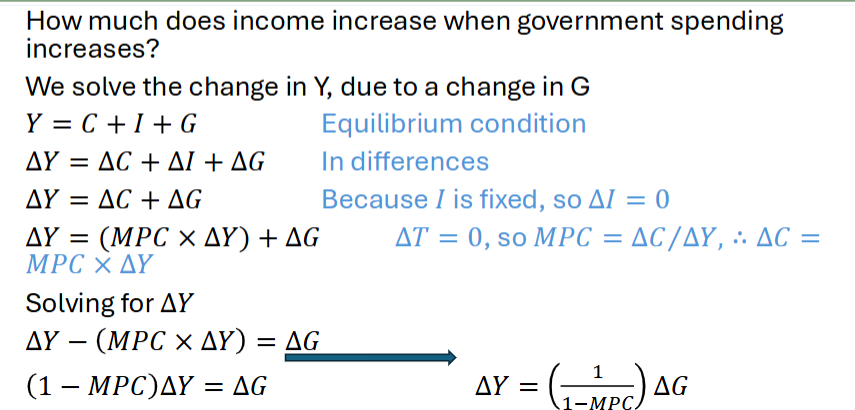
How can the government spending multiplier be derived
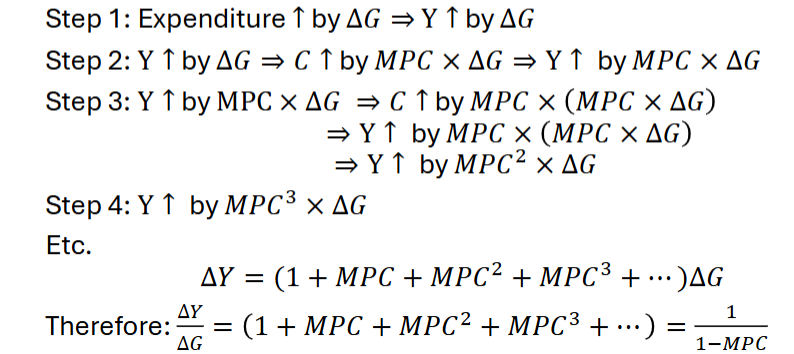
Show why the multiplier is greater than one
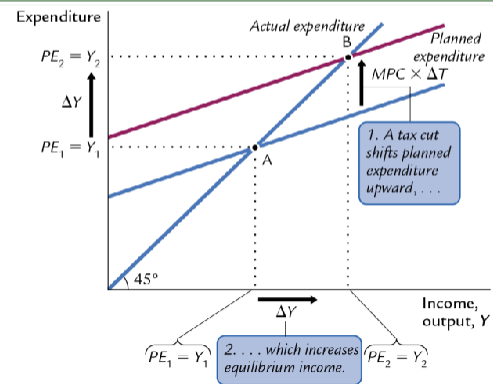
What does a decrease in taxes change in the Keynesian cross diagram - draw it
This because PE = C + I + G (no t)
Show how much income increases when taxes decrease
G is not affected by tax decrease and G = I
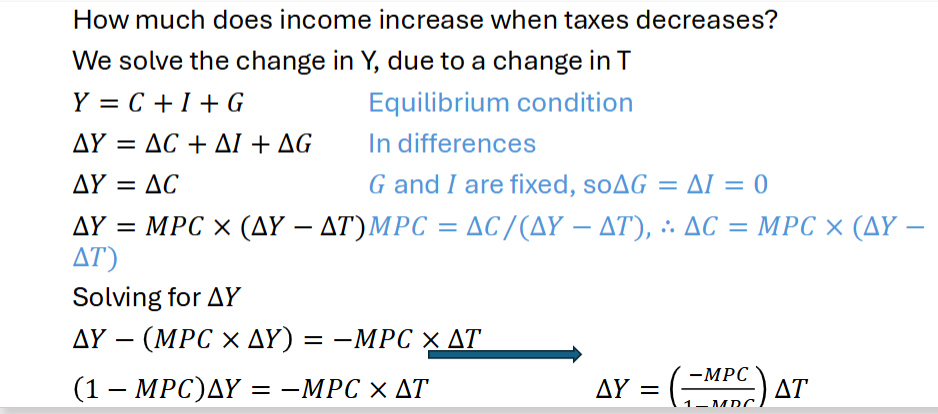
How much will the product multiply given MPC
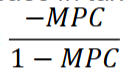
What usually has a bigger multiplier and why government spending or tax changes
Tax cut affects only disposable income some is consumed and the rest is saved while government spending can boost consumption and investment (through increased confidence/ subsidies)
Does tax cut work give both keynesian and supply side view
Keynesian believe it increases disposable income thus increasing AD
The supply side view is that disposable income is increased and workers supply more labour, expanding AS
What was the fiscal policy used in 2024
Tax revenue increased by £40 billion - increased capital gains tax, increased employers NI contributions, VAT on private schools
Government spending increased by £64 billion - increased budget for the NHS, spending on education, increased national wage
Why would we combine the investment curve and the keynesian cross
What does the formula look like for the IS curve
To get the IS curve as keynesian cross just assumes investment is fixed however of course it is dependent on the IS curve

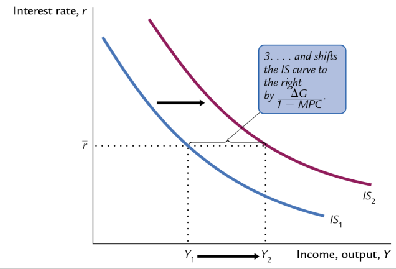
Draw the IS curve
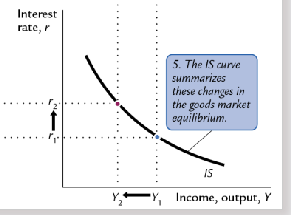
Show and explain the effect of government spending increasing on the IS curve
interest rate does not change so the IS curve shifts to the right to show that income has increased