Lab 3 Spectrophotometry
 Call Kai
 Learn
 Practice Test
 Spaced Repetition
 Match
 Flashcards
 Knowt Play
1/33

Earn XP
Description and Tags
Lab 3
34 Terms

What is Spectrophotometry?
Spectrophotometry is a technique used to measure how much light a chemical substance absorbs, to help us determine the concentration of a substance in a solution. The amount of light absorbed is directly related to the concentration of the substance in the solution. The more concentrated the solution, the more light it absorbs.
Why is this important in physiology and medicine?
Spectrophotometry is used to measure:
• Blood glucose levels in diabetic patients
• Protein concentrations in urine and blood
• Hemoglobin levels (to diagnose anemia)
• Enzyme activity in liver function tests
• Drug concentrations in pharmaceutical research
• Bacterial growth in microbiology
Beer's Law (Beer-Lambert Law)
Beer's law states that the concentration of the solute in a solution is directly proportional to the amount of light absorbed by the solution.
A = ε × b × c
• A = Absorbance (no units) - how much light is absorbed
• ε = Molar absorptivity (a constant for each substance)
• b = Path length (width of cuvette, usually 1 cm)
• c = Concentration of the solution
Since ε and b are constant, we can say: Absorbance is directly proportional to concentration.
This means if we plot absorbance vs. concentration, we get a straight line (linear relationship). We can use this line to find the
concentration of an unknown sample!
Cunknown = Aunkown x Cstd/Astd
According to Beer's Law, if the concentration of a solution doubles, the absorbance value should also double.
However, experimental error makes this unlikely. Therefore, it is necessary to average the answers obtained from the standards to find the unknown concentration.
C(unknown) = (42 + 46.1 + 51.2 + 43) / 4 = 45.6 mg/100mL
Another way is to use a standard curve.
Key Concepts of Spectrophotometry:
• Transmittance (T) - the fraction of light that passes through the sample (0-100%)
• Absorbance (A) - a measure of light is absorbed (0 to ∞, but typically 0-2)
• Blank - a cuvette containing only solvent (distilled water) used to calibrate the spectrophotometer to zero
The relationship: A = -log(T)
Step-by-Step Preparation:
Label 7 clean, dry test tubes: Blank, 20%, 40%, 60%, 80%, 100%, and Unknown
Add 1 mL of your sample/standard (from each pre-made standard tube) + 4 mL of Biuret reagent = 5 mL total reaction volume per tube
Mixing:
◦ Cap or cover with parafilm and invert 5–6 times to mix thoroughly
◦ DO NOT SHAKE VIGOROUSLY (creates bubbles)
After 10–15 minutes, transfer the solutions to seven cuvettes, labeled to match: Blank, 20%, 40%, 60%, 80%, 100%, and Unknown.
Make sure to transfer all the solution from each test tube into its corresponding cuvette. Fill each cuvette to about ¾ full (roughly 2–2.5 mL).Verify:
◦ Line up your cuvettes in order
◦ You should see a gradual increase in color intensity from clear (Blank) to darkest (100%)
Spectrophotometer Calibration And Measurement
A. Preparing and Calibrating the Spectrophotometer
1. Make sure the machine is on Transmittance mode using the Mode button
2. With no cuvette in the sample compartment and the cover closed, turn the 0% Transmission knob until the display reads
0.000
3. Turn the 100% Transmission knob counter-clockwise completely. (This resets the knob to a known starting position
before the blank is inserted — it is not the final calibration step.)
4. Set wavelength to 550 nm (this is optimal for Biuret)
5. Start with your BLANK cuvette (0%, distilled water only)
6. Handling cuvettes properly:
◦ Wipe the clear sides with a Kimwipe to remove fingerprints and water droplets
◦ Make sure there are no bubbles inside
7. nsert the cuvette into the sample holder
◦ Align the cuvette with the mark on the instrument
◦ Turn the 100% Transmittance knob until the transmittance reads 100% — this is the step that actually calibrates the
machine against your blank
"Machine is Calibrated now"
B. Measuring Absorbance of Standards
1. Remove the blank cuvette
2. For each standard solution (20%, 40%, 60%, 80%, 100%):
◦ Wipe the outside with Kimwipe
◦ Close lid and wait for reading to stabilize (3–5 seconds)
◦ Record absorbance value (not transmittance value) in Data Table 1
◦ Remove cuvette
3. Repeat each measurement twice for accuracy (take the average)
PART 3: MEASURING THE UNKNOWN SAMPLE
PART 3: MEASURING THE UNKNOWN SAMPLE
1. 2. 3. 4. Use the Unknown cuvette you prepared in Part 1 (1 mL unknown sample + 4 mL Biuret reagent, already reacted). Do not
prepare a new, unreacted unknown cuvette.
Wipe the outside of the cuvette with a Kimwipe and make sure it is filled to about ¾ full (roughly 2–2.5 mL)
Measure absorbance following the same procedure as the standards
Record THREE readings and calculate the average (the unknown is read three times, rather than two, for extra accuracy
since only one unknown value is used to determine the final result)
PART 4: Creating a Standard Curve
You will create a graph of Absorbance vs. Concentration.
Manual Graphing (using graph paper):
1. 2. 3. 4. 5. 6. X-axis (horizontal): Concentration (%) - scale from 0 to 100%
Y-axis (vertical): Absorbance - scale from 0.000 to the highest absorbance value you measured
Plot your 6 data points from Data Table 1 (use average absorbance values)
Draw the best-fit line through your points using a ruler
◦ The line should pass through or near all points
◦ The line should go through the origin (0,0) or very close to it
Title your graph: "Standard Curve: Albumin Concentration vs. Absorbance"
Label both axes with units
Computer Graphing (Excel):
1. 2. 3. 4. 5. Enter your data in two columns: Concentration and Average Absorbance
Create a scatter plot (X-Y scatter)
Add a trendline (linear regression)
Display the equation on the graph (y = mx + b)
Display R² value (should be close to 1.000 for good data)
Upload your completed graph to this lab report
PART 5: Determining Unknown Concentration
Method 1: Graphical Method
1. 2. 3. 4. 5. Locate your unknown's average absorbance on the Y-axis
Draw a horizontal line from that point until it intersects your best-fit line
From the intersection point, draw a vertical line down to the X-axis
Read the concentration value where the vertical line meets the X-axis
This is your unknown concentration!
Method 2: Mathematical Method (if you used Excel)
The equation will look like:
y = mx + b
Where:
• y = Absorbance (your unknown's absorbance)
• m = slope
• x = Concentration (what you're solving for)
• b = y-intercept
Solve for x (concentration): Unknown concentration = 55.6%
y = 0.00563x − 0.0422 (R² = 0.982)
x = (y − b) / m = (0.271 + 0.0422) / 0.00563 = 55.6%
Unknown concentration = 55.6%
According to Beer's Law, what is the relationship between absorbance and concentration?
Absorbance is directly proportional to concentration (A = ε × b × c). Since ε and the path length are constant, doubling the concentration doubles the absorbance, which gives a straight line through the origin.
Look at your data table. As concentration increased from 20% to 100%, what happened to absorbance values?
Absorbance increased steadily as concentration increased, from 0.039 at 20% to 0.540 at 100%, following a roughly linear pattern.
Why did we use distilled water (blank) to calibrate the spectrophotometer to zero?
The blank contains everything except the albumin (the distilled water, the Biuret reagent, and the cuvette). Setting it to 100% transmittance subtracts their background absorbance, so the readings afterward measure only the light absorbed by the protein.
What wavelength did we use for this experiment (550 nm)? Why do we need to select a specific wavelength?
We used 550 nm. Biuret reagent forms a violet complex with protein that absorbs most strongly around 540–550 nm.
Measuring at the wavelength of maximum absorbance makes the readings most sensitive to changes in concentration and reduces interference from other substances.
Look at your standard curve graph. Is the relationship between concentration and absorbance linear (a straight line)?
Yes, it is approximately linear. The R² value of 0.982 is close to 1. The points do not fall exactly on the line (the 20% and 40% standards read slightly low), which is likely due to small pipetting errors, fingerprints on the cuvettes, or instrument variation.
If a solution has ZERO absorbance, what is its concentration? Why?
Its concentration is 0%. Because absorbance is directly proportional to concentration, an absorbance of zero means there is no albumin present, the same as the blank.
According to your standard curve, what would be the approximate absorbance of a 50% Albumin solution? Show how you determined this:
About 0.24. Using the trendline: y = 0.00563(50) − 0.0422 = 0.239. On the graph, I went up from 50% on the x-axis to the best-fit line and read across to the y-axis. This makes sense because 50% falls between the 40% (0.153) and 60% (0.300) standards.
Part C: Unknown Sample
What was the absorbance of your unknown sample? Average absorbance = 0.271
What concentration did you calculate for your unknown? Unknown concentration = 55.6%
If your unknown's absorbance was HIGHER than your highest standard (100%), could you still determine its concentration? What would you need to do?
Not accurately, because the value would be outside the range of the standard curve, and Beer’s Law may not stay linear at high concentrations. I would need to dilute the unknown so it falls within the curve and then multiply the result by the dilution factor to get the original concentration.
Top 10 priorities (study in this order)
Beer’s law
A = ε × b × c; absorbance is directly proportional to concentration → straight line
Absorbance vs transmittance
A = −log(T); 100% T = 0 A
Solving for the unknown
x = (y − b) ÷ m · the simplified formula + averaging
Calibration steps + knobs
0% T knob (no cuvette) → 550 nm → blank → 100% T knob
The blank
Everything except the protein; sets 100% T / 0 absorbance
550 nm and Biuret
Violet protein complex absorbs most at ≈ 540–550 nm
(Part 1) Spectrophotometry and Beer’s Law
Spectrophotometry measures how much light a substance absorbs, which tells you its concentration.
Light passes through a colored solution
Some wavelengths are absorbed, the rest pass through.
The more concentrated the solution, the more light it absorbs.
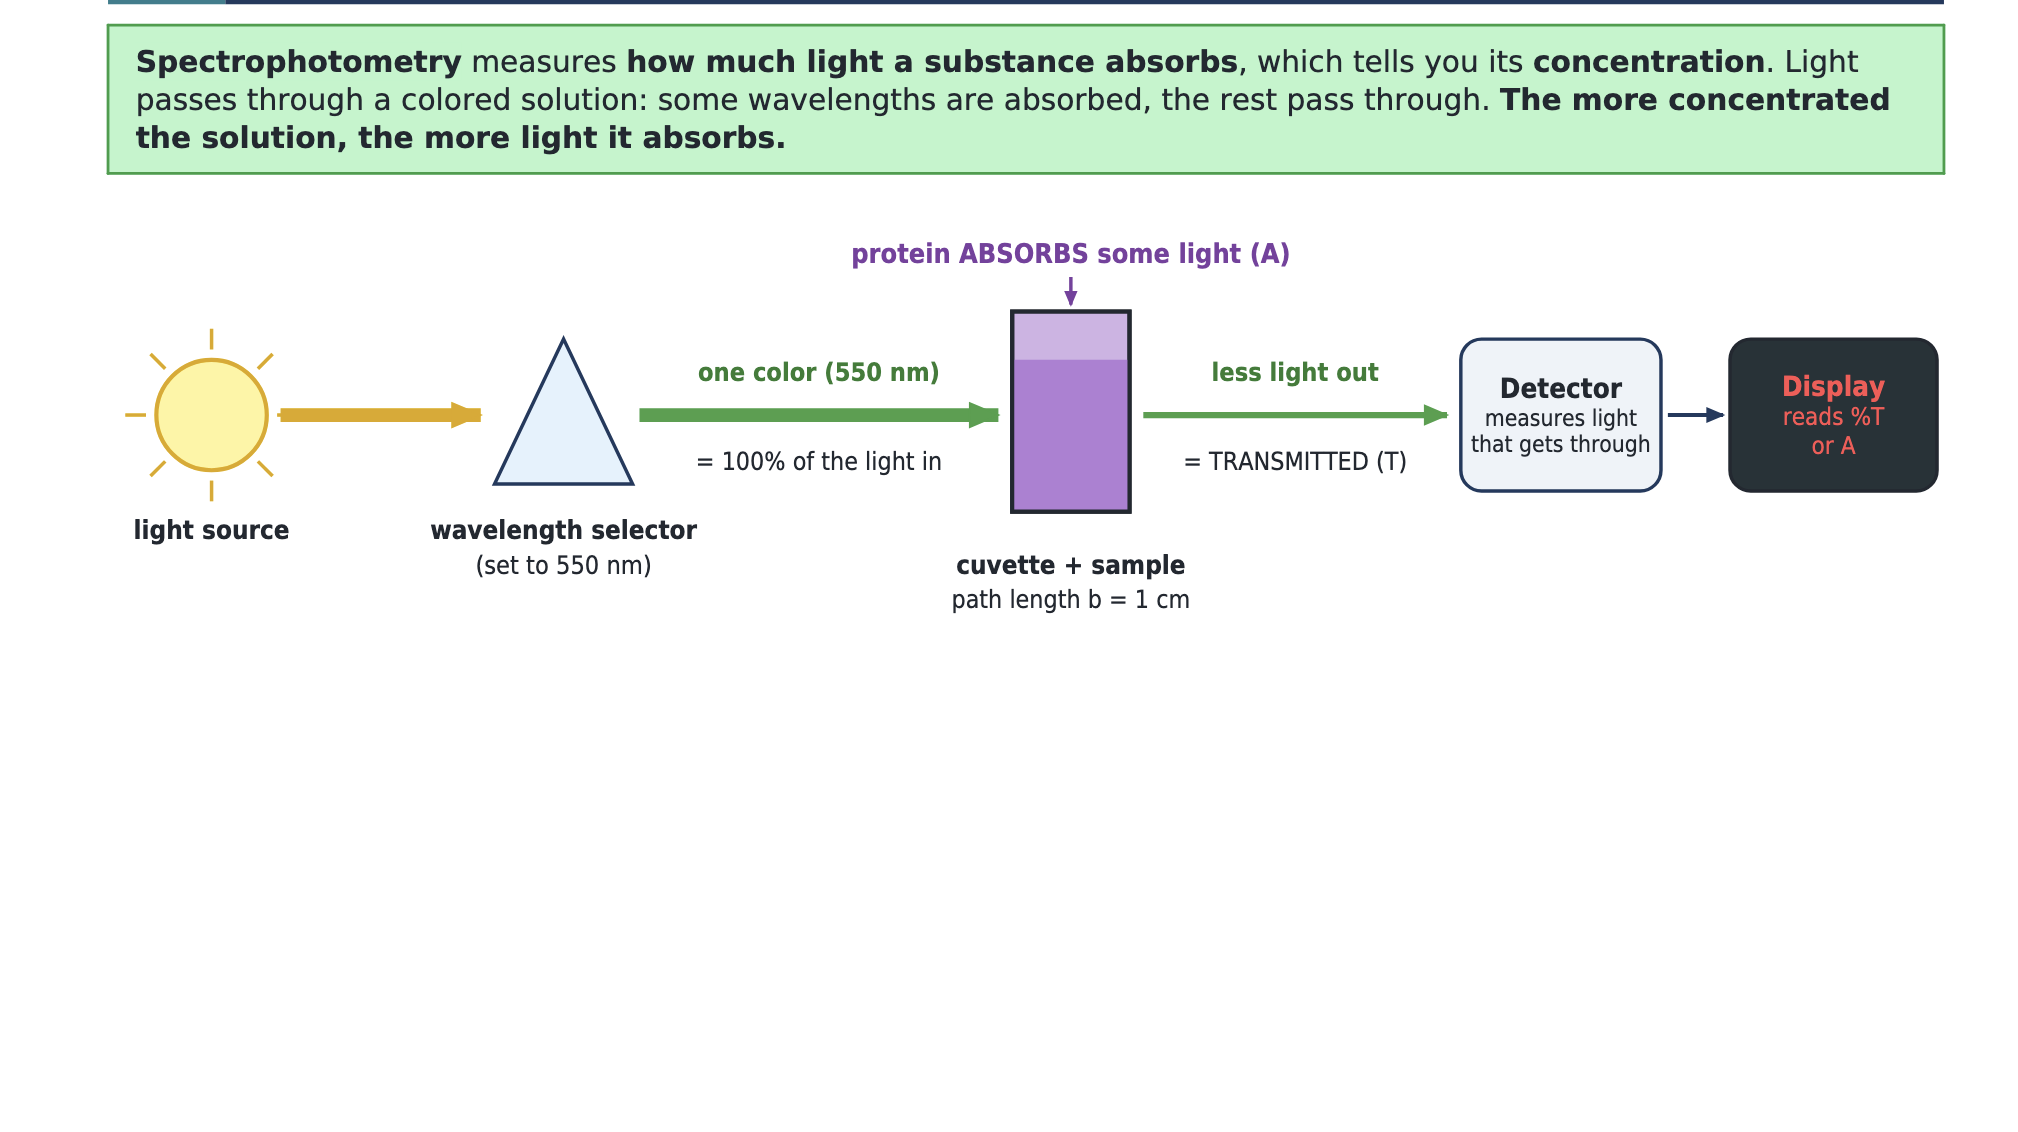
Beer’s law (Beer–Lambert law)
A = ε × b × c
A = Absorbance (no units)
ε = molar absorptivity (constant for the substance)
b = path length (cuvette width, 1 cm)
c = CONCENTRATION
According to Beer’s law, what is the relationship between absorbance and concentration?
Absorbance is directly proportional to concentration (A = ε × b × c). ε and b are constant, so doubling the concentration doubles the absorbance, which gives a straight line through the origin
A solution transmits 10% of the light. What is its absorbance? What if T = 100%?
T = 10% → A = 1. T = 100% → A = 0 (nothing absorbed, like the blank).
Name a medical use of spectrophotometry
Blood glucose (diabetes)
Protein in urine or blood
Hemoglobin (anemia)
Liver enzymes
Drug levels
Bacterial growth
What wavelength was used, and why select a specific wavelength?
550 nm.
The violet Biuret–protein complex absorbs most strongly there.
Measuring at the peak makes readings most sensitive to concentration and reduces interference from other substances.
How much sample and Biuret reagent go into each tube?
1 mL sample/standard + 4 mL Biuret = 5 mL total
Invert 5–6 times, wait 10–15 minutes
Which knob do you adjust with NO cuvette in the machine? Which knob with the blank?
No cuvette → 0% T knob (display 0).
Blank inserted → 100% T knob until 100% T.
The 100% T step with the blank is what actually calibrates the machine.
Why do we use a blank?
The blank has everything except the albumin (distilled water + Biuret, in the same kind of cuvette).
Setting it to 100% T / 0 A cancels their background absorbance, so later readings measure only the protein.
If a solution has zero absorbance, what is its concentration?
0%. No absorbance means no albumin, the same as the blank.
What does an R² of 0.982 tell you?
The points fit a straight line very well (1.000 = perfect). The relationship is linear, as Beer’s law predicts.
If your unknown’s absorbance is HIGHER than your highest standard, can you still find its concentration?
Not accurately.
It’s outside the standard curve, and Beer’s law may not stay linear.
Dilute the unknown, re-measure, and multiply by the dilution factor. Example: a 1:2 dilution reads 40% → original = 80%.
Why use a blank?
It holds everything except the protein. Setting it to 100% T / 0 A subtracts background, so only the protein is measured.
Wavelength and why?
550 nm, the absorbance peak of the violet Biuret–protein complex → most sensitive, least interference.
Self-Test (exam format: MC · True/False · Fill-in)
Part A · Multiple choice (1–15)
1. Spectrophotometry measures:
a) how much light a substance absorbs
b) the mass of a solution
c) the pH of a solution
d) the temperature of a sample
2. According to Beer’s law, absorbance is ______ to concentration.
a) inversely proportional
b) unrelated
c) directly proportional
d) exponentially related
3. In A = ε × b × c, “b” stands for:
a) Biuret reagent
b) path length (width of the cuvette)
c) the blank
d) absorbance
4. The blank is used to:
a) provide the highest standard
b) measure the unknown
c) warm up the machine
d) calibrate so only the protein’s absorbance is measured
5. The wavelength used with Biuret reagent in this lab is:
a) 340 nm
b) 450 nm
c) 550 nm
d) 700 nm
6. With NO cuvette in the machine and the lid closed, you adjust the:
a) 100% T knob
b) 0% T knob
c) wavelength knob
d) print button
7. The step that actually calibrates the machine against the blank is:
a) turning the 100% T knob until it reads 100% T with the blank inserted
b) turning the 0% T knob with the blank inserted
c) setting the wavelength
d) pressing Print
8. If transmittance is 100%, absorbance is:
a) 1
b) 2
c) 100
d) 0
9. As concentration increases:
a) A decreases and T increases
b) A and T both increase
c) A increases and T decreases
d) A and T stay the same
10. Why shouldn’t you shake the tubes vigorously?
a) it cools the solution
b) it creates bubbles that scatter light
c) it destroys the albumin
d) it changes the wavelength
11. An R² value close to 1 means:
a) the unknown is 100%
b) there is no protein
c) the machine is off
d) the points fit a straight line well
R² measures how well the points fit the line; 1.000 = perfect.
12. y = 0.00563x − 0.0422 and the unknown’s A = 0.271. The concentration is:
a) 55.6%
x = (0.271 + 0.0422) ÷ 0.00563 = 55.6.
b) 48.1%
c) 1.5%
d) 0.27%
13. The unknown’s absorbance is higher than the highest standard. You should:
a) extend the line and guess
b) report it as 100%
c) dilute, re-measure, and multiply by the dilution factor
Outside the curve = not reliable; bring it into range, then correct with the dilution factor.
d) add more Biuret reagent
14. Which is NOT a medical use of spectrophotometry listed in your manual?
a) blood glucose
b) hemoglobin (anemia)
c) protein in urine
d) measuring bone length
15. Each cuvette should be filled about:
a) ¼ full
b) ¾ full (≈ 2–2.5 mL)
¾ full ≈ 2–2.5 mL, so the light beam passes through the liquid.
c) completely full
d) with exactly 5 mL
16. T / F Absorbance has no units.
17. T / F The more concentrated a solution is, the less light it absorbs.
18. T / F Fingerprints on the clear sides of a cuvette can make the absorbance read too high.
19. T / F You record transmittance values in Data Table 1.
20. T / F The unknown is read three times, while each standard is read twice.
21. T / F 550 nm is used because the violet Biuret–protein complex absorbs most strongly there.
22. T / F A good standard curve passes through, or very near, the origin (0, 0).
23. T / F The spectrophotometer should warm up for about 15 minutes.
24. T / F After adding Biuret reagent, you should read the cuvettes immediately.
25. T / F On a standard curve, absorbance goes on the x-axis.
26. A = ε × b × ______
27. A = −log(______)
28. Each tube gets 1 mL sample + ______ mL Biuret
29. Total reaction volume per tube = ______ mL
30. Invert the capped tubes ______ times
31. Wait ______ minutes for the color to develop 32. Number of test tubes / cuvettes = ______
33. T = 10% → A = ______
34. T = 1% → A = ______
35. A(unk) 0.35, standard 30 mg/100 mL with A 0.25 → C(unk) = ______ mg/100 mL 36. Average of 42, 46.1, 51.2, and 43 = ______
37. Using y = 0.00563x − 0.0422, A at 50% ≈ ______
38. (new numbers) y = 0.005x + 0, unknown A = 0.20 → x = ______ %
39. For good data, R² should be close to ______
40. The cuvette with water + Biuret but no protein is the ______