ECON 101 Exam 3 - Aggregate Expenditures
 Call Kai
 Learn
 Practice Test
 Spaced Repetition
 Match
 Flashcards
 Knowt Play
1/109

There's no tags or description
Looks like no tags are added yet.
110 Terms
Equilibrium is Consumption/Expenditures =
Output, Real GDP, & Income
Aggregate Expenditures
The sum of all expenditures spent on C, I, G, and NX in an economy. In equilibrium AE = …
Aggregate Expenditures Model
A model developed by John Maynard Keynes, relating income to expenditures.
Traditional/classical models of labor markets implied that…
if unemployment was high, there would be a surplus of labor, making wages fall and firms more willing to hire the unemployed.
What 2 factors drive demand for labor according to Keynes?
What was the solution to the Great Depression?
Y = means…
Income or Output
In an economy where all spending is done by households and individuals…
Savings = Zero at equilibrium.
3 Ways to Measure the Size of an Economy:
Measure everyone’s income
Measure the total value of final goods and services produced
Measure how much is spent on those goods and services
Disposable Income (DI)
The amount of income available after taxes have been paid. Y - T = DI
Taxes
Revenue collected by the government from individuals and firms
Real GDP
A measure of the constant dollar value of all final goods and services produced in a country during a fixed period of time. Inflation-adjusted GDP.
Consumption
All expenditures made by households on goods and services like clothing, food, electronics, and recreation, during a given time period.
Marginal Propensity to Consume
The fraction of each additional dollar of income spent on consumption. Equation: DeltaC / DeltaY
Marginal Propensity to Save
The fraction of each additional dollar that is saved. Equation: DeltaS / DeltaY.
The Consumption/Saving Identity
MPC + MPS = 1 Dollar.
Consumption Schedule
A graph showing the relationship between income and consumption. Equation: DeltaC / DeltaDI BUT DeltaC / DeltaY WITHOUT TAXES which = MPC.
What is the first basic piece in the AE Model
Consumption Schedule!
A change in DI in the Aggregate Expenditures Model…
does NOT change the shape of the Consumption Schedule. DOES change the intercept of the consumption schedule.
Equilibrium Line
In the aggregate expenditures model, the 45-degree line through the origin that represents all points at which Aggregate Expenditures = Real GDP or Output. (Y=C)
Autonomous Consumption (A)
The level of consumption expenditures when income = zero. A is funded by drawing on savings or borrowing.
Lump-Sum Taxes
What we assume taxes are in the AE model, meaning that the taxes paid are some fixed amount that does not change with income.
How do you find equilibrium on a Consumption Schedule?
Where the Consumption Schedule C, intersects with the C = DI line.
What lies on the Axises of a Consumption Schedule?
Y-Axis: Consumption X-Axis: Disposable Income
What changes when adding taxes to the consumption schedule?
Only the vertical axis changes.
When Income increases…
Consumption and Savings increases.
Savings Schedule
A graph showing the relationship between savings and income.
What lies on the axises of a Savings Schedule?
Y-Axis: Savings X-Axis: Disposable Income
What is the slope of a Consumption Schedule and Savings Schedule
Up/Positive
What does the horizontal line represent on the Savings Schedule?
Where savings = 0.
Savings Equation:
Disposable Income - Consumption = Savings
Investment Demand
The relationship between the quantity of new physical capital and the prevailing interest rate.
What is the slope and relationship of an Investment Demand Curve?
Negative/Down. Inverse Relationship
Expected Rate of Return
Additional profit the firm expects to earn for each dollar of physical capital purchased, expressed as a percentage.
Interest Rate
The payment made to agents that lend or save money expressed as a percentage of the monetary amount lent or saved. AKA nominal interest rate.
Real Interest Rate
The interest rate paid to lenders and savers when the expected rate of inflation equals zero. The inflation-adjusted return. Nominal Interest Rate - Inflation Rate.
Capital Goods
Durable (long-lasting) goods that are used to produce other goods and services.
Marginal Decision Making
The process of making choices in increments by evaluating the additional/marginal benefit against the additional/marginal cost of an action.
Optimization
The idea that people make choices in order to maximize the overall benefit, or utility, of an action subject to its cost.
People will engage in an activity as long as…
the marginal benefit of an activity is greater than or equal to its marginal cost.
Marginal Benefit
The additional benefit associated with one more unit of an activity.
Marginal Cost
The additional cost associated with one more unit of an activity.
Decreasing Marginal Benefit
The negative relationship between the marginal benefit associated with the use of a good or service that is consumed, in a given period of time. The lower the marginal benefit associated with each additional unit.
Increasing Marginal Benefit
The positive relationship between the marginal cost associated with the use of a good or service that is produced. The more of a good or service that is produced, in a given period of time, the higher the marginal benefit associated with each additional unit.
Optimization Rule for an Activity
If MB is greater than or equal to MC, do it.
If MB is less than MC, don’t do it!!!
Optimization Rule for Investment
If Expected Rate of Return is greater than or equal to Cost of Investment, invest.
If Expected Rate of Return is less than the Cost of Investment, do not invest.
What is the opportunity cost for purchasing physical capital?
INTEREST RATE
Saving in context:
When households or firms take some of their income and put it in a savings account, in the stock market, or in some other asset, hoping to make a return on their money and spend it in the future. Money in bank, stock, or bond.
Investment in context:
When a firm or individual purchases new capital for replacement or not, like machinery or a new home.
Transfer of ownership is NOT…
(NOT)…Investment.
2 Variables that determine when it makes sense for a firm to buy new capital goods:
Expected Rate of Return
Opportunity Cost: The real interest rate.
Opportunity Cost in Investment:
Return that the firm forgoes if it uses its own funds OR the cost that the firm pays if it borrows money.
As interest rates fall…
Quantity of investment demanded increases.
Countries that save more…
Often invest more.
True or False: A small change in interest rates could have an enormous impact on employment, output, and future economic growth.
True!
Investment Schedule
A horizontal line showing the relationship between Gross Investment (I) and the level of Real GDP (Y) in the economy.
Government Purchases Schedule
A horizontal line showing the relationship between Government Purchases (G) and the level of Real GDP (Y) in the ecoonomy.
Net Exports Schedule
A horizontal line showing the relationship between Net Exports (NX) and the level of Real GDP (Y) in the economy.
Why is the Investment, Government Purchases, and Net Exports schedule represented by a horizontal line?
Because the aggregate expenditures model assumes that these expenditures are autonomous spending. They do not depend on income.
Interest Rate is represented by…
Lowercase i
Gross Investment is represented by…
Uppercase I.
What 2 Variables is Gross Investment determined by:
Expected Rate of Return
Interest Rate
Aggregate Expenditures Model
Shows the relationship between overall expenditures and real GDP. Consists of all 4 types of expenditures.
What lies on the axises of the Aggregate Expenditures Model:
Y-Axis: Aggregate Expenditures
X-Axis: Real GDP
What 2 Parts is the Aggregate Expenditures Model made of?
The 45-degree Line (AE=Y).
The Aggregate Expenditures Schedule. (AE = C+I+G+NX).
In the Aggregate Expenditure model, if any part of AE (G,I, or NX) increases…
the AE curve will shift up, resulting in higher equilibrium real GDP in the economy.
Consumption Function/Equation:
C = A + MPC(DI)
Influences of Consumption
GDP
Wealth
Expectations
Price Level
Macroeconomic Equilibrium:
When AE = Y. Purchases = Production.
What does adding I, G, or NX to an AE Model do to expenditures?
It increases expenditures/AE schedule shifts up by uppercase I. AE schedule shifts vertically.
What does adding Government Purhcases to an AE Model do to expenditures?
It increases expenditures/AE schedule shifts up by G1.
What does adding Net Exports to an AE Model do to expenditures?
If NX is positive, the AE schedule shifts up. If NX is negative, the AE schedule shifts down.
What does it mean when the AE=C+I+G+NX crosses the 45-degree equilibrium line AE=y?
Aggregate expenditures on goods and services are equal to output or real GDP.
Aggregate Expenditures Model Expanded Form Equation:
AE = A + [MPC x (Y-T)] + I + G + NX
Expenditures Multiplier
The effect that a $1 change in expenditure (CIGNX) has on real GDP. Calculated as the total change in real GDP over the change in initial expenditure OR 1 divided by MPS.
Multiplier Effect
The concept that an additional dollar of expenditures will result in the creation of more than one dollar’s worth of real GDP. An increase in expenditures will result in an even larger change in real GDP.
Tax Multiplier
The effect that a $1 change in taxes has on real GDP; in the aggregate expenditures model, calculated as the change in output divided by the initial change in taxes. OR -MPC/1-MPC
Tax Multiplier Effect
An increase in taxes will result in an even larger change in GDP. Tells us how much GDP is reduced.
Aggregate Expenditures Model - Equilibrium
Ye= [(1/1- MPC)*(A+I+G+NX)] + [(-MPC1-MPC) * T]
Expenditures and output rise…
One after the other. (Equilibrium dynamics)
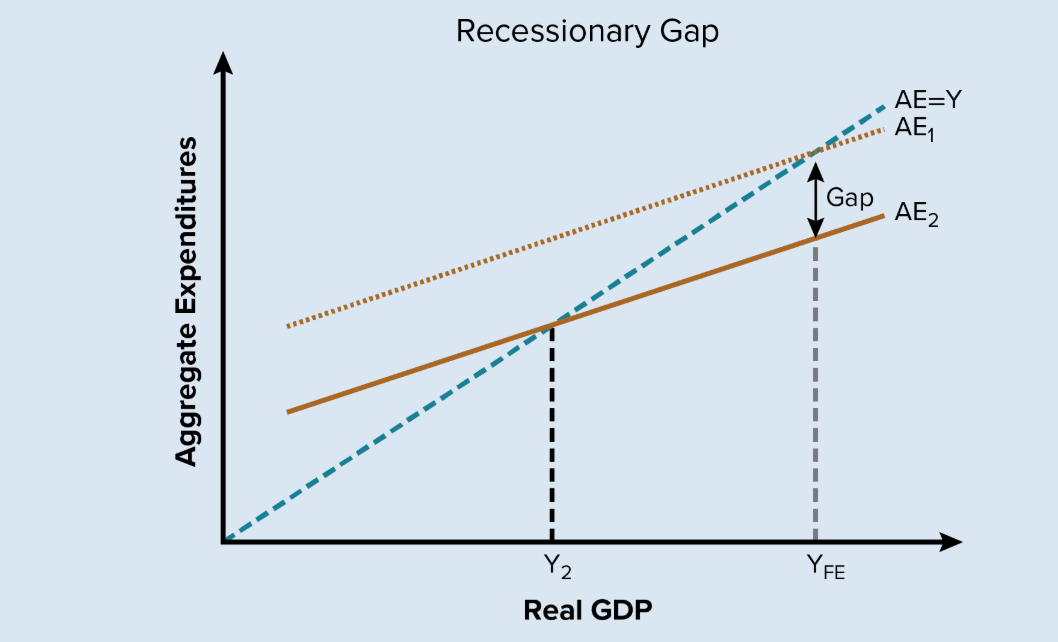
Recessionary Gap
The difference, or gap, between expenditure when real GDP (AE2) is below the full-employment level (AE=Y) and the level of expenditure at full-employment real GDP (AE1). Occurs when output and expenditures are less than the full-employment level.
Inflationary Gap
The difference, or gap, between expenditure when real GDP is above the full-employment level and the level of expenditure at full employment real GDP. An inflationary gap occurs when output and expenditures are greater than the full employment level.
Output Gap
The difference/gap between current real GDP and full-employment real GDP.
Full-Employment Real GDP
The level of real GDP produced in an economy when it is operating at the natural rate of unemployment. Also the level of real GDP when the economy is in a long-run equilibrium.
Recessionary and inflationary gaps are the difference between…
Current expenditures and expenditures at the full-employment level of real GDP.
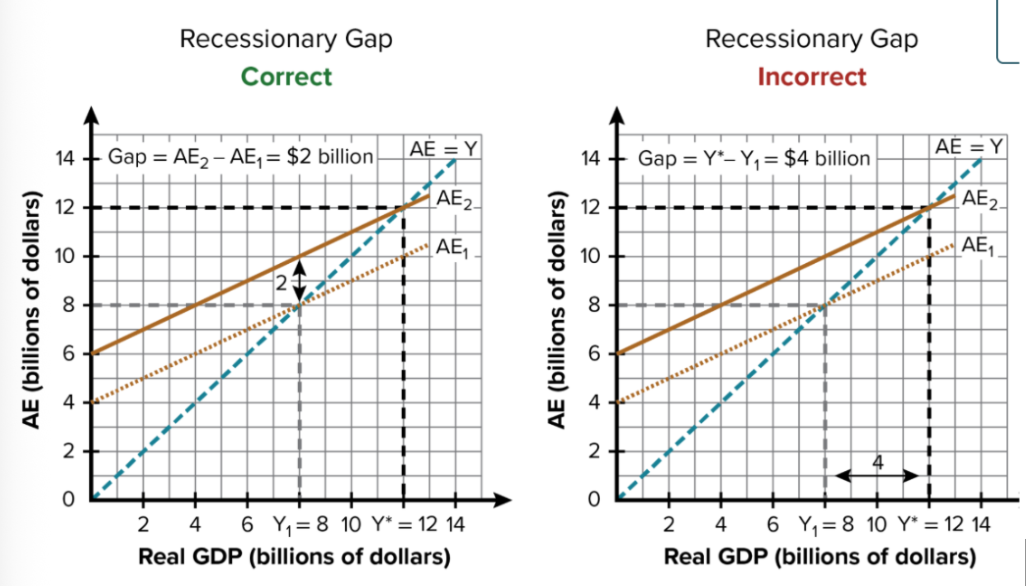
When you’re determining the size of recessionary or inflationary gap…
Find the change in expenditure that would be necessary to move the economy back to potential output. Does not find difference in output.
Business model points are the result of changes in…
…Consumption, Gross Investment, Government Purchases, or Net Exports
When graphing the investment demand, place the interest rate on the ____ axis and the investment on the ___axis.
Y; X
The aggregate expenditures model states that in equilibrium, output or real GDP (Y) will be equal to:
C+I+G+NX
Because the only category of spending that depends on income is consumption the:
Slope of the aggregate expenditures line is the same as the slope of the consumption schedule.
The aggregate expenditures model has aggregate expenditures on the ____ axis and real GDP on the ___ axis.
Y; X
Change in Real GDP (due to Expenditures or Tax Multiplier)
Change in Y = Expenditures or Tax Multiplier x Initial Change in Expenditures
Expenditures Multiplier Equations
Delta Y/ Delta Expenditures
1/1-MPC
1/MPS
Tax Multiplier Equations
Change in Real GDP / Change in Delta Taxes
Delta Y / Delta T
-MPC/1-MPC
.Negative Shock to Aggregate Demand:
A change to one of the determinants of aggregate demand that causes a decrease in the aggregate quantity of real GDP demanded at every price level. Graphically, a negative shock is represented by a leftward shift of the aggregate demand curve
Positive Shock to Demand:
A change to one of the determinants of aggregate demand that causes an increase in the aggregate quantity of real GDP demanded at every price level. Graphically, a positive shock is represented by a rightward shift of the aggregate demand curve
Negative Shock to Aggregate Supply:
A change to one of the determinants of aggregate supply that causes a decrease in the aggregate quantity of real GDP supplied at every price level. Graphically, a negative shock is represented by a leftward shift of the aggregate supply curve.
Positive Shock to Aggregate Supply:
A change to one of the determinants of aggregate supply that causes a increase in the aggregate quantity of real GDP supplied at every price level. Graphically, a positive shock is represented by a rightward shift of the aggregate supply curve.
Savings above equilibrium is:
Savings
Savings below equilibrium is:
Dissaving