[27] Images: Sea Level, Gravity & Ocean Color
 Call Kai
 Learn
 Practice Test
 Spaced Repetition
 Match
 Flashcards
 Knowt Play
1/69

There's no tags or description
Looks like no tags are added yet.
70 Terms
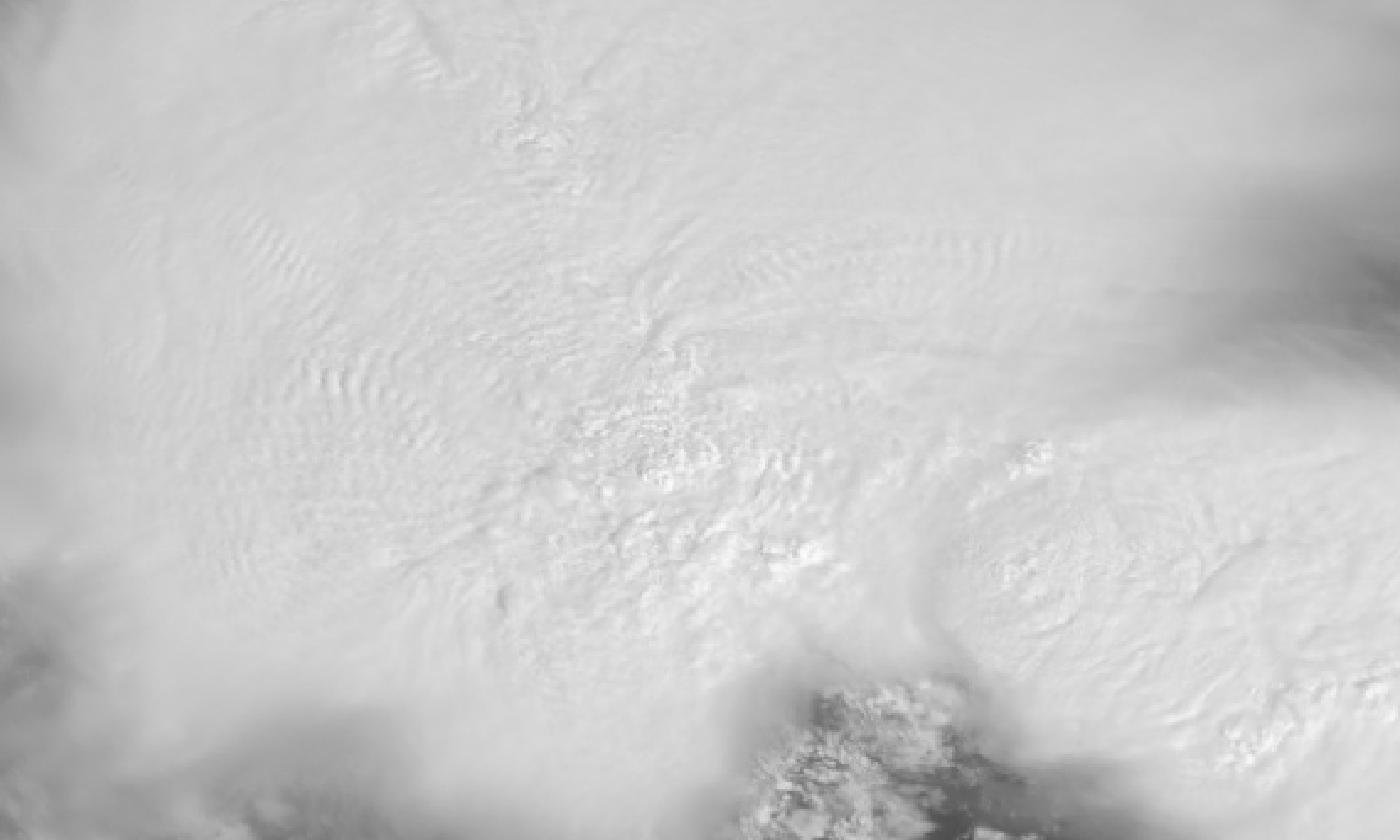
Img S001: Why is it difficult to find the strongest updraft in this late-morning visible image, and which band helps?
At high sun, the anvil is uniformly bright with few shadows. The Band 13 IR image shows the coldest overshooting tops as distinct cold spots.

Img S002: What new capability lets PACE OCI map phytoplankton communities, not just chlorophyll?
Hyperspectral measurements (continuous UV to NIR at about 5 nm resolution) resolve pigment absorption differences between phytoplankton groups.

Img S003: Why do ship tracks show smaller cloud droplets, and what is the climate effect?
Ship emissions add aerosol particles that act as cloud condensation nuclei. The same water spreads over more, smaller droplets, making the cloud more reflective (Twomey effect, aerosol indirect cooling).

Img S004: Which kind of instrument made these maps and what quantity is shown?
Satellite radar altimeters (TOPEX/Poseidon in 1997, Jason-2 in 2015). Sea surface height anomaly in mm.

Img S005: Why is sea level higher along the equator near South America during El Nino?
Weakened trade winds let warm water slosh east. Warmer water expands (thermal expansion) and the warm layer thickens, raising sea surface height.

Img S006: What ENSO phase is shown and how can you tell from an SSH anomaly map?
El Nino. High (red/white) anomaly in the central and eastern equatorial Pacific, low (purple) anomaly in the western Pacific.

Img S007: Which satellite continues the TOPEX/Jason sea level record and made this map?
Sentinel-6 Michael Freilich (Jason-CS), a joint NASA/ESA/EUMETSAT/NOAA/CNES mission launched in 2020.

Img S008: In spring 2023 this satellite saw Kelvin waves moving east along the equator. What do they signal?
Warm water moving east from the western Pacific, an early sign of a developing El Nino (2023-24).

Img S009: What ENSO phase does a blue/purple equatorial band on a Jason SSH anomaly map indicate?
La Nina: lower sea surface height because the water is cooler (contracts) and the warm layer is thinner.

Img S010: Why are altimetry SSH maps often 10-day averages?
Jason satellites repeat their ground track every 9.9 days, so about 10 days are needed for full coverage.

Img S011: On this Jason-2 map, what does the purple band along the equator mean?
Sea level lower than normal = cooler water (La Nina).

Img S012: Is a satellite altimeter measuring temperature directly?
No. It measures sea surface height. Warm water is less dense and stands higher, so SSH anomalies track heat content.

Img S013: This Jason-2 map shows neither a clear El Nino tongue nor a full La Nina band. What is happening?
ENSO transition (June 2010): El Nino ending, La Nina developing, with low sea level appearing along the equator.

Img S014: What satellites built this record and what does it measure?
TOPEX/Poseidon, Jason-1, -2, -3 and Sentinel-6 Michael Freilich radar altimeters. Global mean sea level change since 1993.

Img S015: Per this NASA graph, how much has global sea level risen since 1993 and what is the current rate?
About 9.4 cm (through 2023). Current rate about 0.42 cm (4.2 mm) per year, more than double the early-1990s rate.
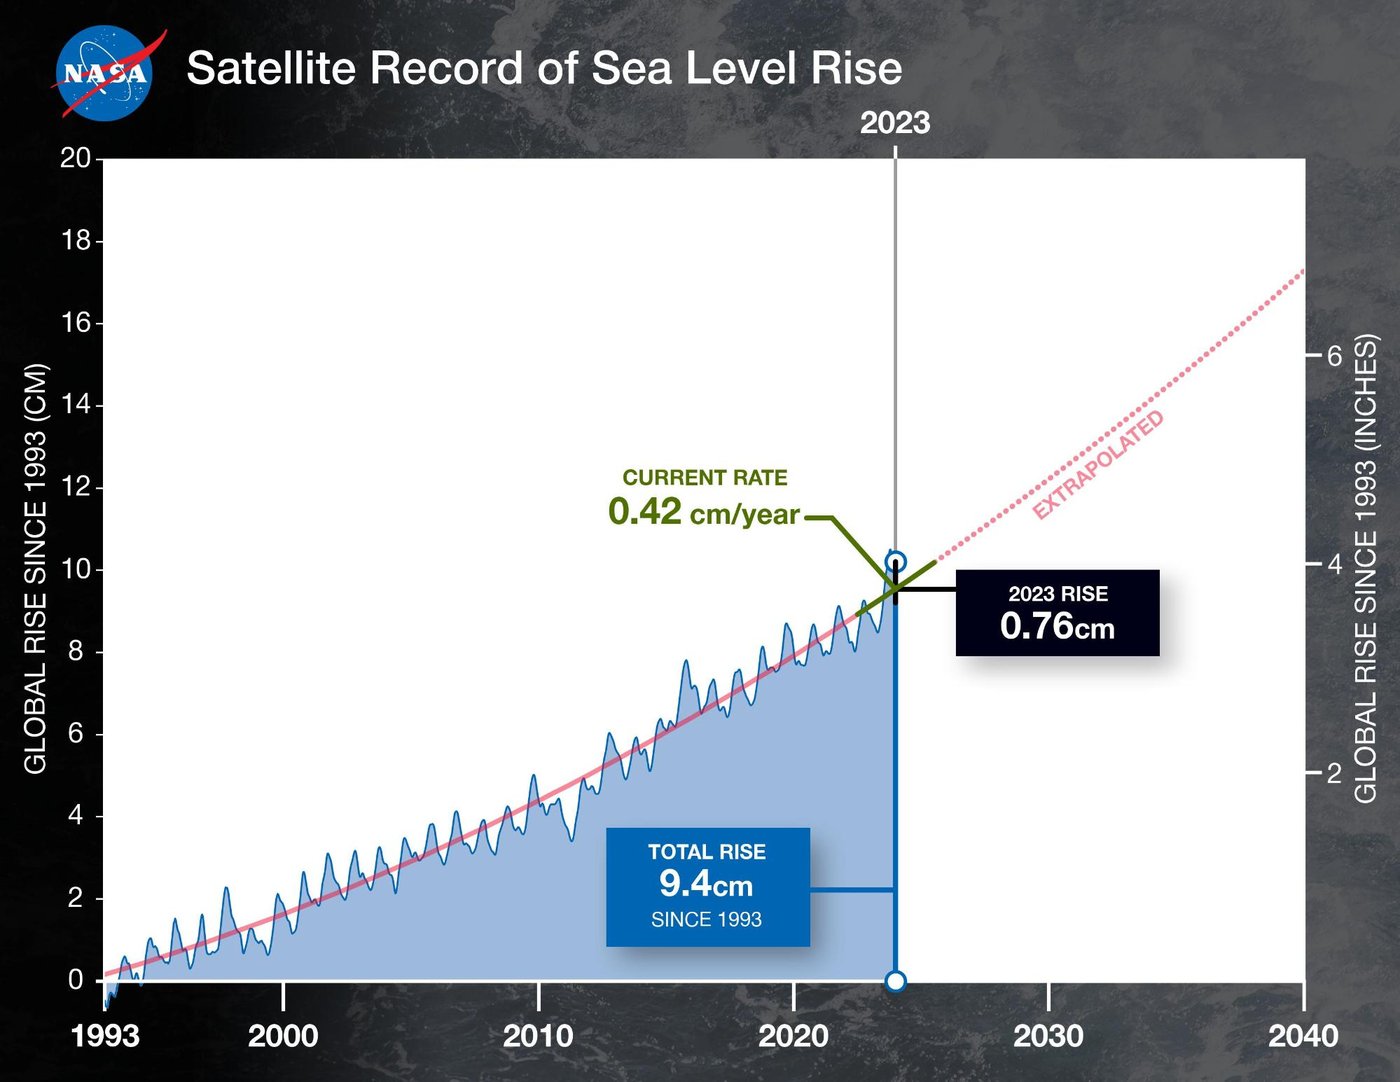
Img S016: Why did global mean sea level jump in 2023 and dip in 2010-11?
El Nino (2023) warms the ocean and keeps rain over the ocean. The strong 2010-11 La Nina moved rain onto land (e.g. Australia), temporarily lowering the ocean.

Img S017: What does each line on this NASA graph represent, and what does the stacking show?
One year of satellite-measured global mean sea level. Each year sits higher than earlier years, showing sea level rise of about 10 cm since 1993.
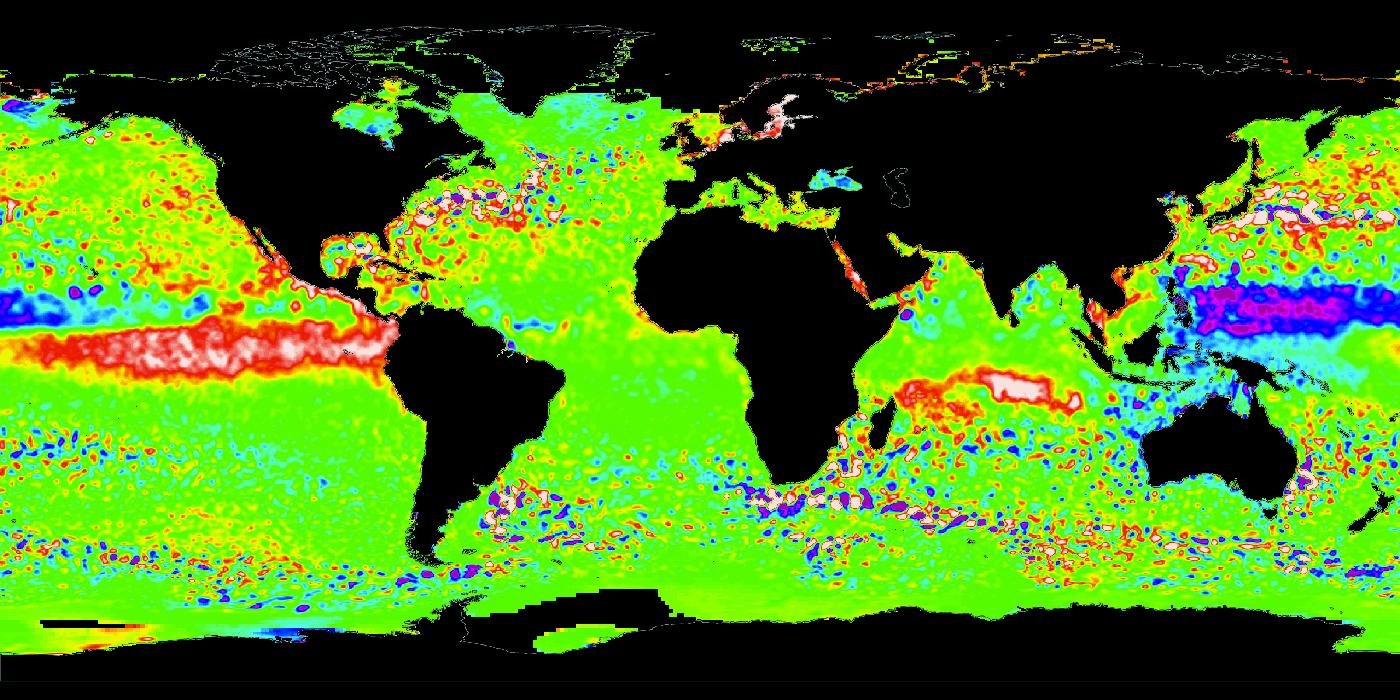
Img S018: Global map, red/white tongue in the eastern equatorial Pacific, purple in the west. What variable, instrument type, and ENSO phase?
Sea surface height anomaly from radar altimetry (TOPEX/Jason series). El Nino (Nov 2015).

Img S019: How can you tell this is a sea surface height anomaly map and not an SST anomaly map?
Check the legend units (cm or mm for SSHA vs C for SST anomaly) and the instrument (radar altimeter vs infrared/microwave radiometer). SSHA reflects heat stored in the upper ocean, so the low sea level in the western Pacific shows strongly even where the surface temperature anomaly is small.

Img S020: How does a radar altimeter measure significant wave height?
From the shape of the returning radar pulse: bigger waves stretch the leading edge of the waveform (gentler slope).

Img S021: Why do altimeter wave-height data appear as thin lines instead of a full map?
Altimeters are nadir-looking (they measure only straight down), so they sample along the ground track.

Img S022: Besides sea surface height, what two other quantities come from an altimeter return?
Significant wave height (waveform slope) and surface wind speed (backscatter strength).

Img S023: What mission produced this map and what physical quantity does it actually sense?
GRACE. It senses changes in Earth's gravity (mass), converted to equivalent water thickness. Less groundwater = less mass = weaker gravity pull.

Img S024: What caused the red (negative) anomaly in northwest India?
Groundwater pumping for irrigation exceeding recharge (about 109 km3 lost 2002-2008, Rodell et al. 2009).

Img S025: Why is the GRACE signal so blurry compared with optical images?
Gravity mapping has very coarse spatial resolution (roughly 300 to 400 km).

Img S026: What does 'terrestrial water storage' from GRACE include?
All water on and under land: snow and ice, surface water, soil moisture and groundwater (GRACE sees total mass change, not depth).

Img S027: Why is there a gap in the GRACE record around 2017-2018?
GRACE ended in October 2017 and GRACE-FO launched May 22, 2018.

Img S028: What explains the steep rise at the end (March 2023)?
The very wet 2022-23 winter (atmospheric rivers) refilled snowpack, reservoirs and soil.

Img S029: A GRACE time series of groundwater oscillates each year but trends down. Interpret.
Seasonal recharge and use (wet winters, irrigated summers) on top of long-term depletion from pumping exceeding recharge.

Img S030: Which satellite mission measures ice-sheet mass change directly, and how?
GRACE / GRACE-FO, by measuring month-to-month changes in Earth's gravity field from the changing distance between twin satellites.

Img S031: Why does this Greenland mass curve look like a staircase going down?
Each summer melt season removes mass (steep drop), winters add a little snow (flat or slight rise). Net loss each year.

Img S032: According to GRACE, which ice sheet lost mass faster in 2002-2015, and roughly how fast?
Greenland, about 287 Gt/yr vs about 134 Gt/yr for Antarctica (this NASA graph).

Img S033: Roughly how much sea level rise does 360 Gt of ice loss produce?
About 1 mm of global sea level rise.

Img S034: How does GRACE measure gravity with two satellites?
When the lead satellite passes over extra mass it is pulled ahead, increasing the gap. Then the trailing one is pulled. A microwave ranging system measures these tiny distance changes. GPS and accelerometers remove other effects.

Img S035: Name the GRACE partners and launch year.
NASA and the German Aerospace Center (DLR). Launched March 2002.

Img S036: What new instrument did GRACE-FO add compared with GRACE?
A Laser Ranging Interferometer (LRI), much more precise than the microwave ranging system, flown as a technology demonstration.

Img S037: What does GRACE-FO deliver every month?
A map of Earth's gravity field, converted to mass change (equivalent water thickness): ice sheets, groundwater, ocean mass.

Img S038: Which PACE instrument measures ocean color, and what is unique about it?
OCI, the Ocean Color Instrument: a hyperspectral spectrometer: continuous ultraviolet to near-infrared spectrum (about 340-890 nm) at 5 nm resolution, plus 7 shortwave infrared bands.

Img S039: What does high chlorophyll near the coast indicate?
More phytoplankton, usually because of nutrients from rivers, runoff or upwelling.

Img S040: What can PACE do that MODIS ocean color could not?
Identify phytoplankton community types (e.g. Prochlorococcus, Synechococcus, picoeukaryotes) because OCI is hyperspectral rather than a few multispectral bands.

Img S041: All three panels come from one PACE instrument. Which one, and why can it make all three?
OCI. It records a full hyperspectral spectrum for every pixel, so true color, chlorophyll and phytoplankton type can all be derived.

Img S042: Why are the centers of the subtropical ocean gyres purple (low chlorophyll)?
Downwelling and strong stratification keep nutrients low, so few phytoplankton grow.

Img S043: Why are there gaps in PACE OCI's swaths near the subsolar point?
OCI tilts its view (fore/aft) to look away from the Sun and avoid sun glint off the ocean.

Img S044: When did PACE launch and what does the acronym stand for?
February 8, 2024. Plankton, Aerosol, Cloud, ocean Ecosystem.

Img S045: What does this map show, and why is it one of the most famous altimetry images?
Sea surface height anomaly from TOPEX/Poseidon during the 1997-98 El Nino, the first super El Nino observed by satellite altimetry.

Img S046: Compare this with the Dec 2010 SSHA map. Which is El Nino and which is La Nina?
1997 = El Nino (high SSH in the east Pacific, low in the west). 2010 = La Nina (low SSH in the central/east Pacific, high in the west around Indonesia/Australia).

Img S047: Low SSH along the central equatorial Pacific and high SSH near Indonesia: which ENSO phase?
La Nina (here Dec 2010). Strong trade winds push warm water west, piling it up near Indonesia/Australia.

Img S048: Why is chlorophyll so high along the California coast in spring?
Northwesterly winds drive coastal upwelling (Ekman transport offshore), bringing cold, nutrient-rich deep water up, which feeds phytoplankton blooms.

Img S049: Name the satellite/instrument and product.
PACE OCI, chlorophyll-a concentration.

Img S050: Compare the true-color and chlorophyll images of the same PACE scene. What does the chlorophyll algorithm use?
The ratio/shape of blue vs green water-leaving reflectance: more chlorophyll absorbs more blue light, making water greener.

Img S051: How is this GRACE gravity anomaly map different from a GRACE water storage anomaly map?
This shows the mean gravity field compared with a smooth Earth (milligals). Water storage maps show month-to-month CHANGES in mass, converted to cm of equivalent water.

Img S052: On a GRACE mass-trend map, why is there a mass GAIN around Hudson Bay?
Glacial isostatic adjustment: the mantle is still flowing back under land that was pressed down by ice-age ice sheets.

Img S053: Name three places with strong GRACE mass loss and the cause.
Greenland and West Antarctica (ice sheet melt/discharge), Alaska and Patagonia (glacier loss), northern India (groundwater pumping).

Img S054: What does HARP2 measure and why is the cloudbow useful?
Polarized light at many viewing angles in 4 visible/near-infrared wavelengths. The cloudbow's angular pattern gives cloud droplet size distribution.
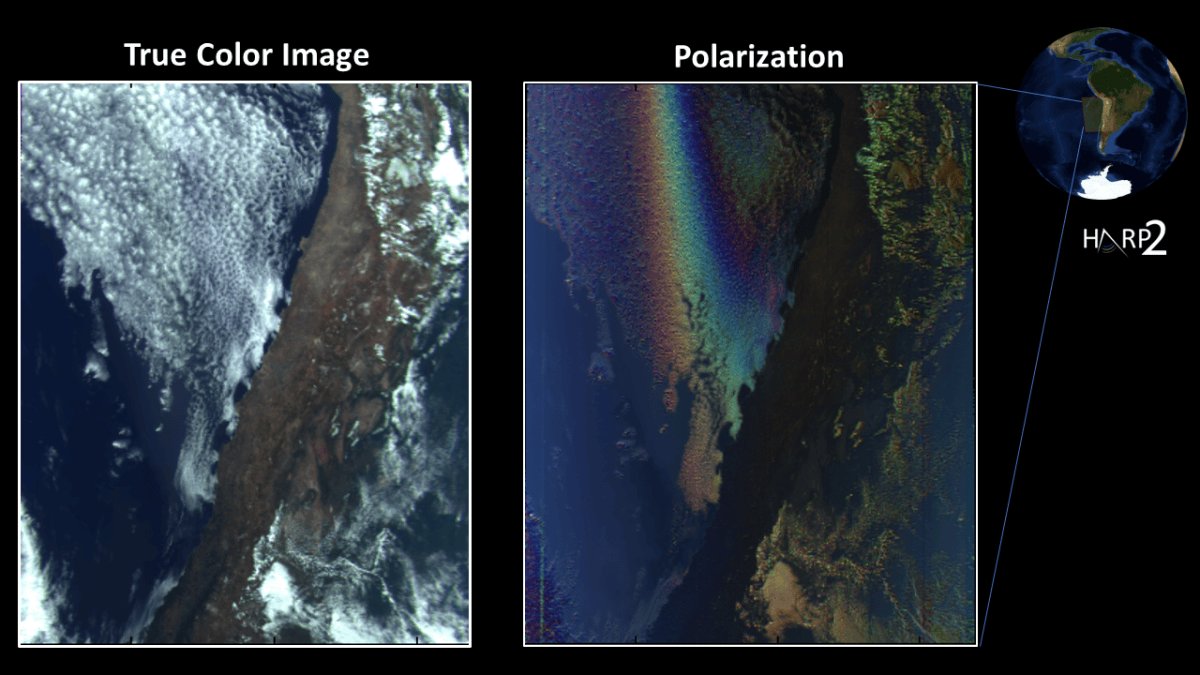
Img S055: PACE: which instrument for ocean color, which for wide-swath polarimetry, which for narrow-swath detailed aerosol polarimetry?
OCI. HARP2. SPEXone.

Img S056: Name the five altimetry missions in the sea level record, in order.
TOPEX/Poseidon (1992), Jason-1 (2001), OSTM/Jason-2 (2008), Jason-3 (2016), Sentinel-6 Michael Freilich (2020).

Img S057: Why do successive altimetry missions overlap in time?
To cross-calibrate the instruments so biases are removed and the long-term record stays consistent (tandem phase on the same orbit).

Img S058: NOAA's linear trend is about 3.2 mm/yr but NASA quotes about 4.2 mm/yr now. Why the difference?
3.2 mm/yr is the average linear trend since 1993. The rate has accelerated, so the current rate is higher.

Img S059: Is sea level rising at the same rate everywhere? What does this map show?
No. Total sea level change since 1993 from altimetry varies regionally (fastest in the western tropical Pacific) because of winds, currents and uneven ocean warming.

Img S060: Along an altimeter track from the Southern Ocean to the Arctic, where are significant wave heights largest and why?
In the mid-latitudes (about 40-60 degrees), where strong westerly winds and storms generate big waves. Smallest near the equator (doldrums).

Img S061: What does 'significant wave height' mean?
The average height of the highest one-third of waves (about 4 times the standard deviation of sea surface elevation).

Img S062: A global, gap-free significant wave height map: is it from an altimeter alone?
No. Altimeters give only along-track lines. Gap-free maps are from wave models (e.g. WAVEWATCH III) or merged multi-mission gridded products, often checked against altimeter data.

Img S063: Where are the largest significant wave heights on this map and why?
North Pacific and Southern Ocean storm tracks: strong, persistent winds over long fetches.

Img S064: A global map of sea level trend in mm/year from 1993 onward: which satellite type and which mission made it?
Radar altimetry, TOPEX/Poseidon (continued by Jason-1/2/3).

Img S065: Why does this sea level trend map show the fastest rise in the western tropical Pacific?
Strong trade winds (La Nina-like / negative PDO phase) piled warm water into the western Pacific while the eastern Pacific fell.

Img S066: Comparing 1979-2000 with 2001-2022 tropical cyclone wave composites, what changed?
Significant wave heights increased near storm centers (trends around 6-10 % per decade), and the wave field grew larger.

Img S067: What is the likely cause of the increasing cyclone wave heights, and the coastal implication?
Tropical cyclone intensification with warming oceans, raising coastal flooding and erosion risk.

Img S068: This map shows a 1992-2019 change in what quantity, and from which missions?
Sea surface height (sea level), from the TOPEX/Poseidon and Jason-1/2/3 radar altimeters.

Img S069: How does a radar altimeter work, and is it active or passive?
Active. It sends a radar pulse straight down and times the echo, distance = c x time / 2, and with a precise orbit this gives sea surface height.

Img S070: What are the two main causes of the sea level rise shown in this 1992-2019 map?
Thermal expansion of warming seawater and added water from melting land ice (glaciers and ice sheets