AH Geography - Graphic methods and techniques: fieldwork Skills
 Call Kai
 Learn
Learn Practice Test
 Spaced Repetition
 Match
Match Flashcards
 Knowt Play
1/35

There's no tags or description
Looks like no tags are added yet.
Name | Mastery | Learn | Test | Matching | Spaced | Call with Kai | Chat |
|---|
No analytics yet
Send a link to your students to track their progress
36 Terms
Coastal / Beach sampling: Describe how to measure the width of the beach
Measure width of beach from strand line to back of beach using a tape measure
Coastal / Beach sampling: Describe how to measure the slope of the beach
- Using ranging poles to identify notable changes in beach slope
- Use ranging poles and a clinometer to measure angle of beach or alternatively use a Smartphone app placed on a metre stick to give angles
Coastal / Beach sampling: Describe how to measure the infiltration rates of the beach
Infiltration rates - use a stopwatch to time how quickly 1ltr of water (in a bottomless plastic bottle ) disappears
Coastal / Beach sampling: Describe how to measure the porosity rates of the beach
Porosity rates - fill a 1ltr jug with sediment or sand and then add water to calculate the percentage of space between sand/pebbles
Coastal / Beach sampling: Describe how beach sediment could be measured
- Beach sediment (pebbles) should be sampled randomly (e.g. using a blindfold) and pebble axes can be measured using callipers and Callieux roundness cards
- Finer sediment can be measured using sediment sieves and the percentage of material collected in each sieve can be calculated once each layers is weighed
Coastal / Beach sampling: Describe how wave frequency could be measured
Wave frequency can be measured by timing number of breaking waves to pass an object (e.g. ranging pole or offshore rock) in 1 minute
Coastal / Beach sampling: Describe how cliff position or beach shape/size ect could be analysed
Change in beach or cliff position over time can be analysed using historical maps (secondary sources from a local reference library) or historical photographs
Coastal / Beach sampling: Describe problems / issues
- Awareness of tide timetables (in inaccessible locations)
- Beach profiles can vary considerably during the year (winter storms cause more erosion) - may need to repeat across various seasons
- Difficulties using a clinometer with ranging poles particularly in exposed/windy conditions
- Using the roundness scale introduces subjectivity; the same person must do every piece of sediment to remain valid
- Need to ensure pebbles are selected randomly to avoid human influence over selection - use a blindfold
Coastal / Beach sampling: give examples of processing techniques
-Beach transects / cross- sections
-Kite diagrams could show longshore drift
- Dispersion graphs for comparison of pebble sizes.
- Chi-square can be used to prove a difference in sediment type / other variables between two beaches
River Studies: describe how you would measure the width of the river
Measure width using a tape measure
River Studies: describe how you would measure the depth of the river
Divide channel width by 11 to give 10 sections, measure the depth at each interval using a metre stick (regular sampling)
River Studies: describe how you would measure the velocity of the river
Measure speed using a flowmeter or by timing a float (e.g. orange) to cover a specific distance (5 metres)
River Studies: describe how you would measure the wetted perimeter of the river
Wetted perimeter can be used by laying a chain along river bed or a programme (e.g. Geopacks)
River Studies: describe how you would measure the sediment size and angularity of the river
Sediment should be sampled randomly (e.g. using a blindfold) and pebble axes can be measured using callipers and Callieux roundness cards
River Studies: potential problems / issues
- Inaccessible and overgrown sample sites
- Rate of flow (flood conditions) can make sampling dangerous
- Differences in flow rates across a meander (deeper on outside of bend)
- Low volumes of water can create difficulties in measuring velocity (need to repeat and average)
- high volumes i.e too deep, may make data collection difficult
River studies: processing techniques
- River cross section shows relationship between depth and width
- Scatter graphs can be used to compare different points on a river e.g. relationship between distance from source and discharge. Further statistical analysis (correlations) using Spearman Rank or Pearson's Product tests.
Soil Sampling: describe how you could get a sample of soil to measure soil depth
Using a soil Auger, intsert and twist until reaching rock. Remove from the ground and measure extent of soil
Soil Sampling: describe the method of obtaining soil moisture readings
An empty crucible is weighed and mass recorded. The soil sample is then placed in crucible and is reweighed to determine the mass of the hydrated soil. The crucible was heated in the microwave for 6 minutes to dry the soil out and anhydrous soil weighed.
Hydrated Soil (g) - Anhydrous Soil (g) = mass of water in soil (g) = soil moisture
Soil Sampling: describe the method of obtaining soil pH readings
1cm^3 of soil, 1cm^3 Barium Sulphate, 1cm^3 universal indicator, and 10cm^3 of water are placed in a test tube, mixed together and colour obtained is compared with a pH chart.
Soil Sampling: describe the method of obtaining soil texture readings
Turn investigate soil texture and sediment size, a soil sieve was used. Weighed dry mass was placed in the sieve and shaking for three minutes. The layers in the sieve were separated based on size. The mass of soil in each partition with weight allowing an exact percentage of each soil sediment to be calculated
Soil sampling: describe how vegetation cover would be investigated
At each interval of 5×5 Quadra produced. The number of squares containing a plant root or plant leaves was recorded and converted into percentage cover. The different species of plants was also recorded. Note of the surrounding tree coverage of each site was also made
Soil sampling: limitations and problems
- Gain permission of landowner before digging soil samples
- Ensure probes for pH and soil moisture metres are clean before use
-water can evaporate between collection of sample and the lab experiments to overcome this they could be kept in airtight bags.
-to improve pH reading accuracy, and soil moisture readings, electronic probes could be used on site.
Soil sampling: processing techniques
- Annotated photographs or sketches of soil profile
- Triangular graphs to show 3 variables of soil structure (organic, inorganic and water)
- kite diagrams
Sand dune and vegetation studies: similar to beach analysis
- Similar processes to beach transects - use ranging poles and clinometers to measure angles across a dune system
- Quadrats used to measure vegetation covers e.g. % of bare sand and % of different species
- Soil moisture, light and pH meters can be used
Plant guides or keys used to determine species of flowers and grasses
- Organic material (humus) - use same procedures for measuring organic content in soils (dry, weigh and burn off humus)
Sand dune and vegetation studies: problems and issues
- Difficult to identify plants using guidebooks (esp. in winter months)
- Ensure probes for pH and soil moisture metres are clean before use
- Light meters can give varying results (even slight shadows can affect results)
- Soils samples should be handled with rubber gloves and sterilised before being processed (can contain harmful bacteria)
- Need access to a fume cupboard when burning humus in soils
Sand dune and vegetation studies: processing techniques
- Kite diagrams show change in vegetation across a dune system or slope
Triangular graphs to show 3 variables of soil structure (organic, inorganic and water)
- Spearman's Rank Correlation Coefficient to investigate changes with distance inland from the seashore
- Simpson's diversity index can show the range of plants within an area
Microclimate studies: methods
- Use a hand-held thermo- anemometer at various points within a town or neighbourhood
- Hygrometer to measure humidity
- Cloud cover and visibility could be observed
Microclimate studies: problems and issues
- Wind strength is hard to measure at ground level
The Beaufort scale is subjective
- Cloud cover can change from one moment to the next, affecting temperature and light readings. Need to repeat and average constantly
- Observations (cloud cover) are subjective
Microclimate studies: processing techniques
- Wind rose / polar graph can show weather
- Isoline maps to show patterns of humidity and temperature (isotherms)
- Annotated base maps
CBD Studies: describe how you would carry urban land use mapping
Use OS maps and land-use mapping keys (RICEPOTS) to record land use, building height and quality.
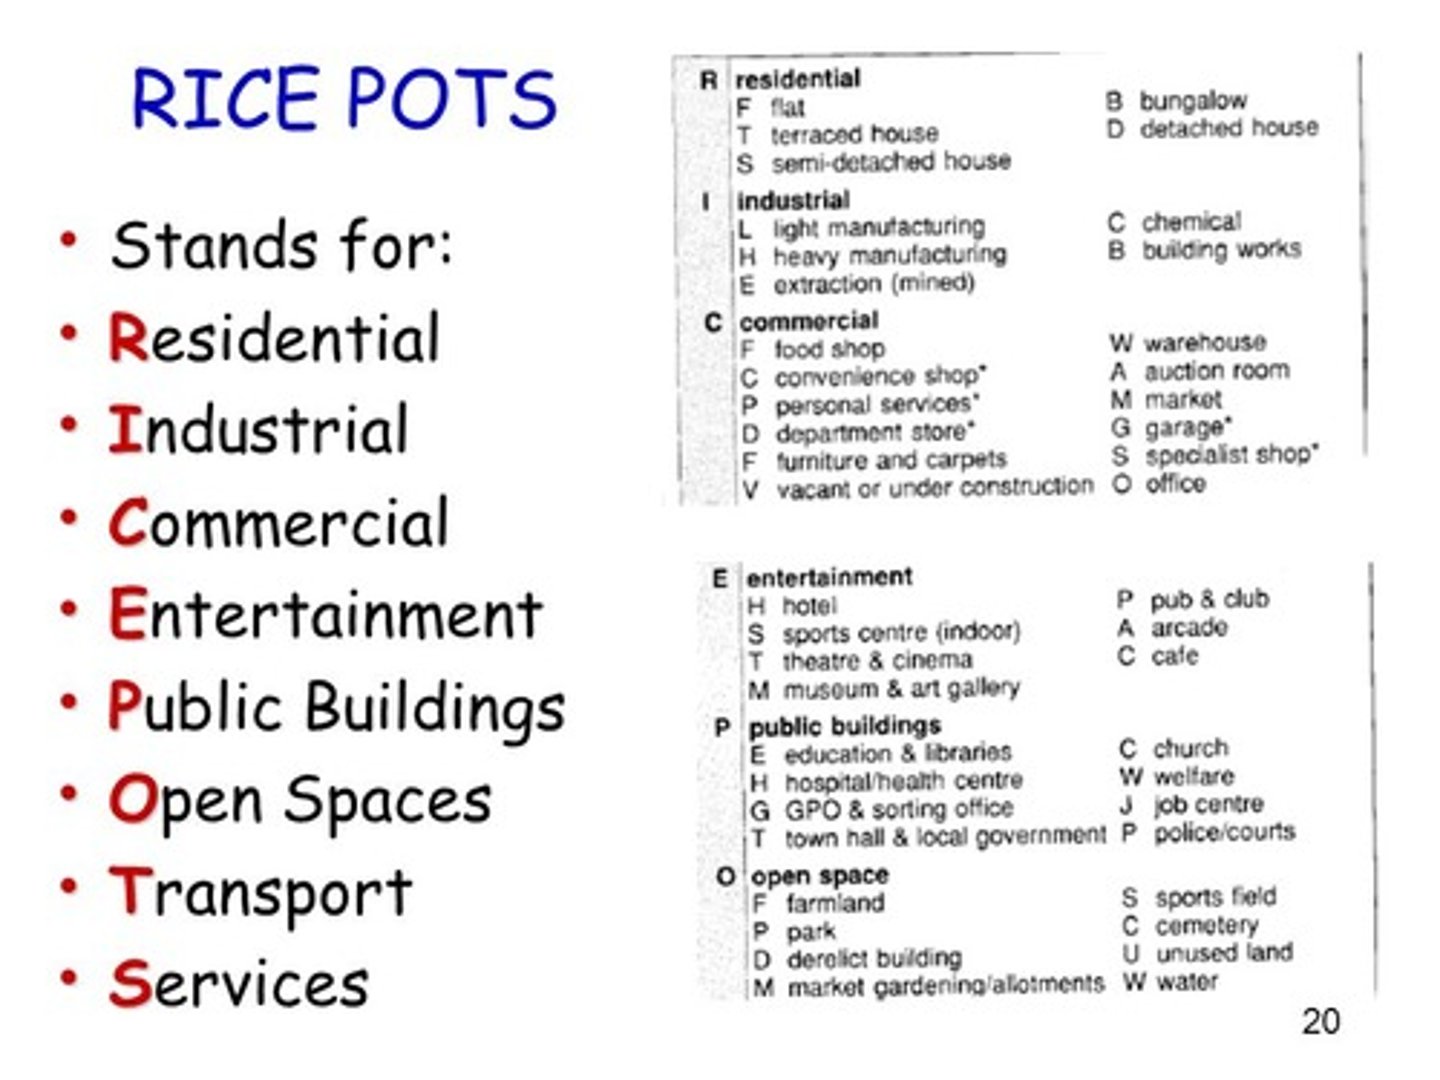
CBD Studies: describe how you would imvestigate quality
Use recording sheets to record environmental quality surveys, interviews and questionnaires. Decibel metres (easily available as free Apps) can be used to measure noise pollution.
CBD Studies: Describe how you would investigate pedestrian numbers
Count how many people walk past each side of the road (in each direction) over 5 mins. Multiply this by 12 to get a count for an hour
CBD Studies: Describe how you would investigate vehicle numbers
traffic counts: record each type of vehicle (categories for cars, bikes, motorcycles, buses, lorries, taxis ect) in each direction for 5 mins. Multiply by 12 to know how many over an hour average.
CBD studies: limitations
- Can be difficult to determine usage of upper floors in the CBD
- Timing of traffic / pedestrian counts. One off counts can provide misleading trends e.g. Weekend v midweek (better to repeat and average)
CBD studies: processing techniques
- Annotated /coloured land use map
- Nearest Neighbour can be used to show if clustering of certain services (e.g . pubs, vacant properties) exist
- Flow line maps show pedestrian and traffic movements
- Bipolar tables/graph can process questionnaire results to show perception of an area
- Simpson's diversity index can show the range of shops within an area / CBD based on RICEPOTs analysis
Pollution Studies: methods
- Analyse air samples using test tubes with filter paper located randomly around an area (leave out for 2-3 weeks then collect)
- Secondary sources of air pollution (e.g. Nitrogen oxide levels, particulates) from SEPA website and local authority data
- Observe lichen coverage on walls and trees as an indicator of atmospheric pollution (some lichens are more tolerant of pollutants)
- Noise pollution can be measured using a noise or decibel metre
- Thermal pollution of water measured using a thermometer
- pH of a river/stream using a pH meter
- Observe invertebrates on stream bed e.g. Mayfly nymph (indicator species) can indicate how well oxygenated a stream is