Stats Midterm 2
 Call Kai
 Learn
 Practice Test
 Spaced Repetition
 Match
 Flashcards
 Knowt Play
1/52

There's no tags or description
Looks like no tags are added yet.
53 Terms
Formula for Covariance
Cov(X,Y) = E(XY) - E(X)*E(Y)
Var(aX + bY). Formula of variance with constants
a²Var(X) + b²Var(Y) + 2ab * Cov(X,Y)
Can Covariance be negative?
Yes, when negative it represents the direction of the linear relationship: Inverse relationship between X and Y (As one increases, the other decreases).
Can Variance be negative?
No
How to compare Linear Associations between two different Covariances?
Correlation, the normalized version of Covariance
Correlation Formula
Cov(X, Y) / (sigma_x * sigma_y)
Correlation (R/rho) Units
None, thats the point of correlation, so compare different situations that contain different units.
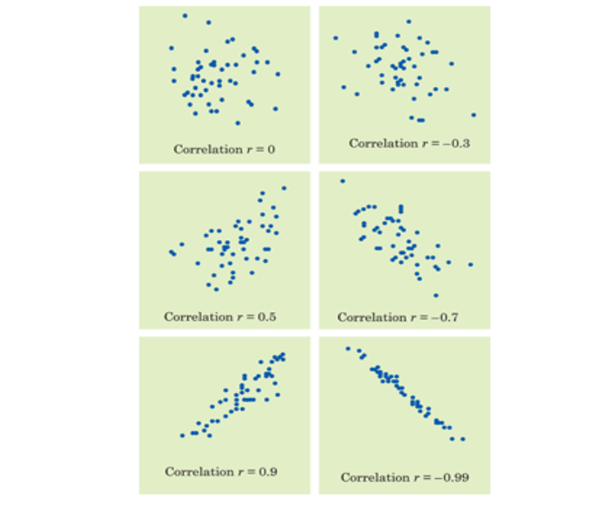
Positve vs Negative Correlation (R/rho) vs 0 Correlation.
Positive 1 indicates a perfect, linear association between the variable. -1 is perfect negative linear association. 0 indicates no linear correlation, but could be sinusoidal, exponential, etc. Does NOT mean independent.
Linear Correlation Graphs
Parameter
Quantity that is used to describe a characteristic of a population. Generally unknown.
Parameter Examples
Mean income of all employees at a company, Total number of injuries as the result of some treatment for all the residents in the country. (Both kinda unknown/ difficult to attain)
Statisitc
A quantity computed from the values in a sample, like a subset of all instead of everyone. Representative of the entire population.
Sampling Variability
Any statistic is a random variable, using a different sample would get a different result. Samples can look different and it’s good to know that.
Sampling Distribution
the probability distribution of a specific statistical value (like a sample mean or proportion) calculated from all possible random samples of a fixed size drawn from a given population
A (simple) random sample (SRS)
Of size n, is a sample selected in a way that every possible sample of size n has the same chance of being selected.
Simple Random Sample (SRS) Qualities
1. Suppose the population is finite of size N and sample size is n.
2. We often refer to values of the variable as the random sample rather than the individuals.
3. Unless otherwise stated, all data presented in examples are obtained from a simple random sample.
Sample Mean Denoted By:
X bar
Sample Mean Formula (Where N represents the total number of items or data points in the sample)
X bar = (x1+ x2 … + xn) / n
What does sample distribution represent?
(TBD), the average of all of the samples?
The Distribution of the Sample Mean (Mean)
mean (mew) = E(X-bar) = mean of X-bar (mew x-bar)
The Distribution of Sample Mean (Standev)
standev of X-bar² (sigma X-bar²) = V(X-Bar) = sigma² / n and sigma X-bar = sigma over sqrt(n)
The Distribution of Sample Mean (Total)
(TBD)
Central Limit Theorem
Normality rule of thumb: 30 or larger. If the original population is already normally distributed, the sample means will be normal even for smaller sample sizes. The mean for the sample will be similar to the mean of sampling the individual directly because there is enough data.
Point Estimation (theta)
A parameter (theta) is a single number that can be regarded as a sensible value for theta.
How is a Point Estimation Obtained?
Selecting a suitable statistic and computing its value from sample data. The selected statistic is call the point estimator of theta, denoted by theta hat.
Point Estimate for Binomial Data
P (probability of success) = x / n (successes over total number of trials)
Point Estimate for Continuous Measurements
mew (mean) = (TBD) chapter 6 notes
Which Estimator to Use?
Ideally, theta hat = theta. More realistically, get it as close as possible by saying theta hat = theta + error of estimation. The bias is the difference betweent the two thetas.
When is theta hat unbiased
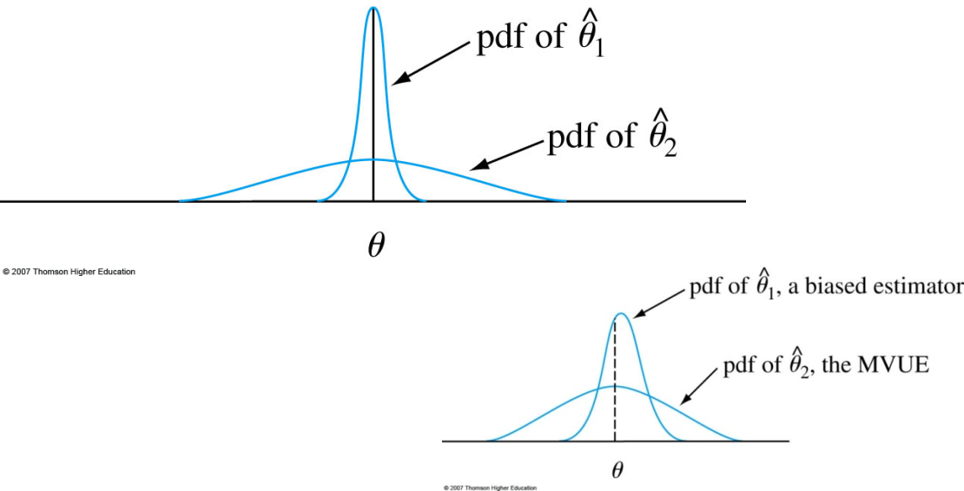
THETA HAT IS UNBIASED IF ITS PROBABILITY DISTRIBUTION IS CENTERED AT THE TRUE VALUE OF THE PARAMETER.
X bar (Sample mean) = mew?
True
Biased vs Unbiased Statisitc
TBD, chapter 6 early notes
Which is the Better UNbiased Estimator?
The one which has less variance, like a skinier buldge on a graph:
What does the hat mean on a variable?
It is an estimator
How To Calculate Variance of Estimators?
Minimum Variance Unbiased Estimator (MVUE)

Even though it has a larger variance, MVUE breaks the tie?
Standard Error
Standard Deviation of Estimator. sigma / sqrt(n)
Method of Moments
a technique in statistics used to estimate population parameters (such as the mean, variance, or rates) by matching theoretical population moments to empirical sample moments.
Different k population moments meaning
1 is expected value, 2 is variance, 3 is skewness, 4 is kurtosis?
How to Find the mean of a Distribution? example 6 on chapter 6 notes
TBD
What is Wrong with the Method of Moment Estimator?
Derived from the distribution of the data to formulate the estimators. For example, if there is a uniform distribution 1,1,2,4,12. After calculating, theta hat = 2*X bar = 2(20/4) = 8. But we observed a value of 12, which wouldnt be possible on a uniform distribution on the interval [0,8]. (12 doesn’t fit in this)
Maximum Likelihood Estimation
Instead of using moments, use parameter estimation where the joint density of the responses is considered as a function of the parameters with the data fixed.
L(theta;y) = F(y:theta)
L is likelihood, f is the probability density, y is the vector of respones, and theta is the vector of parameters.
This result can be obtained by Bayes’ Rule.
Given a set of y, what is the likelihood of theta?
IID (usually for xi)
Independent and Individually Distributed
This is important because they have to come from the same pmf (ie poisson) … ?
MLE of Poisson Distribution
Find derivate of p(x;mew). Can do this by splitting it up with natural logs with respect to mew. This is the same of the Method of Moments Estimator (MoME), but the results will not always be the same. WE still need to check if this solution is a maximum? Can check this by doing the sign of the second derivative and whether it is opening up or down.
How to Determine if the MoM or MLE is better if they’re different?
Look at the bias of the two estimators. If they’re both unbiased, whichever one has a smaller variance.
MLE of Gamma Distribution
f(x1, x2, … xn; alpha, Beta)
= f(x2;alpha,Beta) * f(x2;alpha,Beta) * … f(xn;alpha,Beta)
etc. using natural log-likelihood
cant even do this because of partial derivatives I guess so we gotta use numerical methods
Confidence Interval (CI)
An interval calculated from the data that has a given probability of covering the true parameter of a value. This probability is known as the confidence level
Two Assumptions for a Confidence Interval for the population mean mew:
The population follows a normal distribution
The value of the population standev sigma is known (generally sigma is harder to know considering its a parameter, so its not always given)
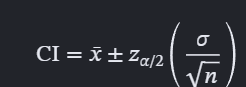
CI formula Given Sigma and Normal
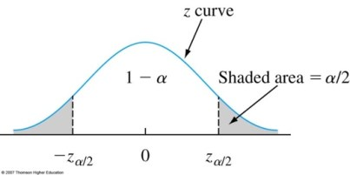
In the example for 95% confidence, the Z was 1.96. 95% confident mew (of the ENTIRE population) is contained in the given confidence interval.
For the z value, you use inverse Normal (invNorm). IE: invNorm(0.025, 0, 1) is for 95% confidence. 0.025 if the 0.05 on either side of the normal curve div by 2.
If you wanted 90% confidence, alpha is 0.1. 0.05 is on either side of the normal curve. InvNorm(0.05, 1, 0) = 1.645.
What does a larger sample size do to confidence level?
Shrinks the confidence interval because its more representative of the population. A better snapshot, it just cost more time and money to get more samples
Suppose someone wants to have a specific sized confidence interval, what sample size is needed? (Presuming we know sigma)
solve for n in confidence interval formula, but you gotta round UP to the nearest sample: n = ((Z_a/2)*(sigma / E))². E is margin of error, which is ½ the width of mean.
What to do if you want to find CI but you don’t have sigma?
You estimate using sample standard deviation, called s, more specifically finding s² which is unbiased, but can use s because whatever. As long as our sample gets upward of 30, its close enough to plug in s instead of sigma. s is calculated from the data.
Confidence for Proportions instead of Means
Proportion is binary, if its there than 1, if it isn’t then its 0.
To calculate CI using proportion (if n is big enough), its p~ +- z_a/2 ~=~ [image].
The calculator does this formula for p hat, not for p tilda.
Well how do we know we have enough samples? np >= 10, n(1-p hat) >= 10. Both of these must be met.
