Fishery exam 2
 Call Kai
 Learn
 Practice Test
 Spaced Repetition
 Match
 Flashcards
 Knowt Play
1/81

There's no tags or description
Looks like no tags are added yet.
82 Terms
largemouth bass in peter lake eat all the prey entered in this “cost curve”
Their diets include everything from Daphnia to warblers, frogs, Snakes, and 7 spp. of mammals!
no exploitation of this pop, therefore the bass density is very high. that means that competition for food is very intense
calc is the math of dynamics/change
area under curve is a sum
time discrete function → dx/dt
allocthonous
food/energy source from outside
autochthonous
food/energy source from within
crayfish - How does a smallmouth forage in an optimal way when crayfish are the prey?
among preferred prey of small mouth bass
Crayfish have effective defenses.
This bass is not foraging optimally! The crayfish is fighting for its life. The bass is losing foraging time
by coming from behind, the bass is able to stay out of the way and sneak up on the crayfish to successfully capture them
prey capture rate can be increased through learning
chance to learn increases with prey density.
increased skill to attack and capture the prey and/or increased ability to find/detect the prey
functional responses (Holling)
In type I there is a linear relation between prey density and the maximum number of prey killed
in type II the proportion of prey consumed declines monotonically with prey density.
Type III is described by a sigmoid relation in which the proportion of the prey consumed is positively density-dependent over some regions of prey density.

3 ways to describe an ecological concept
verbally
graphically
mathematically
Holling’s disc equation (type II)
Pe = a’TsN
Pe = # of prey eaten per unit time
a’ = attack rate or search efficiency
Ts = time spent searching for prey = Ttot - ThPe
Th = per prey handling time
collapse and failured recovery of northern cod stocks
the cultivation/decompensation hypothesis
why haven’t cod recovered
we continue to eat them

the cultivation-depensation hypothesis: trophic triangles

the predator pit
a critical intersection point marks where the abundance level above which the rate of production exceeds the rate of predation mortality and the population increases (prey pop achieves breakout) and below which the rate of predation mortality exceeds the rate of production (prey pop collapses into the pit)

models of predator prey dynamics: lotka volterra prey equation
describes the rate of increase of the prey pop
dR/dt = rR - cRP
cRP = number of prey killed
R = # prey
P = # predators
r = prey’s per capita exponential growth rate
c = constant expressing efficiency of predation
models of predator prey dynamics: lotka volterra predator equation
describes the rate of increase of the predator pop
dP/dt = acRP - dP
acRP = predator recruitment
P = # predators
R = # prey
a = efficiency of conversion of food to growth
c = constant expressing efficiency of predation
d = constant related to the death rate of predators
discrete time form of prey equation
Rt+1 = Rt + rRt - cRtPt
discrete time form of predator equation
Pt+1 = Pt + acRtPt - dPt
blue crab females can’t mate until they molted their shell (soft shell crab)
very vulnerable at this time → males defend the females
“sponges” under their tail which is the fert eggs
females migrate to edge of estuary and spawn
recruitment
the number of individuals that reach a specific stage in the life cycle”
eg age 1 or recruitment to the fishery or to a survey gear
highly variable
under the right conditions, a small spawning stock can pull off a huge recruitment
what determines recruitment - match mismatch hypothesis
cushing 1975
most larvae starve to death, often at the time of first feeding (after yolk sac used up) → “critical period”\\
in temperate latitudes, spring phytoplankton bloom followed by zooplankton bloom - timing varies
spawning time depends on cues like temp and day length - timing varies
in years in which larval first feeding matches zoop abundance peak, larval survival is high(er)
what determines recruitment - ocean stability hypothesis
lasker 1981
patches of food (and particles of all sorts) develop when the ocean is calm
wind and waves mix the particles over a larger volume
food aggregations are critical for larval survival as overall food density is low as is their search ability
but moderate turbulence increases encounter rates at low prey density
life at low reynolds number
reynolds number Re
Re = inertial forces/viscous forces = Ud/v
U = velocity: of an organism (cm/s)
d = distance: length of an organism, in cm
v = kinematic viscosity of water, about 0.01 cm2/s
typical swimming speed for fish is 1 body length/s
larval herring length at first feeding: 0.9cm
human swim speed = 2m/s
what determines recruitmen? predation
“bigger is better”
those who grow fastest survive
predation rates are size dependent
bigger is better, but growth has substantial costs
when does dispersal happen
depends
clownfish - larval stage
striped marlin - adult stage
how far do fish disperse
depends on pelagic larval duration (for larvae)
implications of dispersal for management
limited control over dynamics - substantial harvest or other mortality may occur beyond your jurisdiction
difficult to tease apart distribution changes from abundance changes (maybe the fish have just moved beyond reach of the survey or fishery)
so where possible,, stock assessment and management should happen at the level of the unit stock - stock = population
great bay striped bass vs sacramento river winter-run chinook
stock identification
tagging
genetics
natural and unnatural chemical tags
natural stable isotopes in tissues, trace metals in otoliths
contaminants - only when the contaminant has a known source location (ex Fukushima and pacific bluefin tuna)
parasites
The ideal tag parasite is a parasite that has significantly different levels of infection among localities which persist for a long period (a permanent parasite), that is easily detected and identified, and that does not cause serious damage to the host
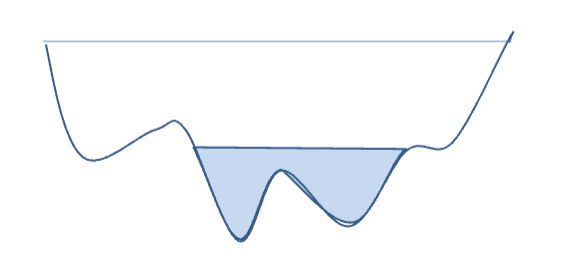
density dependent habitat use
ideal free distribution - realized suitability is equal in all habitats
basin model - topographically depicts resource availability
low energy dip → gaining highest return on investment
fish are in the best habitat until the pop level reaches a point where they spill into the other habitats
can lead to hyperstable CPUE - CPUE stays high even as the pop declines
climate induced range shifts
many expect northern shift but can also see shift south/down slope to deeper waters
bioenergetics
a conceptual and quantitative approach to understanding fish growth and condition
fish growth - why do we care
envi indicator, effects fish survival, fisheries management, repro fitness, indicator of “success,” highly variable
fish growth - high variability
conditions (temp, DO…)
prey availability
time
region
factors affecting fish growth
diet
lake trout that feed on plankton grow more slowly than fish eaters/piscivores
what factors affect lake trout diet
prey availability
some lakes have forage fish, others not
abundance of forage fish varies (among lakes, among years)
stunting
slow growth rate = small size at age
reasons for stunting
limited food
high densities of fish
effects on repro? early or late?
fish condition
measure of fish “chunkiness”
standardized weight
plot length - wright relationship for fish in pop
fit regression equation
solve equation for common sized fish
allometry
weight-length relationship
predicting growth using bioenergetics
growth - f(consumption, temperature)

Fish Growth: a bioenergetic perspective
biomass change = consumption - (energy costs + wastes)
deltaB = C - (R+ SDA + G + E + F)
energy input → C = consumption; food/energy input
energy costs → things fish do
R = respiration (metabolism; activity)
SDA = specific dynamic action (digestion)
G = gonad growth (repro)
F = egestion (feces; undigested waste)
U = excretion (urine)
consumption as a function of temperature
temperature = measure of kinetic energy
temperature affects on metabolism (R)
metabolic constaraints = R * f(T)

% consumption as a function of DO
energy input = C * f(DO)
f(DO) = multiplier on consumption
f(DO) = 1 at max %DO
f(DO) < 1 with decreasing %DO
f(DO) → 0 in anoxic conditions
DO saturation declines with temperature
DO - amount of oxygen in water
dissolution is function of temp
hotter = less DO
temp-DO interaction
energy input = C * f(DO,T)
seasonal cohorts - ex: Anchoa mitchilli (bay anchovy) in Chesapeake Bay
bay anchovy synchronous batch spawner june-sept
cohorts about 2.5 weeks separated
life histories depend on time of year
spawn timing
conditions
prey availability
energy budget function of temp
assume: max consumption, weight constant
no digestion (large egestion) → energy input and action = 0
conditions are month dependent
how do initial conditions differ among cohorts
what conditions differ over months? how?
what are consequences to cohorts
which cohort grows fastest? when?
which cohort grows largest?
how will cohort sizes differ after year 2
Von Bertalanffy growth model (VBGM)
VGBM estimates size-at-age
La = Linf * [1 - e(-k* (a-t0))] = length at age a
Linf = mean length (cm) of oldest individuals
k - growth coesfficient
a = age (yr)
t0 = length at age 0 (yint)
if t0 = 0 simply to: L = Linf * (1- e-k*a)
how will climate change impact growth of salmonids in mongolia
Lenok and grayling will either grow slower or need to eat a lot more to maintain their historic growth rates… Probably both
R²
the measure of spread around a line/curve
stock assessment in principle
the use of various statistical and mathematical calculations to make quantitative predictions about the reactions of fish populations to alternative management choices
making predictions
fisheries management vs stock assessment
pop dynamics vs stock assessment
stock assessments in practice
stock assessments aren’t done until there is a problem
fishermen’s livelihoods and the sustainability of fisheries depends on decisions that are informed by stock assessments
everything is measured with error, some measurements are biased
reducing fishing effort is very difficult
despite uncertainty, decisions must be made
graphical methods and max sustainable yield (MSY)
N = size of pop
t = time
t-1 = previous time measured (Nt-1 = last measured pop size)
r = pop growth rate
k = carrying capacity
as k goes up, the ratio gets smaller if 1-Nt-1 stays the same
1-Nt-1 gets smaller as Nt-1 gets bigger (start to lose pop growth as approach k)
the more fish, the more you catch → eventually reach a max CPUE and then decreases

conceptual framework
N = pop size
E = effort
C = catch
q = scaler

pop dynamic models (discrete or continuous time)
exponential Nt = rNt-1 (discrete time, difference model)
exponential dN/dt = rn or Nt = N0ert (continuous time, differential equation)
model complexity and numerical vs structural uncertainty → how do you decide how realistic/complex to make the pop model
fit to curve of best fit and adjust
don’t often know what k is
model complexity and numerical vs structural uncertainty → how do you decide how realistic/complex to make the pop model: simulation and assessment
simulation
parameters are known, data is generated
used to test assessment models
assessment
parameters are unknown and are estimated by fitting a model to catch, effort, or other timeseries
Simulation model for taimen
no time series data available
growth model from literature and few dead fish (otoliths/ear bones)
mortality from growth model parameters and life history invariants (pauly method)
carrying capacity from surveys (snorkel and mark recapture) and equilibrium assumption
project population forward under various fishing mortality scenarios
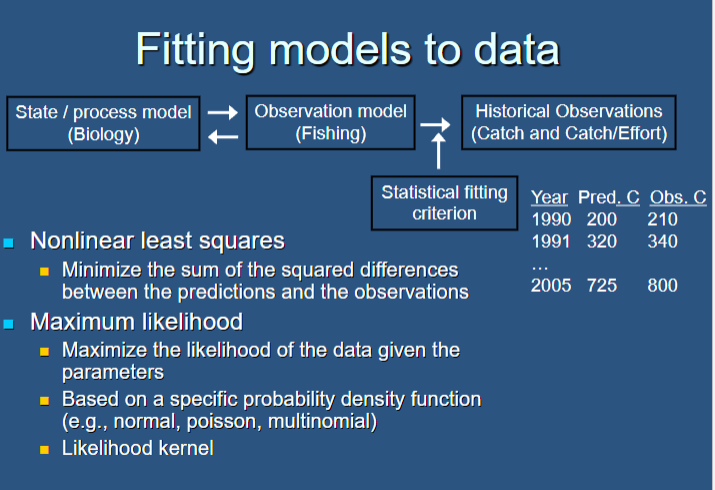
fitting models to data
contrast in catch series
you cannot understand how a stock will respond to exploitation unless the stock has been exploited
adaptive management
admit uncertainty
experiment and monitor
fishery independent data
when scientists measure how many fish they catch, not taking into account commercial fisheries (do surveys everywhere, even where there are no fish)
fishery dependent data
take into account data from the fishery/commercial practice
shifting baseline
stock assessment methods typically assume that the catch time series started at virgin biomass
fishermen’s (and manager’s) expectations change over time
error propagation
Nt = Nt-1 + rNt-1(1-Nt-1/K)
k(r) = error

stock recruit relationships - beverton holt
compensation
survival increases as SSB declines
resource limitation (nursey habitat, food, etc)
stock recruit relationship - ricker
overcompensation
survival increases rapidly as SSB declines
survival increase more than compensates for the loss of spawners
cannibalism, spawning, interference, disease, predator support
want to keep SSB where it makes the most fish by taking enough fish where they won’t eat themselves - sustainable yeild
taking too much SSB does not mean the fishery collapses
collapses is when there aren’t enough replacing themselvesr
ricker equation
R = aSe-bS
R = recruitment
a = scaler
b = birth rate
s = spawning stock biomass
BMSY
the biomass at which MSY is achieved
MSY
number of fish that you want to take out of the pop in order to get the highest # recruits
estimating MSY reference points from your pop model
analytical solution (schaefer model)
MSY = rK/4
BMSY = K/2
UMSY = r/2
r = # recruits
k = carrying capacity
numerical solution
Estimate model parameters
Simulate a range of different harvest rates and record the long-term average yield.
Select the harvest rate that maximizes the long-term average yield and find the associated biomass and catch
UMSY
fishing removal at MSY
yield per recruit
• You can’t control recruitment, but you can change the size/age and intensity of harvest from a cohort
• Harvest too young or too heavily and you’re missing out on growth (growth overfishing)
• Harvest too old/too lightly and many individuals will already have been lost to natural mortality
biomass
number of fish x weight
spawning stock biomass per recruit (recruitment ovrfishing)
Fmax is where you want to fish

F0.1
fish a little less, catch a little less, but have much less impact on the population
the yield at 10% of the slope at the origin
take 10% of the slope at the origin, then change the y int to raise the slope to be tangent to the curve

selectivity matters
increasing the age at entry into the fisheries results in higher yield
irrespective of the age of entry into the fishery, high yield is generally obtained at intermediated fishing mortality
isopleth
contours
epitaph for MSY
larkin 1977
biological complications
age of spawners
periods of low productivity
economic inefficiency
estimation problems
target and limit reference points
• MSY is better as a limit reference point than as a target.
• Biomass will still be frequently (approximately half of the time) below BMSY and occasionally well below BMSY
• Blim – the spawning stock biomass below which recruitment is impaired or stock dynamics are unknown
risk of overfishing
• There is always uncertainty in both the estimates of current stock status and in the estimates of reference points
• The acceptable risk of exceeding a threshold reference point is a management, not a scientific, decision
• The role of science is to quantify the risk of exceeding a threshold reference point based on different decisions
OFL - Overfishing limit
the estimated harvest that would result in F>FMSY – determined by the stock assessment
ABC – Acceptable Biological Catch
the OFL minus a buffer for scientific uncertainty based on a stated (or implicit) risk policy
TAC – Total Allowable Catch
the ABC minus a buffer for management uncertainty
Harvest Control Rules
recognize that stock status can change and management should become more precautionary when the stock is in an undesirable state.