IS451 Practice problems
 Call Kai
 Learn
 Practice Test
 Spaced Repetition
 Match
 Flashcards
 Knowt Play
1/48

There's no tags or description
Looks like no tags are added yet.
49 Terms

Use the regression output in the image. Which interpretation is correct?
A. R-squared = 0.58 means the model's predictions are correct 58% of the time.
B. Holiday weeks cause sales to rise by exactly 45.2 units.
C. Temp is the most important variable because it has the largest p-value.
D. A $1 price increase lowers predicted weekly sales by about 12.4 units, holding the other variables fixed.
Answer:
D Rule: each coefficient = the change in predicted y for a 1-unit change in x, holding the others fixed.
A is wrong: R² = share of variation explained compared to the baseline (the average). It is not "% correct."
B is wrong: a regression on observational data shows a link, not proof of cause.
C is wrong: a big p-value means a weak, not significant, variable.

Predict weekly sales for a week with:
Price = $20, AdSpend = 100, Temp = 70, Holiday = 1
A. 268.7
B. 292.2
C. 313.9
D. 334.0
410 − 12.4(20) + 0.85(100) + 0.31(70) + 45.2(1)
= 410 − 248 + 85 + 21.7 + 45.2
= 313.9
A forgets the Holiday dummy. B forgets Temp.
Tip: plug in every variable, even the ones that aren't significant.

Temp has P>|t| = 0.416. What does that tell you?
A. Temp explains 41.6% of the variation in sales.
B. Temp has a 41.6% chance of causing sales.
C. Temp should be the first variable kept in the model.
D. The data are quite compatible with Temp's true coefficient being 0, so it is not significant at 0.05.
P>|t| measures how compatible the data are with β = 0.
Small (below 0.05) = significant. Big = can't tell it apart from zero.
Think of it like: a fuzzy photo. You can't be sure anything is really there.
On the test set: SSE = 30, SST = 120.
SST uses the TRAINING-set average as the baseline.
What is the out-of-sample R²?
A. 0.25
B. 0.75
C. 0.80
D. 4.00
Out-of-sample R² = 1 − SSE / SST = 1 − 30/120 = 0.75
SSE = the model's squared errors.
SST = the baseline's squared errors (always guessing the training average).
The model cuts the baseline's error by 75%.
In the wine lecture, the model with AGST + HarvestRain had a test-set R² of −0.08. What does a NEGATIVE out-of-sample R² mean?
A. The model fits the training data perfectly.
B. The coefficients in the model are negative.
C. On new data, the model predicts worse than just guessing the training average.
D. There was a calculation error. R² can't be negative.
Negative test R² → SSE is bigger than SST.
The model is worse than the "do nothing" baseline on new data.
Lesson: a higher training R² doesn't guarantee a higher test R².
Think of it like: acing the practice test, then failing the real exam.
SquareFeet gets a NEGATIVE coefficient that is not significant.
On its own, SquareFeet has a strong POSITIVE, significant effect.
What is the best explanation?
A. The test set is too small.
B. SquareFeet doesn't really affect price.
C. The model is overfitting because it has too many observations.
D. Multicollinearity: the two variables overlap, so the model can't split credit between them.
Multicollinearity = independent variables that move together (|correlation| above about 0.7).
Signs can flip and p-values grow, even when the variable matters.
Fix: drop one of the overlapping variables.
Seen in class: Case 1 (N₂O flips sign) and Case 2 (IntRate vs FICO).
Think of it like: two people carrying one couch. You can't tell who's lifting more.
Why did C(Month) raise R² so much?
A. It removes multicollinearity between Unemployment and CPI.
B. It adds more observations to the data.
C. Categorical variables are always significant.
D. As a number, Month forces one straight-line trend from Jan to Dec. As a category, each month gets its own effect.
Numeric Month treats December as "12 times" January. That's not how seasons work.
C(Month) makes a 0/1 dummy for each month (January is the reference). Each month gets its own bump up or down.
Think of it like: giving each month its own price tag instead of one rule for the whole year.
The coefficient on C(Month)[T.6] is +2,400.
What does it mean?
A. June sales are 2,400 units.
B. June has 2,400 more observations than January.
C. Predicted sales in June are 2,400 units higher than in January, holding other variables fixed.
D. Sales rise by 2,400 every month after June.
Dummy coefficients are always compared to the reference category (the one left out).
T.6 = June compared to January.
Same idea as Titanic: Class[T.3rd] compares 3rd class to 1st class.
Logit = −1.5 + 0.08(OfficeVisits) + 0.10(Narcotics)
A patient has 10 office visits and 5 narcotics prescriptions.
What is P(PoorCare = 1)?
A. 0.18
B. 0.45
C. 0.55
D. 0.82
Step 1, logit: −1.5 + 0.08(10) + 0.10(5) = −0.2
Step 2, probability: 1 / (1 + e^0.2) = 0.45
C is the sign mistake (using e^−0.2).
Rule: logit below 0 → probability below 0.5.
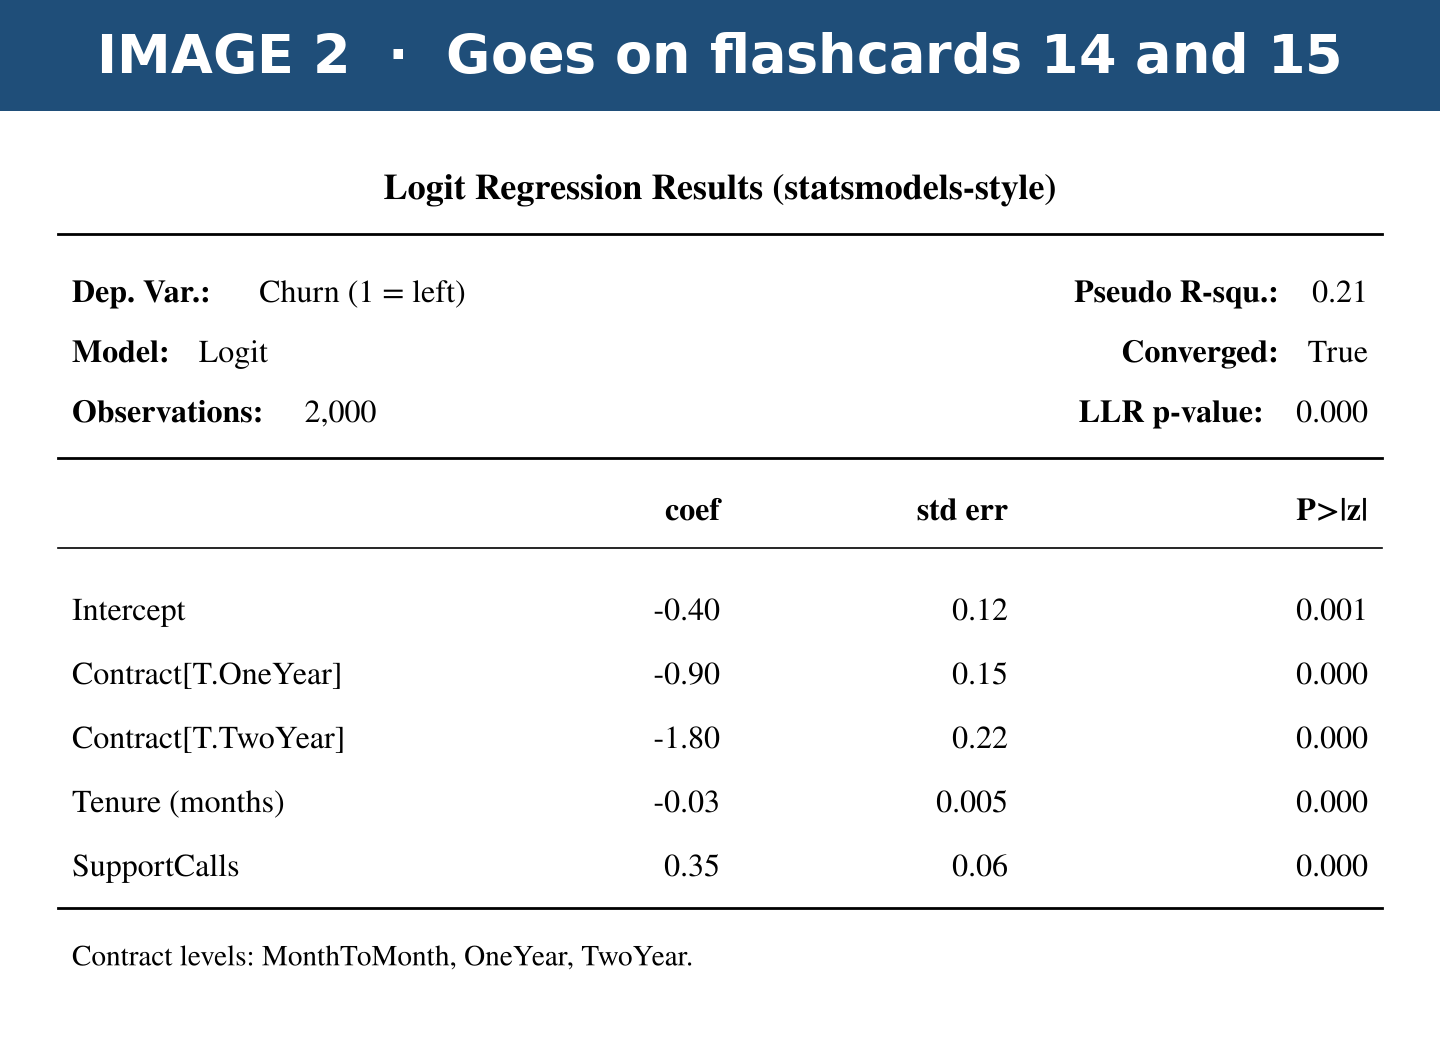
(Contract has 3 levels: MonthToMonth, OneYear, TwoYear.)
What does the coefficient on Contract[T.TwoYear] = −1.80 mean?
A. Two-year contracts cause churn to drop by 1.8.
B. Two-year customers have 1.8% lower probability of churning.
C. Two-year customers are less likely to churn than one-year customers, and that's all it tells you.
D. Two-year customers are less likely to churn than month-to-month customers, holding the other variables fixed.
MonthToMonth is missing from the table, so it's the reference.
Negative coefficient → lower log-odds (and lower probability) of churn than the reference.
A is wrong: this is a prediction model, not a causal one.
B is wrong: coefficients are in log-odds, not percent.

Predict the churn probability for a TWO-YEAR contract customer with Tenure = 20 months and 2 support calls.
A. 0.11
B. 0.30
C. 0.43
D. 0.89
Logit = −0.40 − 1.80 − 0.03(20) + 0.35(2) = −2.10
P = 1 / (1 + e^2.10) = 0.11
C forgets the TwoYear dummy (that's a month-to-month customer).
D is the sign mistake.

What are the precision and recall?
A. Precision 0.63, Recall 0.71
B. Precision 0.71, Recall 0.63
C. Precision 0.80, Recall 0.71
D. Precision 0.83, Recall 0.88
Precision = TP / (TP + FP) = 50 / 80 = 0.63 → reads DOWN the "Predicted 1" column
Recall = TP / (TP + FN) = 50 / 70 = 0.71 → reads ACROSS the "Actual 1" row
Precision: "When I flag something, am I right?"
Recall: "Of all the real positives, how many did I catch?"

How does the model's accuracy compare to the baseline?
A. Model 0.80 vs baseline 0.72 → the model beats the baseline
B. Model 0.80 vs baseline 0.80 → no improvement
C. Model 0.72 vs baseline 0.80 → the model is worse
D. Model 0.80 vs baseline 0.50 → baseline is a coin flip
Accuracy = (150 + 50) / 250 = 0.80
Baseline = always predict the most common outcome (0) = 180 / 250 = 0.72
The baseline is NOT 0.50. It's "guess the majority class every time."
Missing a real fraud is MUCH more costly than a false alarm.
What should it do with the threshold t?
A. Lower t, so recall goes up (catch more fraud), even though precision goes down
B. Keep t = 0.5, which is always best
C. Raise t, so it flags fewer transactions
D. Set t = 1
Lower t → flag more → recall ↑, precision ↓
Raise t → flag less → precision ↑, recall ↓
Same idea as the Parole review: the board fears false negatives, so it lowers t.
Think of it like: a smoke alarm. Better to beep at burnt toast than miss a real fire.
"Of all the patients who ACTUALLY had poor care, what fraction did the model catch?"
A. False positive rate
B. Precision
C. Recall (sensitivity / true positive rate)
D. Accuracy
Recall = caught / all real positives.
Precision = right / all flagged.
FPR = false alarms / all real negatives.
Accuracy = all correct / everyone.
Memory trick: Recall = how much of the real list you can "recall."
At t = 0.5:
Model accuracy = 83.4%
Baseline accuracy = 83.3%
Recall = 4%
Best conclusion?
A. Raise the threshold to improve recall.
B. When one outcome is rare, accuracy is misleading. Look at recall and AUC instead.
C. The model is great because accuracy is above 80%.
D. The baseline is broken.
When most loans get repaid, "predict everyone repays" already scores about 83%.
The model barely beats that and catches almost no bad loans.
AUC checks how well the model RANKS risk, at every threshold.
A is backwards: LOWER t to raise recall.
A. AUC is the same as accuracy.
B. AUC = 0.5 means the model ranks risk no better than random guessing.
C. AUC changes every time you change the threshold.
D. AUC = 0 is a perfect model.
AUC = 1.0 → perfect ranking.
AUC = 0.5 → coin flip.
AUC covers ALL thresholds, so it doesn't depend on picking t.
Think of it like: grading how well you sort people from riskiest to safest, not where you draw the cutoff line.
The simple average is 0.51, but F1 = 0.04.
Why do we use F1 instead of the simple average?
A. F1 only uses recall.
B. F1 is always lower than accuracy.
C. F1 ignores false positives.
D. F1 punishes imbalance, so a model that's terrible at one of the two can't hide behind the other.
F1 = 2 × P × R / (P + R)
It's only high when BOTH precision and recall are decent.
Think of it like: a team grade where one zero drags everyone down.
Why was the model still useful?
A. It had a perfect AUC.
B. It proved that cholesterol causes heart disease.
C. It could separate low-risk from high-risk patients, and its significant risk factors suggested interventions (like blood pressure drugs).
D. It replaced doctors.
Takeaway: a model can be valuable for RANKING risk and pointing to risk factors, even if its yes/no accuracy barely beats the baseline.
Key facts: began in 1948 in Framingham, MA. It gave us the term "risk factor" and the Framingham Risk Score.
Why build a logistic regression to copy an expert physician's poor/good care ratings?
A. Experts are limited by time and memory. A model trained on their judgment can assess millions of patients.
B. To remove the need for any expert input.
C. The physician's ratings were usually wrong.
D. Logistic regression doesn't need any data labeled by experts.
Takeaway: learn from expert judgment, then apply it at scale.
Models don't fully replace experts. Experts help improve and refine them.
Think of it like: cloning a great teacher's grading rubric so every essay gets graded the same way.

Use the classification tree in the image. Each leaf shows P(Reverse).
A new case: lower court decision = liberal, respondent = Business.
What does the tree predict with threshold 0.5? With threshold 0.7?
A. Reverse (0.5), Reverse (0.7) B. Affirm (0.5), Affirm (0.7) C. Reverse (0.5), Affirm (0.7) D. Affirm (0.5), Reverse (0.7)
Answer: C
Path: Liberal? Yes → Respondent = US? No → leaf P(Reverse) = 0.60
0.60 ≥ 0.5 → Reverse 0.60 < 0.7 → Affirm
Tree leaves work like logistic regression probabilities. You still choose a threshold.
What is most likely to happen?
A. Fewer splits and a simpler tree
B. More splits, better training accuracy, and a higher risk of overfitting (worse on test data)
C. The tree stops using the training data
D. Test accuracy always goes up
Smaller min_samples_leaf → more splits → the tree starts memorizing.
Too large → too simple → poor accuracy.
Pick the value with cross-validation.
Think of it like: memorizing the answer key vs. learning the material.
Why use CART instead of logistic regression, and how did it do?
A. CART is more interpretable (a simple yes/no path), and it beat the legal experts' predictions.
B. CART is linear, and it beat the experts.
C. CART needs no data, and it tied the experts.
D. CART gives coefficients for each variable, and it lost to the experts.
Logistic regression gives coefficients but not a simple story of HOW a decision is made.
Trees show the path: "Is the lower court liberal? → …"
It also doesn't assume a linear model.
Takeaway: a simple model using high-level case facts beat experts who had much more information.
What's the problem?
A. Test accuracy can't be computed for trees.
B. Nothing. This is the correct process.
C. They should have used fewer values.
D. The test set was used to choose the model, so the reported score is too optimistic. Choose with a validation set or cross-validation, and use the test set once at the end.
Validation set = practice exam (compare and pick models).
Test set = final exam (use ONCE at the very end).
Peeking at the final exam to study makes your score meaningless.
A. 0
B. 1
C. 4
D. 5
Each fold takes one turn as the validation set. The other 4 folds train.
CV score = average of the 5 fold scores.
The test set stays locked the whole time.
Why: one validation set is noisy (like one lucky or unlucky practice exam). Averaging several is more reliable.
Why?
A. To make the forest more interpretable
B. Because CART can't handle many variables
C. Otherwise every tree splits on the strongest variable first and the trees look alike. Different trees make different mistakes, and the vote cancels them out.
D. To make each tree train faster, and that's the only reason
Random forest = 2 sources of randomness:
1. Bootstrap sample: rows drawn WITH replacement (some repeat, about 37% left out)
2. A random subset of variables at each split
Then each tree votes. Majority (or vote share vs. threshold) wins.
Think of it like: asking the audience instead of one friend (wisdom of crowds).
A. Less accurate but more interpretable
B. Identical, just slower
C. More accurate and more interpretable
D. More accurate but less interpretable
Hundreds of trees voting → better predictions.
But you can't draw one simple tree to explain the decision anymore.
Trade-off to remember: accuracy ↑, interpretability ↓.
A. How much would a 10% price cut raise sales?
B. Which movies are similar to each other?
C. What were our sales last quarter?
D. Will this customer churn next month?
3 pillars of business analytics:
Descriptive: What happened? (C)
Predictive: What will happen? (D)
Causal / prescriptive: How do inputs change outcomes? What should we do? (A)
B is clustering, which is descriptive or exploratory.
What is the most likely explanation?
A. The regression has too few variables, so R² is wrong.
B. Price is endogenous: phones with high demand (popular features, buzz) get priced higher. Price isn't set at random.
C. Prices and sales were measured in different units.
D. Customers prefer paying more, so raise prices.
Endogeneity = the X variable is tied to something in the error term (here, unmeasured demand).
OLS then gives a biased, non-causal coefficient.
Class fix: an instrumental variable (the CNY exchange rate) for price.
A. A large sample size
B. Reverse causality
C. Omitted variables
D. Measurement error
The 3 sources:
1. Omitted variables: a hidden factor drives both X and Y
2. Measurement error: X is measured badly
3. Reverse causality: Y causes X
Controls help with omitted variables. IV can fix all three.
Why might experience be endogenous?
A. Experience is measured perfectly.
B. Hospitals are randomly assigned.
C. Surgeons with good outcomes get more referrals, so outcomes drive experience (reverse causality).
D. Outcomes don't vary across surgeons.
"Selective referral": good results → more patients → more experience.
So Y partly causes X, and OLS overstates the effect of experience.
Fix: find an instrument that changes experience but not outcomes directly.
A. Z is random, and Z is correlated with Y
B. Z has a large coefficient, and Z is significant in OLS
C. Z is the outcome, and X is the instrument
D. Relevance: Z moves X. Exclusion: Z affects Y ONLY through X.
Relevance → check it in the data.
Exclusion → you have to ARGUE it (it can't be fully tested).
Think of it like: a domino that only knocks over X, and X is the only thing that knocks over Y.
Which statement best supports the EXCLUSION condition?
A. The exchange rate is significant in the OLS regression.
B. The exchange rate changes production costs (and so price), but it doesn't directly change how much consumers want a phone.
C. Consumers check the exchange rate before buying.
D. The exchange rate is strongly correlated with price.
D is about RELEVANCE (Z moves X), not exclusion.
Exclusion = Z reaches sales only through price.
C would BREAK exclusion.
A. Regress Y on X and keep the residuals
B. Regress Z on Y
C. Regress the endogenous X on the instrument Z, and keep the predicted X
D. Randomly assign X
Stage 1: X ~ Z → keep predicted X (only the part of X driven by Z)
Stage 2: Y ~ predicted X → that coefficient is the causal effect
Smoking example: Stage 1 = CigsPerDay ~ Price. Stage 2 = HealthOutcome ~ predicted CigsPerDay.
A. Years of schooling on earnings
B. Institutions on economic growth
C. TV drug ads on drug sales
D. Distance to hospital on heart attack deaths
Relevance: birthday timing changes how much school a student must finish before they can legally drop out.
Exclusion: birth date has no direct effect on earnings.
Other class IV examples:
Distance to hospital → intensive treatment
Settler mortality → institutions
Political ads → drug ads
Miscarriages → sibling spacing
A. Randomized experiments are never valid.
B. Randomized experiments only work for prices.
C. Smoking data doesn't exist.
D. It would be unethical to force a random group to smoke. RCTs are the gold standard but aren't always possible.
Randomized experiment = gold standard for causal effects (Nobel 2019).
When you can't randomize (smoking, obesity), use natural experiments / IV (Nobel 2021: Angrist & Imbens).
Netflix recommends "Get Shorty" because it has the same director (Barry Sonnenfeld).
Which technique is this?
A. Cross-validation
B. Content filtering
C. Logistic regression
D. Collaborative filtering
Content filtering = uses facts about the ITEM (director, genre, actors).
Collaborative filtering = uses OTHER USERS' ratings ("people like you liked…").
Hybrid = both (what Netflix does).
Think of it like:
Content = "you liked this author, here's their next book."
Collaborative = "your friend with the same taste liked this."
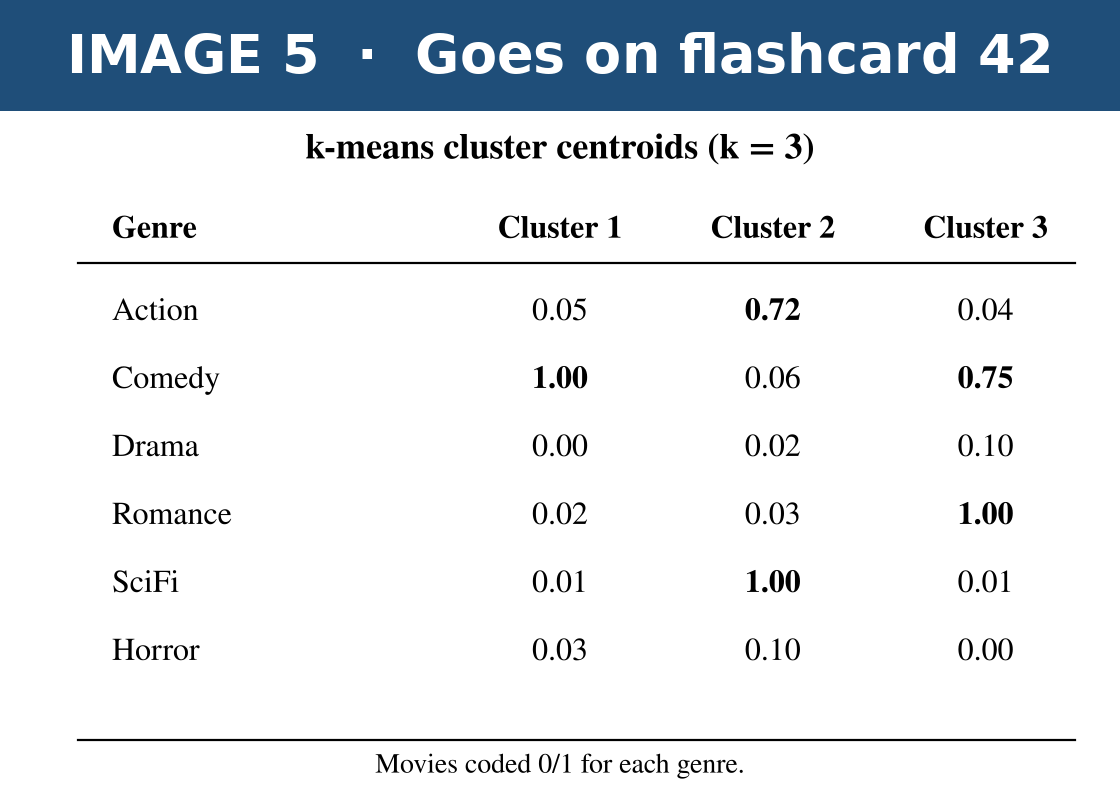
Use the k-means centroid table in the image (movies clustered by genre, values from 0 to 1).
A user loves romantic comedies. Which cluster should you recommend from, and what does Comedy = 0.75 in that cluster mean?
A. Cluster 3, and Comedy is the most important variable in the model B. Cluster 3, and 75% of the movies in Cluster 3 are tagged Comedy C. Cluster 1, and 75% of all comedies are in it D. Cluster 2, and the cluster is 0.75 units from Comedy
Answer: B
Centroid = the "typical movie" of its cluster. With 0/1 genre variables, a centroid value = the share of that cluster's movies in the genre.
Cluster 3: Romance 1.00 + Comedy 0.75 → romantic comedies.
Movie A: Action, Comedy
Movie B: Comedy, Drama, Romance
What is the Euclidean distance between them?
A. 1.41
B. 1.73
C. 3
D. 9
They differ in 3 genres (Action, Drama, Romance).
Distance = √(1 + 1 + 1) = √3 ≈ 1.73
With 0/1 data, distance = √(number of genres where they differ).
Smaller distance = more similar.
A. It's unsupervised: it groups observations by similarity (distance) without using an outcome variable.
B. It needs a dependent variable (y) to train.
C. It automatically picks the best k.
D. It always finds the same clusters no matter where it starts.
No y → unsupervised learning.
D is false: random starts can give different clusters.
→ Fix: run several starts and keep the best (KMeans(n_init=10)).
C is false: you choose k (from experience or experimentation).
1. Choose k
2. Randomly assign points to clusters
3. Compute centroids
4. Reassign each point to the closest centroid
What comes next?
A. Delete the smallest cluster.
B. Stop. The clusters are final.
C. Add a dependent variable.
D. Recompute the centroids, then repeat steps 4–5 until nothing improves.
k-means loops: reassign → recompute centroids → reassign … until the assignments stop changing.
Think of it like: friends at a party drifting to the closest group, while each group's "center" shifts as people move.
A. It found the shortest road route between restaurants.
B. It predicted each driver's rating.
C. It clustered Uber pickup locations, and the cluster centers marked high-traffic spots to place food trucks. Clusters were ranked by pickup volume.
D. It ran a randomized experiment on taco prices.
Cluster centers = spots that minimize distance to many pickups.
Limitation from the reading: k-means uses straight-line (Euclidean) distance, not real road distance.
+1 for 2–6
0 for 7–9
−1 for 10, J, Q, K, A
Cards seen: 5, K, 3, 9, A, 2, 6
What's the running count, and what should you do?
A. +2, so bet bigger (more high cards are left in the deck)
B. −2, so bet smaller
C. +2, so bet smaller
D. 0, so leave the table
5(+1) K(−1) 3(+1) 9(0) A(−1) 2(+1) 6(+1) = +2
High count = lots of low cards already gone → the remaining deck is rich in 10s and Aces → better for the player.
High count → bet big. Low count → bet small.
A. Blackjack has fewer players.
B. Roulette is illegal to analyze.
C. Blackjack dealers make more mistakes.
D. Conditional probability: cards already dealt change what's left in the deck, so the odds shift. Roulette spins are independent.
Past cards → information about future cards.
Thorp: developed with probability theory, CONFIRMED with simulation, validated in casinos.
Key lesson: the edge is small, so you need lots of money and a long-term view.
A. Card counting at the racetrack
B. Insider tips from jockeys
C. A statistical model (multinomial logit) built on years of race data. He bet when the model's probabilities beat the public betting odds.
D. Betting on every race equally
He started as a blackjack card counter inspired by Thorp's "Beat the Dealer."
Then he moved to Hong Kong horse racing and used data and probability instead of gut feel.
Same theme as Blackjack: a small edge + data + patience.
A. A random forest
B. Logistic regression (weights = coefficients, bias = intercept, weighted sum = logit)
C. k-means clustering
D. Linear regression
Same model, different names:
weights → coefficients
bias → intercept
weighted sum z → logit (log-odds)
sigmoid → logistic function
Neural network = many of these stacked in layers ("deep" = more hidden layers).
bias = −0.5
weights = 1.0 and 2.0
inputs = 0.5 and 0.25
What is its output?
(sigmoid(z) = 1 / (1 + e^−z))
A. 0.38
B. 0.50
C. 0.62
D. 0.73
z = −0.5 + 1.0(0.5) + 2.0(0.25) = 0.5
sigmoid(0.5) = 0.62
A is the sign mistake. B = sigmoid(0), meaning you forgot the inputs.
What happened, and what's the fix?
A. Overfitting (memorizing). Stop training when accuracy on held-out photos stops improving, chosen by cross-validation.
B. The test photos are mislabeled.
C. Use a bigger learning rate.
D. Underfitting. Train for more epochs.
1 epoch = one pass through all the training data.
Too many epochs → memorization.
Same idea as a tree with too-small min_samples_leaf.
A. A small filter slides across the photo looking for one pattern (like an edge), so it keeps track of which pixels are neighbors.
B. It uses no weights.
C. It can only read text.
D. It turns the photo into one long list of pixels.
Basic network: photo → one long list → neighbor info is lost.
CNN: filters scan patches → feature maps → layers of filters build bigger patterns.
Think of it like: scanning a page with a magnifying glass for one shape at a ti