psychstasts terminology
 Call Kai
 Learn
 Practice Test
 Spaced Repetition
 Match
 Flashcards
 Knowt Play
1/35

There's no tags or description
Looks like no tags are added yet.
36 Terms
any specific collection of objects of interest.
population
any subset of a larger set of data – to draw inferences about
the larger set called the population
sample
is a collection of methods for collecting, displaying, analyzing,
and drawing conclusions from data.
statistics
is the branch of statistics that involves organizing,
displaying, and describing data.
descriptive statistics
- is the branch of statistics that involves
drawing conclusions about a population based on information
contained in a sample taken from that population.
inferential statistics
data that can take any value. Height,
weight, temperature and length are all examples of data that
will change over time;
continuous data
data that can only take certain or fixed values.
discrete values
are properties or characteristics of some event, object, or person
that can take on different values or amounts.
Variables
the variable the experimenter changes or
controls and is assumed to have a direct effect on the dependent
variable or the “predictor”
Independent variable
predicted variable or measured variable
Dependent variable
Scales or Level of Measurement of Data
Nominal Scale,Ordinal Scale,Interval Scale,Ratio Scale
is an explicit listing of all the individual measurements, either
as display with space between the individual measurements, or in set
notation with individual measurements separated by commas.
Data list
a table in which each distinct value x is listed in
the first row and its frequency (f)
Data frequency table
-is a method of organizing raw data in a compact form by displaying a
series of scores in ascending or descending order,
Frequency Distribution Table
or typical value for a probability distribution. It
may also be called a center or location of the distribution. (You can think
of it as the tendency of data to cluster around a middle value.)
central tendency
The three measures of central tendency
mean, median and mode.
The Mean (x̅) - arithmetic average

The Median ( x̃ )- positional average.
the middlemost value in the data set. It is found midway between the
highest and the lowest value in a rank order distribution and divides
the distribution into two equal parts

Mode

It is quite possible to have two sets of observations with the
same mean or median, but may not describe the behavior of
whole data. It differs in the amount of spread about the mean. So
measures of variability describe how the values are scattered or
clustered about the typical value which is the mean.
MEASURES OF VARIABILITY
- the simplest measure of variability. It is the difference
between the largest value and the smallest value.
Range (R)

Average Deviation (AD) or Mean Deviation
the dispersion of a set of data about the average.

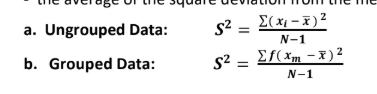
the average of the square deviation from the mean.
Variance of Grouped Data (S2)
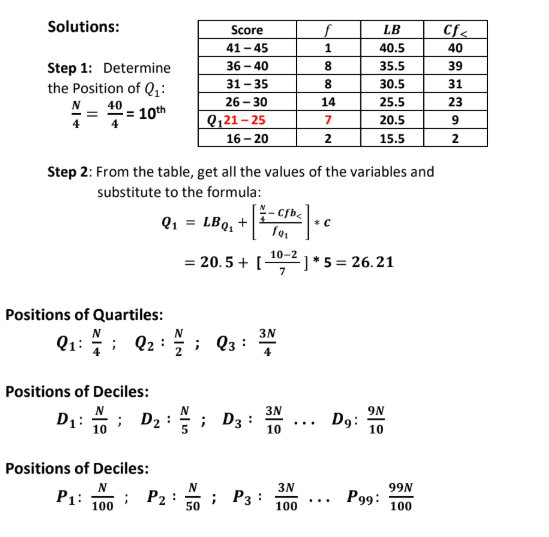
The value that divides a set of data into equal parts. Specifically,
quantiles which divide the data into:
Quantiles
- is a degree of asymmetry observed in a probability distribution
that deviates from the symmetrical normal distribution (bell curve) in a given set
of data.
Skewness
– is the peakedness of the curve. Kurtosis refers to the degree of
presence of outliers in the distribution.
Kurtosis
is a degree of asymmetry observed in a probability distribution
that deviates from the symmetrical normal distribution (bell curve) in a given set
of data.
Skewness
describes the position of a raw score in terms of its
distance from the mean, when measured in standard deviation units.
z-score

The z-score is positive if the value lies above the mean, and negative if it lies
below the mean. It is also known as a
standard score