Stats Final
 Call Kai
 Learn
 Practice Test
 Spaced Repetition
 Match
 Flashcards
 Knowt Play
1/100

There's no tags or description
Looks like no tags are added yet.
101 Terms
What are the units for z score
This is measured in unites of standard deviation.
What does a z score of +0.5 mean
This means that the observation lies ½ standard deviation above the mean
Z-score formula for a population
(X-μ)/σ
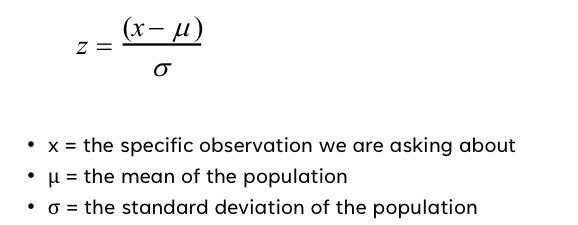
Z-score for a sample
(Χ - X̄)/s

What does pnorm()/p-values table give us
Area under the curve to the LEFT of the z-score
Using pnorm()/p-vlaue table, how to find area under the curve to the right of Z
1 - pnorm(z)
What is qnorm()/q-values table
Converts area under the curve (as a decimal) to a z-score
qnorm(0.975) returns 1.96. What does this mean?
1.96 is the z-score with 97.5% of values below it
What is a statistic
Measurement that comes from a sample
What is a parameter
A measurement about the whole population
Percentile
Value at which X percent of observations fall below it numerically
1st quartile
25th percentile
About 25% of observations fall below numerically
2nd quartile
50th percentile/median
About 50% of observations fall below numerically
3rd quartile
75th percentile
About 75% of observations fall below numerically
What is standard deviation
Provides a numerical measure of the overall amount of variance in the data set
What does a smaller (closer to 0) standard deviation mean
Data are all concentrated close to the mean when this is small (closer to 0)
What does N(7, 2.44) mean
Distribution is normal
Mean is 7
Standard deviation is 2.44.

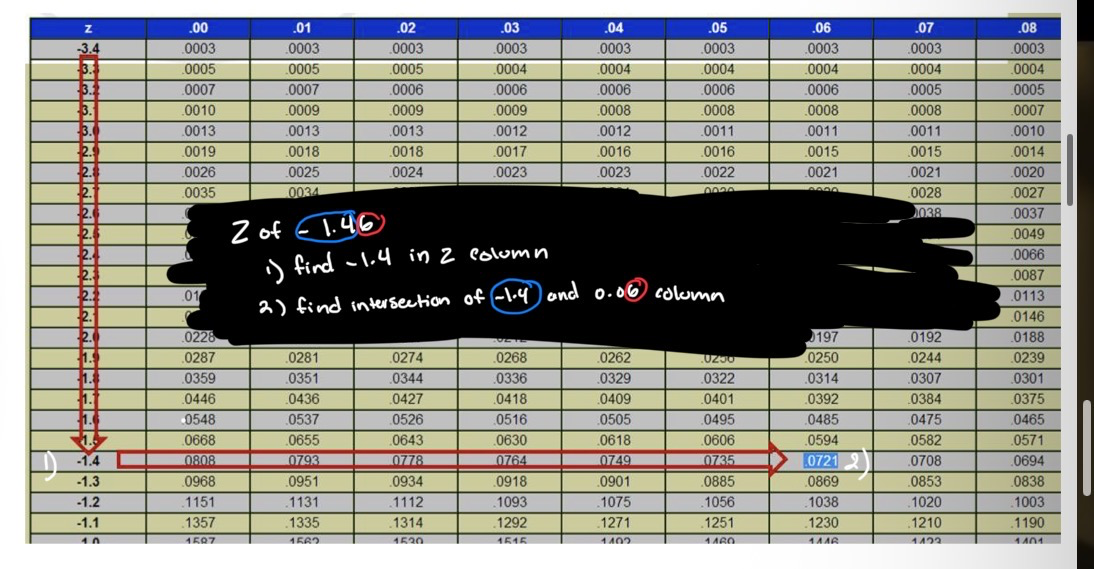
How to use z-score table
Start with the column and sing the value for the first 2 digits of the score
Go to the .0X column that corresponds to the last dight of a z-score
What is the empirical rule for normal distributions
Area between ±1 standard deviation is about 68% of observations
Area between ±2 is abut 95% of observations
Area between ±3 is about 99.7 of observations
can only be used with integers between ±3

What is chebyshev’s therorem
for non-normal distributions!
At least 75% of observations lie within 2 standard deviations (±2)
At least 89% of observations lie within 3 standard deviations (±3)
What is the difference between the empirical rule and chebyshev’s theorem

Randomness
outcome of an individual event is uncertain
When does the term ‘expected outcome’ apply for random phenomena?
applies to a large series of repetitions
For example, the probability of flipping a heads is almost exactly 50% given a large number of coin flips.
Sum of probabilities add up to…
100% or 1
If you flip a coin 10 times, can you safely expect to get 5 heads and 5 tails?
No!
You can only expect to get values close to 50% heads and 50% tails, AKA the expected outcome, if you flip the coin over a large series of repetitions.
If you roll a die, how often would you expect to get a 4?
1 in 6 times.
Suppose you roll the die six times, Can you safely assume that you will see a 4 one and only one time?
No! You can only expect to see the 4 show up exactly1/6 times over many rolls of the die.
If we rolled the die 10,000 times, we could expect to see a 4 show up almost exactly 1/6 of the time
What is the probability of rolling a die and getting a 6 if on the previous
roll you got a 1?
1/6. Rolls have no impact of subsequent event
Sample Space
set of all possible outcomes of an event
What is the sample space for the number of heads in three flips of the coin?
S(Number of Heads in 3 coin flips) = {0, 1, 2, 3}
What notation is used for discreate sample spaces?
braces {}
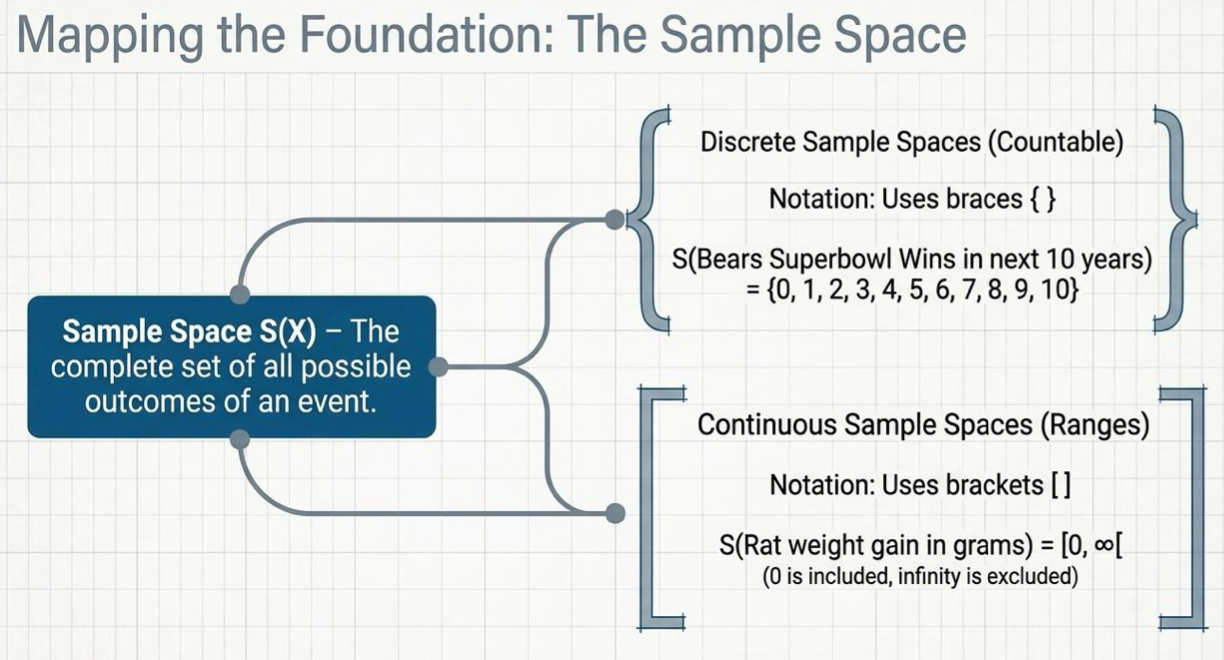
What notation is used for discreate sample spaces?
brackets []
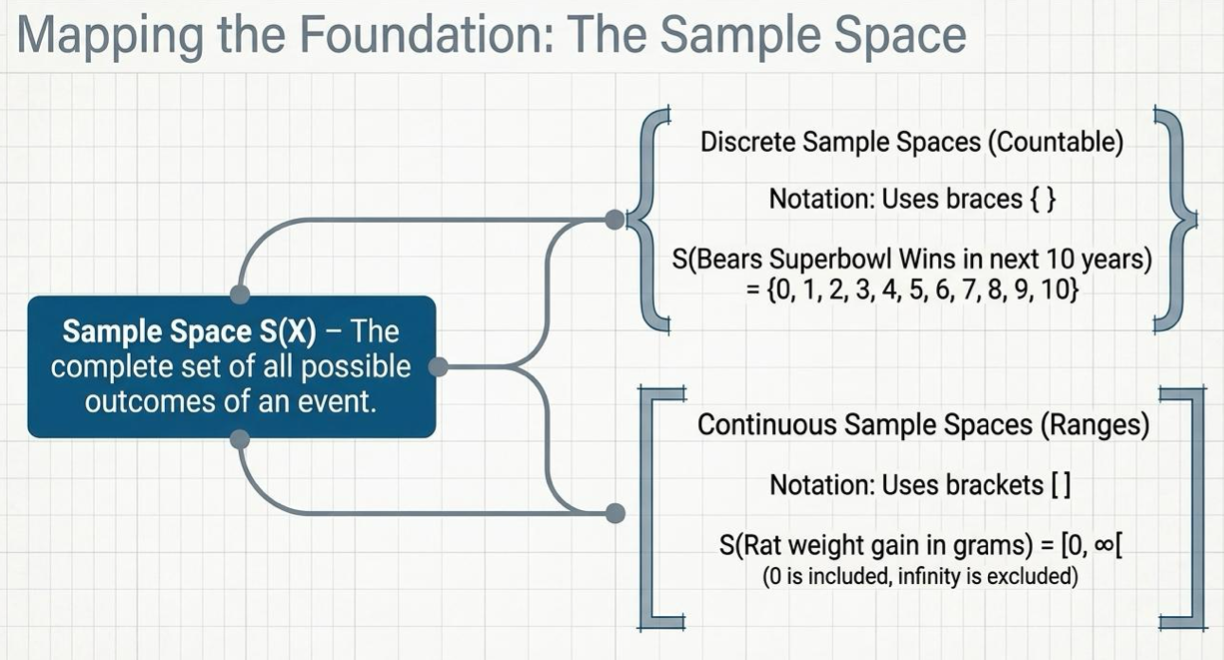
Discrete Sample Space
consists of distinct, separate values that can be counted. These values are either finite (a set limit) or countably infinite (can be listed one by one like whole numbers), with clear gaps between possible outcomes
Defective items: Counting the exact number of broken lightbulbs in a factory shipment of 100 boxes.
Number of pets: A household can have 0, 1, 2, or 3 pets, but never 1.5 pets
How does conditional probability impact the sample space?
reduces the sample space
Outcome
result of an experiment
Event
any combination of outcomes; a list of particular outcomes we are interested in
subset of the sample space
Continuous sample space
consists of an uncountably infinite number of possible values within a given interval or range. Because outcomes are measured on an unbroken scale, there are no gaps between numbers, and there is always another possible value between any two points
Human Height: A person's height can be 170 cm, 170.5 cm, or 170.542 cm, limited only by the precision of the measuring tape
Waiting Time: The exact time you wait for a bus can be any real number between 0 and 15 minutes, such as 4.38 minutes
Temperature: The outdoor temperature over a day moves smoothly through every decimal value between 10 C and 25 C
What is the notation for determining probability?
P(event)

Sample Space Notation
S(event) = []
S(event) = {}

Sample Space, Probability, Event Notation Examples
If I roll a single die what is the probability that I will roll a 1?
Let X = the outcome of the roll
S(X) = {1, 2, 3, 4, 5, 6}
Event = {1}
What is P(X=1)?

Probability Model
mathematical description of all possible outcomes of a random process
What does a probability model consist go
The sample space
The probability for every possible outcome in the sample space

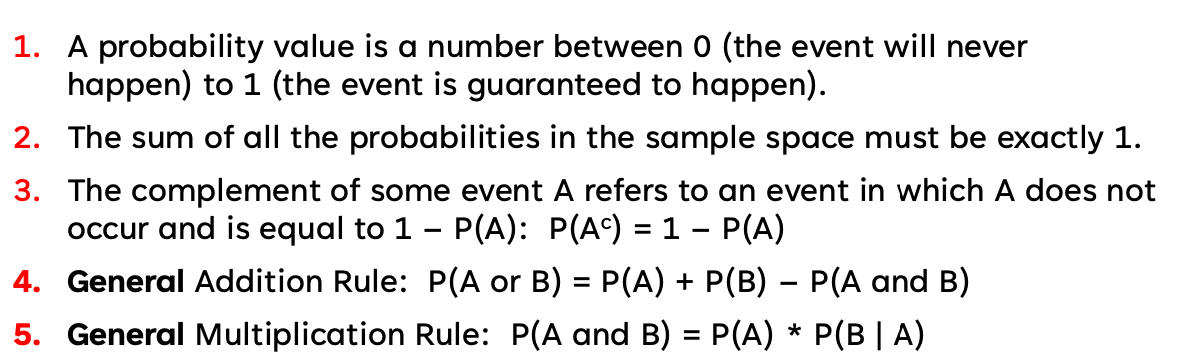
What are the probability rules
A probability is a number between 0 (the event will never happen) to 1 (the event is guaranteed to happen).
0<=P(X)<=1
The sum of all of the probabilities in the sample space must be exactly 1.
General Addition Rule: P(A or B) = P(A) + P(B) – P(A and B)
If two events A and B are disjoint, then the probability that event A occurs OR event B occurs is the sum of their individual probabilities
General Multiplication Rule: P(A and B) = P(A) * P(B | A)
The probability of some event A occurring AND another event B occurring is the product of their individual probabilities
The probability of an event not occurring equals 1 minus the probability that is does occur
Disjoint Event
once one event in the sample space occurs, no other event can have taken place
AKA mutually exclusive
Ex: A coin is flipped. What is the probability of getting a heads or a tails?
What kind of events are mutually exclusive
disjoint events
What is the probability of disjoint events occuring at the same time?
P(A ∩ B) or P (A AND B) = 0
Non-Disjoint Events
If two (or more) events are non-disjoint, this means that it is possible for both (or more) events to be true AKA overlapping
Ex: A die is rolled. What is the probability of rolling a 4 or an even number?
The addition rule applies to what kind of events
disjoint events
The addition rule for disjoint events
probability of A happening OR the probability of B happening is simply equal to the sum of the two probabilities

Do disjoint events share outcomes
no
Does the addition rule apply to AND events, OR events, or both?
Or events
Complement of an event
complement of some event A refers to an event in which A does not occur

Difference between establishing probabilities theoretically and empirically
Theoretical: Based on a theoretical understanding of the event
Empirical: look at data. In other words, we are deriving our probabilities based on data from previous events
What kind of events does the multiplication rule apply to
independent events
The multiplication rule
probability of some event A occurring AND another event B occurring is the product of their individual probabilities

Independent Events
independent if the particular outcome of one event does not affect the probability of the outcomes of the other event
ex: Event A is that it will rain today. Event B is that today is a Tuesday. These events are independent. Whether or not it rains today will have no bearing on whether it is a Tuesday.
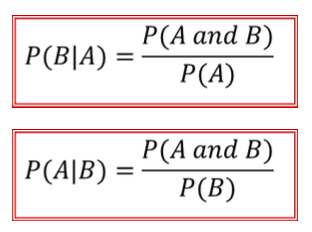
What does P(A|B) mean
probability that event A will occur given that the event B has already occurred
In order to prove events are independent…
must show only one of the conditions is true:
P(A|B) = P(A)
P(B|A) = P(B)
P(A AND B) = P(A)P(B)
T o F: If two events are NOT independent, then we say that they are dependent events
True!
Dependent Events
outcome of one event does affect (i.e., change) the probability of the other event
ex: Event A is that it is raining outside. Event B is that the month is April. These events are not independent. If we know the month is April, this does affect the probability that it is raining.
How does replacement impact dependent events?
With replacement: If each member of a population is replaced after it is picked, then that member has the possibility of being chosen more than once. When sampling is done with replacement, then events are considered to be independent, meaning the result of the {rst pick will not change the probabilities for the second pick.
Without replacement: When sampling is done without replacement, each member of a population may be chosen only once. In this case, the probabilities for the second pick are azected by the result of the {rst pick. The events are considered to be dependent or not independent.
Are disjoint events dependent? Why or why not?
Yes!
For dependent events, the outcome of one impacts the probability of the other. Since disjoint events cannot occur simultaneously, if one happens, the probability of the other is immediately 0

Are disjoint events independent? Why or why not?
Never!
Since disjoint events cannot occur simultaneously, if one happens, the probability of the other is immediately 0. However, the opposite occurs for independent events. Probabilites aren’t impacted by events occurring.

The general addition rule
P(A or B) = P(A) + P(B) – P(A and B)
When to use the general addition rule
Techiniccally used for both disjoint and non-joint, but automatically used for non-disjoint events
P(A and B) = 0 for disjoint
The general multiplication rule

When to use the general multiplication rule
Techiniccally used for both independent and dependent, but automatically used for dependent events
P(B|A) = P(B) for independent
Is P(B|A) the same as P(A|B}
No!

Conditional Probability
conditional probability of A given B is written P(A|B). P(A|B) is the probability that event A will occur given that the event B has already occurred
How does a conditional probability impact the sample space
it reduces the sample space
What is the formula for conditional probability
Conditional probability for 3 events
P(I and M and A) = P(I) P(M | I) P(A | I and M)

OR probability for 3 events

If we don’t know whether events are dependent or indepent, assume:
they are dependent until you can show otherwise
Another name for a non-discrete space
continuous interval/space
How do we assign probabilities to a continuous sample space
density curves to compute the probabilities for intervals
How is a density curve used to determine probabilities for continuous random variables
probability of an event in which the outcomes are continuous is the area under the density curve for the values of X that make up the event

What is the probability for a single event, such as X = 720, for a continuous variable
0! only intervals can have a non-zerp probability. as we approach a single event, the area approaches 0
For continuous variables, what can have a non-zero probability and what has a 0 probability?
non-zero: intervals only
always 0: single event
Formula for mean of a discrete random variable
μX = x1p1 +x2p2 +x3p3 +....Xkpk

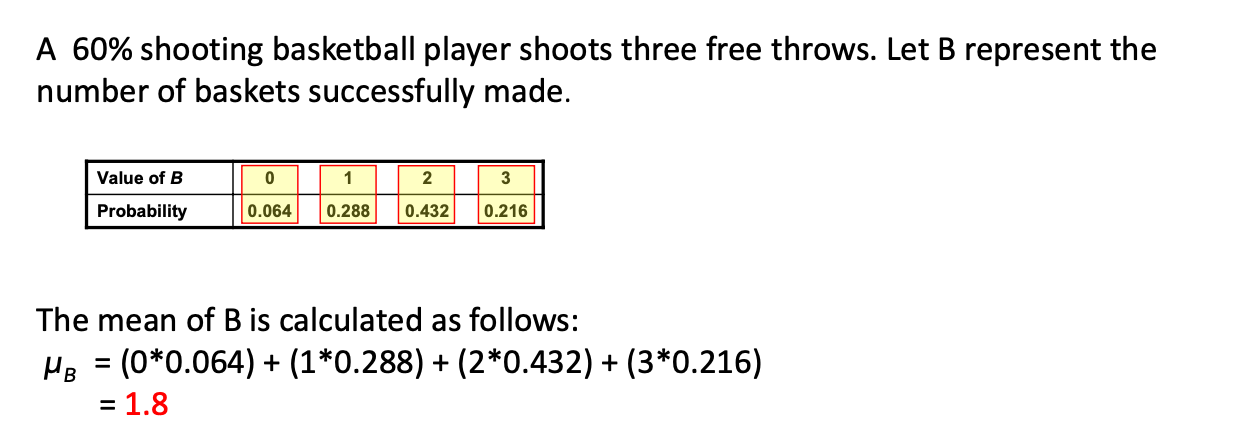
What does the mean tell us for this problem?
out of 3 throws, in the long run, this player would, on average make 1.8 baskets
Expected Value
mean of a random variable X
How to determine the mean of a symmetric curve for a continuous random variabe=le
the mean lines at the center
Formula for standard deviation of a discrete random variable
sqrt[σ2 = (x1-μx)2p1 + (x2-μx)2p2 + (x3-μx)2p3 + .... + (xk-μx)2pk]

Inferance vs Extrapolation
Inference: deduce something from existing evidence; taking information from a sample and using it to draw conclusions about the population
extrapolation: extend or project known data into an unknown or future range
Sampling Variability
Every time we take a random sample, we are going to get a different set of observations, and therefore, will obtain a different value
Point estimate
a single number computed from a sample and used to estimate a population parameter
The sample mean is the point estimate for the population mean
The sample standard deviation is the point estimate for the population standard deviation
Our estimate of the population is only as good as our
sampling design
If take many random samples (of the same size) from a given population and record the relevant statistic each time, what is the shape of the distribution?
Normal!
Note: this doesn’t apply to all statistics. Is a general concept
Sample distribution of sample means
refers to the distribution we would find if were to take many samples and calculate the mean of each sample

Central Limit Theorem
For a sufficiently large sample size (n ≥ 30), the sample distribution of the sample means will be approximately normal, regarless of the population’s original shape
What must be true for the central limit theorem to apply?
Each sample is a simple random sample, with observations independent from one another
Sample size is sufficiently large
Central limit theorem: what is the mean of the sampling distribution of sample means
approximately equal to the population mean
Central limit theorem: what is the standard deviation of the sampling distribution of sample means
σ / √n
The fact that the sampling distribution of sample means is approximately normal allows us to use which tools?
confidence intervals
hypothesis testing
What kind of data is needed to use hypothesis testing?
normally distributed data
What kind of data is needed to use confidence intervals?
normally distributed data
What is the mean of a sampling distribution?
if samples are unbiased, the mean of the sampling distribution should closely approach the mean of the population

What is the standard deviation of the sampling distribution?
standard deviation of the population divided by the square root of ‘n’
AKA standard error

Standard error
standard deviation of a sample statistic's sampling distribution