Principles of Effective Data Visualization
 Call Kai
 Learn
 Practice Test
 Spaced Repetition
 Match
 Flashcards
1/24

Earn XP
Description and Tags
Vocabulary flashcards covering core concepts of data visualization design principles, Gestalt laws, preattentive visual attributes, and chart types.
25 Terms
Data Visualization
A multidisciplinary practice combining art and science to convert raw data into comprehensible visual formats, helping people identify patterns, trends, and correlations to turn data into information and knowledge.
Simplicity and Minimalism
A foundational design principle that requires distinguishing meaningful insights from irrelevant noise, eliminating distractions and choosing the simplest visual form to communicate data without cognitive overload.
Honesty and Veracity
A visual design principle requiring absolute integrity and fidelity to the underlying data and research, avoiding distortions, misleading scales, or deceptive manipulations.
Visual Hierarchy
The deliberate arrangement of visual attributes—such as size, intense color, and upper-left positioning—to intuitively guide the viewer's gaze toward the most important elements first.
Gestalt Psychology
A psychological theory stating that the human brain does not perceive visual stimuli as isolated fragments, but naturally groups them into a structured, coherent whole.
Principle of Grouping (Similarity and Proximity)
A Gestalt law stating that elements sharing visual characteristics (such as color, size, or shape) or spatial closeness are perceived by the brain as belonging to the same category or unit.
Principle of Enclosure (Cerramiento)
A Gestalt principle where visual boundaries, borders, or shaded backgrounds enclose items, leading the brain to interpret them as an integrated, distinct entity.
Principle of Connection
A Gestalt concept stating that visual elements physically linked by a line are perceived as having a much stronger relationship than elements that are merely adjacent.
Preattentive Attributes
Visual properties—such as length, height, color, shape, and texture—that the human brain processes almost instantaneously and without conscious mental effort.
Length and Height
Preattentive attributes that offer the highest perceptual accuracy for quantitative comparison, making rectangular bar charts an effective choice for comparing values.
Qualitative Color Palette
A color scheme used for categorical data where distinct, maximally contrasting hues are chosen to differentiate independent, non-ordered groups.
Sequential Color Scale
A quantitative color gradient that changes smoothly in lightness or saturation to represent numerical values ordered from low to high.
Diverging Color Scale
A two-directional color scale used for quantitative data to highlight variations that deviate positively and negatively from a meaningful central reference point.
Accent Color
A technique where a bright or prominent color highlights a key data point or category, while remaining elements are rendered in neutral tones to prevent visual distraction.
Textures and Patterns
Visual fills used to complement or replace categorical colors, ensuring clarity in black-and-white printouts and improving visual accessibility.
Bar Chart
A chart type designed to compare quantities across discrete, non-continuous categories, where the length or height of each bar is proportional to its value.
Zero-Baseline Rule
The design requirement that the quantitative axis of a bar chart must start at 0, ensuring bar lengths are directly proportional to their values and preventing misleading exaggeration.
Histogram
A chart displaying the distribution of a continuous variable by grouping values into adjacent bins, with bar heights showing the frequency of observations in each interval.
Bin Width (Bin Size)
The interval size chosen to group continuous numerical data in a histogram, which directly affects the visual shape, resolution, and interpretation of the distribution.
Box Plot
A standardized chart summarizing the distribution of continuous numerical data using five key statistics: minimum (Q1−1.5×IQR), first quartile (Q1), median, third quartile (Q3), and maximum (Q3+1.5×IQR), along with outliers.

Interquartile Range (IQR)
The statistical range between the 25th percentile (Q1) and the 75th percentile (Q3), representing the middle 50% of a dataset in a box plot.
Outlier
An observation plotted as an individual point beyond the whiskers of a box plot, falling below Q1−1.5×IQR or above Q3+1.5×IQR.
Scatter Plot
A visualization that reveals the relationship or correlation between two continuous variables by plotting each observation as a point defined by its X and Y coordinates.
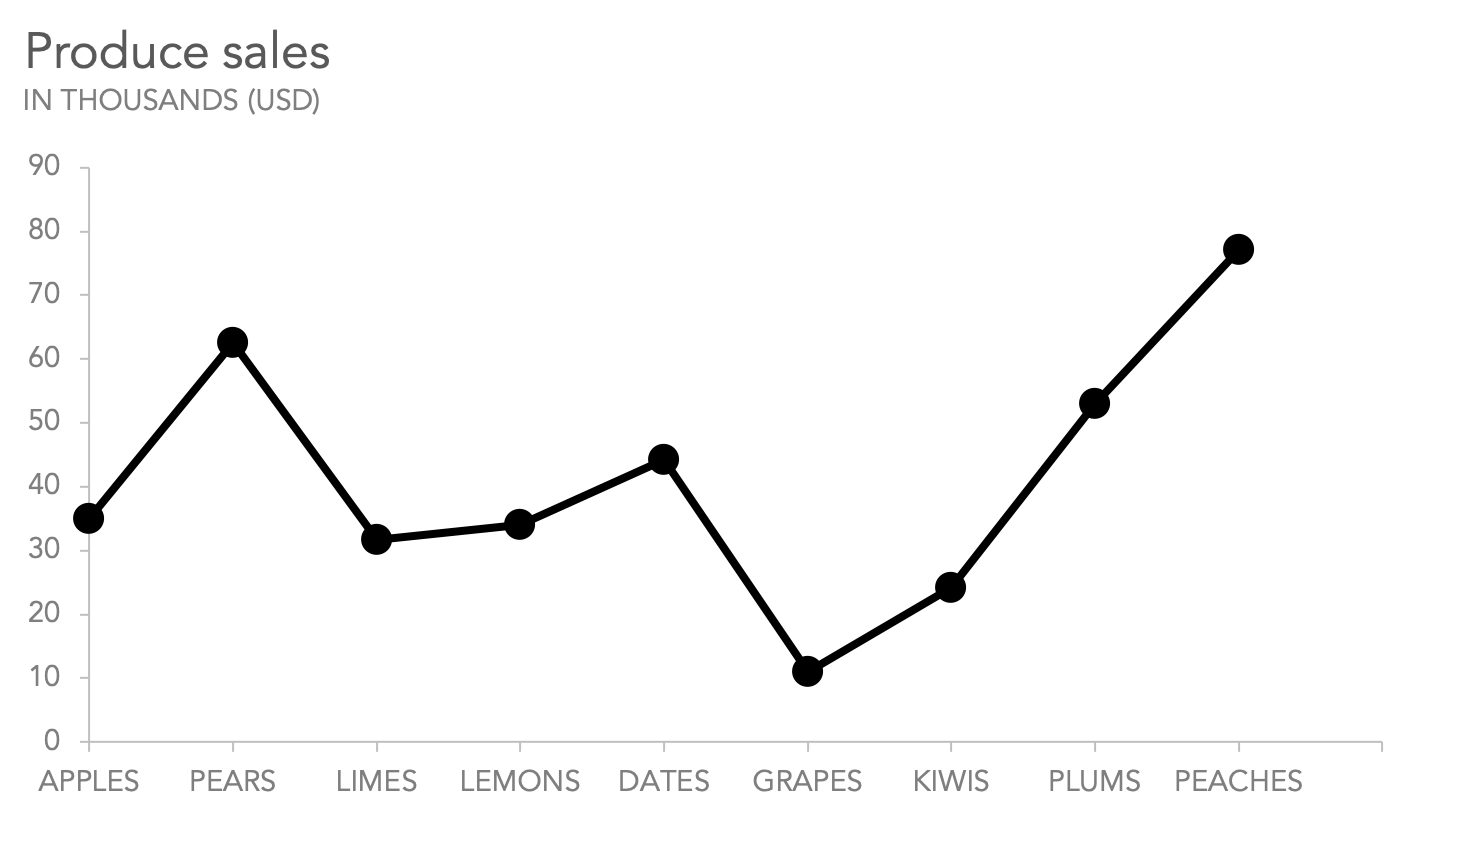
Line Graph
A chart that connects consecutive data points with lines, used to display trends, trajectories, and rate changes across a continuous or ordinal variable, typically time.
Pie Chart
A circular chart divided into slices to display proportions of a whole, effective only with very few categories (2 to 5) because human perception assesses angles and areas less accurately than length.