fundamentals of receptor pharmacology - week 4
 Call Kai
 Learn
 Practice Test
 Spaced Repetition
 Match
 Flashcards
 Knowt Play
1/27

There's no tags or description
Looks like no tags are added yet.
28 Terms
What is pharmacodynamics, and how do receptors work?
Pharmacodynamics describes what a drug does to the body. Receptors recognise ligands (such as drugs) and convert binding into cellular responses. Signal amplification means a small number of activated receptors can produce a large effect.
Key terms:
Ligands: Substances that bind to receptors.
Cellular response: A change or reaction within a cell.
Signal amplification: When a small signal produces a much larger response.
How do drugs bind to receptors, and what determines how long they stay bound?
Drug–receptor binding is usually reversible, meaning drugs can attach to and detach from receptors.
Binding occurs through forces such as ionic interactions, hydrogen bonding and van der Waals forces.
Covalent binding is generally less reversible.
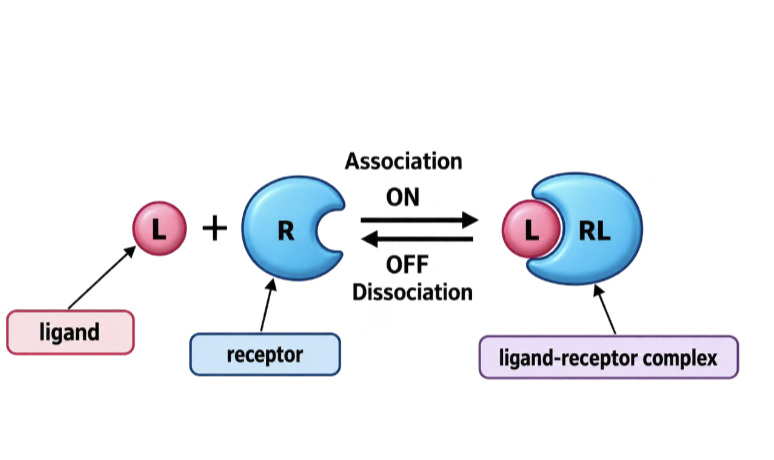
Association = drug binds to receptor.
Dissociation = drug separates from receptor.
Key terms:
Ionic interactions: Attractions between oppositely charged particles.
Hydrogen bonding: A weak attraction involving hydrogen atoms.
Van der Waals forces: Weak attractions between molecules or atoms.
Covalent binding: Atoms are joined by sharing electrons.

What is the law of mass action in drug–receptor binding?
Drug binding to receptors follows the law of mass action:
Ligand + Receptor ⇌ Ligand–Receptor Complex
Binding depends on the concentrations of ligands and receptors.
Increasing ligand concentration generally increases receptor occupancy.
At equilibrium, the rates of association and dissociation are equal.
A binding curve shows how many receptors are occupied, NOT the physiological effect.
Key terms:
Ligand: A substance that binds to a receptor.
Receptor occupancy: The proportion of receptors occupied by ligands.
Complex: The ligand and receptor joined together.
Equilibrium: A state where association and dissociation happen at equal rates.
Binding curve: A graph showing receptor occupancy as ligand concentration increases.
What are Kd and Ka, and how do they describe drug–receptor affinity?
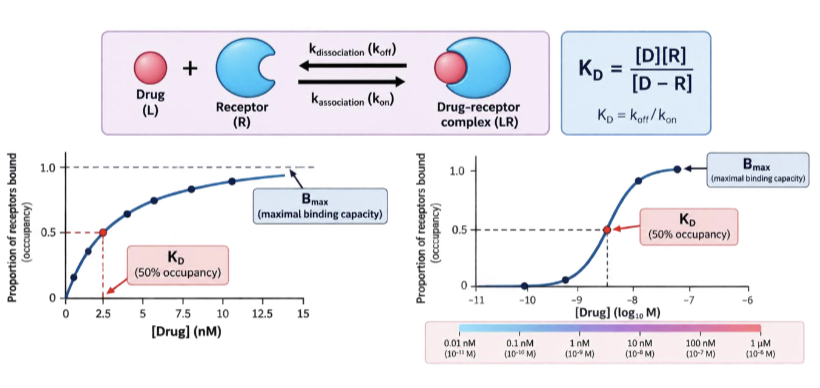
Kd (dissociation constant): The ligand concentration needed to occupy 50% of receptors (for simple one-site binding).
A lower Kd = higher affinity, meaning the drug binds more strongly to the receptor.
Ka (association constant): The inverse of Kd (Ka = 1/Kd).
A higher Ka = higher affinity, meaning stronger binding
Key terms:
Kd: Measures how easily a drug–receptor complex dissociates.
Ka: Measures the tendency of a drug to associate with a receptor.
Affinity: How strongly a drug binds to a receptor.
Ligand: A substance that binds to a receptor.
Occupancy: The percentage of receptors occupied by a drug.
Equilibrium dissociation constant: A measure of the balance between bound and unbound drug at equilibrium.

How is drug–receptor affinity measured using a radioligand binding assay?
A radioligand binding assay measures how much of a radioactive drug (ligand) binds to receptors on a cell's surface.
Bmax: The maximum number of receptors available for binding.
Kd: The ligand concentration needed to occupy 50% of receptors.
As drug concentration increases, receptor occupancy increases until receptors become saturated (all available binding sites are occupied).
The assay can estimate both Bmax and Kd.
Key terms:
Radioligand: A ligand labelled with a radioactive substance so it can be detected.
Radioligand binding assay: A test used to measure how much drug binds to receptors.
Bmax: Maximum receptor binding capacity.
Kd: Dissociation constant; helps measure drug–receptor affinity.
Receptor occupancy: The percentage of receptors occupied by a drug.
Saturated: When all available receptor binding sites are occupied.

How does the shape of a drug–receptor binding curve change on linear vs semi-log concentration axes?
Linear concentration axis: Binding produces a hyperbolic (curved) shape.
Log concentration axis: The same data produces a sigmoidal (S-shaped) curve.
Kd: Corresponds to 50% receptor occupancy, NOT 50% clinical response.
Key terms:
Linear axis: Concentrations increase by equal amounts (e.g. 1, 2, 3, 4).
Semi-log axis: Concentration is plotted on a logarithmic scale (e.g. 1, 10, 100, 1000).
Hyperbolic: A curve that rises quickly then gradually levels off.
Sigmoidal: An S-shaped curve.
Receptor occupancy: The percentage of receptors occupied by a drug.
Kd: The concentration of ligand needed to occupy 50% of receptors.
Plateau: The point where binding stops increasing significantly because receptors are saturated.
Affinity: interpreting shifted binding curves
A left-shifted binding curve corresponds to
lower Kd and higher affinity.A right-shifted binding curve corresponds to
higher Kd and lower affinity.Do not conclude that higher affinity always
means greater maximum clinical effect.

Binding is not activation
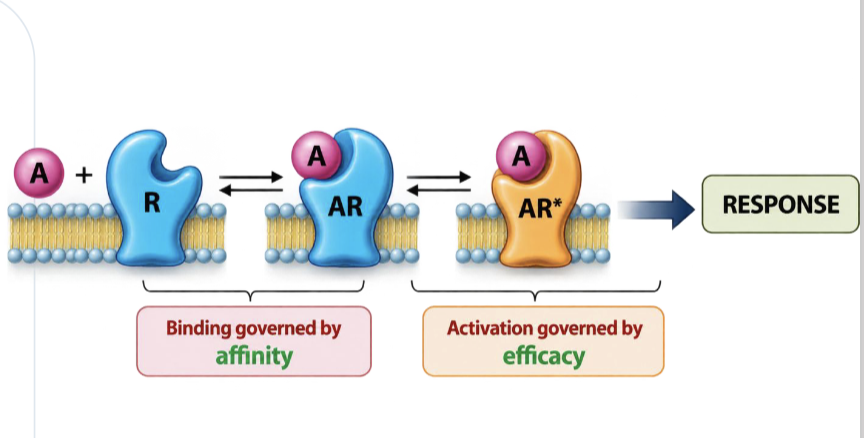
Affinity describes binding, while efficacy
refers to activation and resultant response.A neutral antagonist may bind strongly but
have no activating effect.An agonist binds and then activates receptor
signalling.
Agonists have affinity and efficacy
A full agonist can elicit a maximal system
response.A partial agonist has lower maximal
response in the same receptor system.Do not mistake a lower-dose drug for a
stronger maximum response.

Reading a concentration–response curve
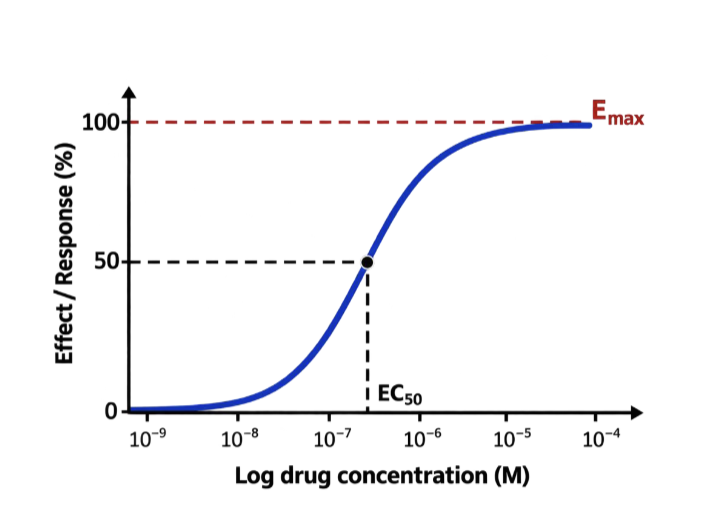
X-axis: concentration (often plotted
logarithmically).Y-axis: effect / response, usually as a
percentage of reference maximum.The plateau represents Emax; the midpoint
helps identify EC50.

Why response curves matter
Compare maximum responses (efficacy).
Compare concentrations needed for a
chosen response (potency).Identify biological variation, safety limits and
unusual antagonism patterns.
Emax vs EC50: avoid mixing them up
Emax is the largest measured effect under
specified conditions.EC50 is the concentration producing 50% of
that drug’s maximal response.Smaller EC50 = greater potency when
comparing curves under comparable
conditions
Efficacy: how high does the response go?
Efficacy is compared using the maximum
response in the same test system.A partial agonist has a lower maximum than
a full agonist acting at the same receptor.Low Emax does not, by itself, imply low
affinity.
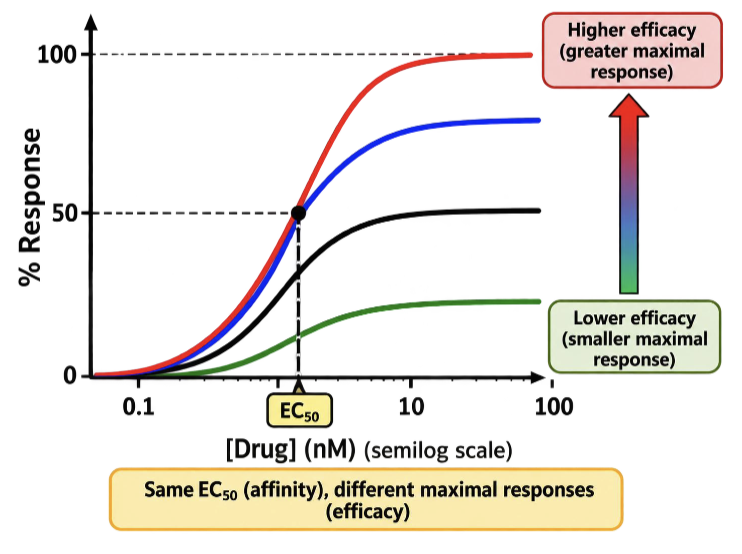
Full agonists versus partial agonists
Full agonist: produces the full maximal
response available in the system.Partial agonist: produces a smaller maximal
response, even at saturating concentrations.Receptor reserve and downstream signalling
may influence apparent maxima.
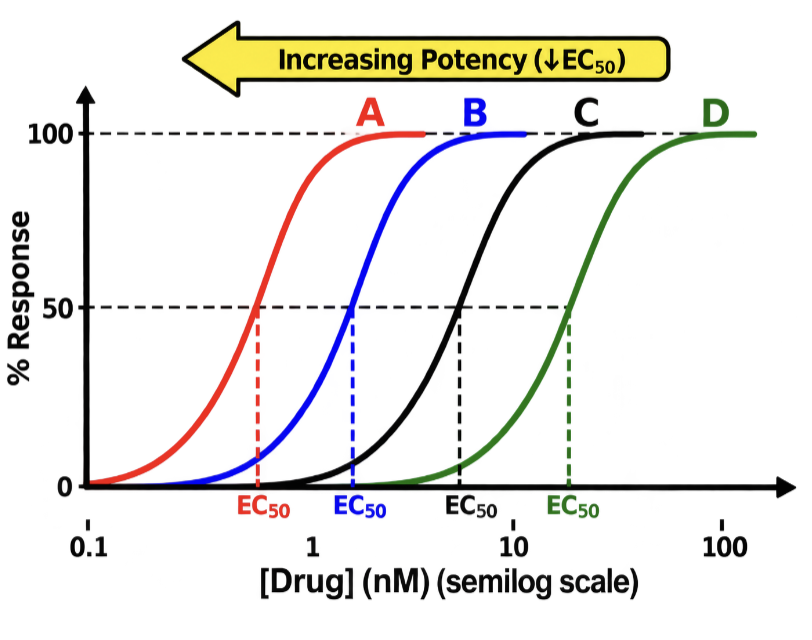
Potency: how far left does the curve lie?
Potency is related to the concentration or
dose needed for a specified response.Lower EC50 means higher concentration-
based potency.Comparing Emax and EC50 requires the
same assay conditions and response
definition.
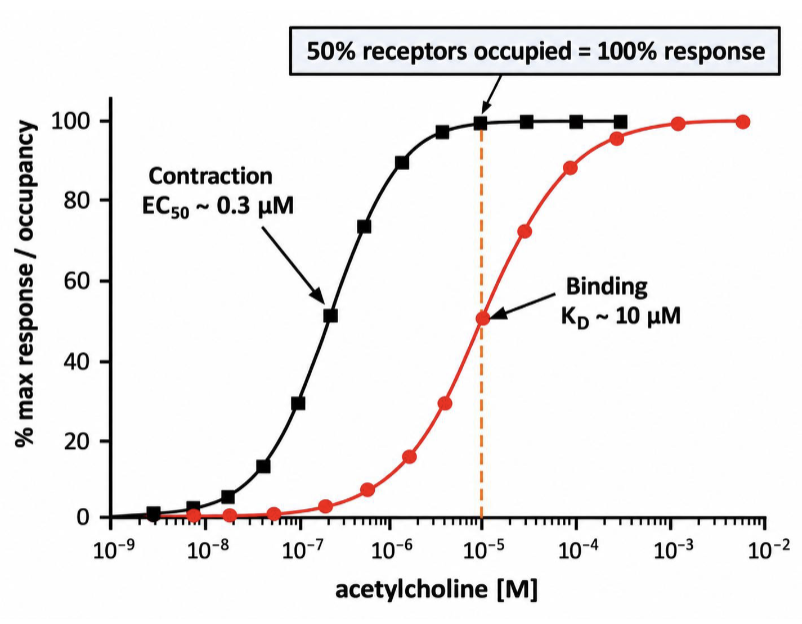
Why potency is not affinity alone
Drug response depends on affinity, intrinsic
efficacy, receptor density and signal
amplification.EC50 and Kd need not be equal.
Higher potency does not necessarily imply
better clinical treatment.

Spare receptors
occupancy ≠ response
Some systems achieve maximal response
without occupying all receptors.Signal amplification can make EC50
substantially lower than Kd.Spare receptors help explain why response
curves differ from binding curves.
In vitro concentration versus in vivo dose
Laboratory assays often examine
concentration–response relationships.Patient studies relate administered dose to
benefit or toxicity.ED50 may refer to 50% of a graded
maximum, or 50% of individuals in a quantal
response — define which one is used.

Therapeutic index: a population measure
Therapeutic index in a quantal model is TD50/ED50.
A smaller index may signal less separation
between benefit and toxicity.The index is a simplification; real prescribing
also considers patient-specific variation and
monitoring.

the therapeutic window
The therapeutic window describes the range
of exposures/doses where benefit outweighs
unacceptable toxicity.A narrow window makes dosing, interactions
and monitoring particularly important.Do not interpret therapeutic index as a
guarantee of safety for an individual.

Neutral antagonists: affinity without activation
Neutral antagonists occupy receptors
without initiating the agonist’s signal.They reduce the response an agonist can
produce at a given concentration.Site and reversibility determine the shape of
the change in response curves.

Orthosteric versus allosteric sites
Orthosteric site: where the natural agonist
binds.Allosteric site: a distinct regulatory site on
the receptor.An allosteric antagonist can reduce receptor
signalling without simply competing for the
orthosteric site.

Allosteric antagonism: another route
A negative allosteric modulator can reduce
agonist affinity and/or efficacy.Such effects cannot be understood as
simple competition for the same binding
site.The original reference figure illustrates a
distinct allosteric pocket.
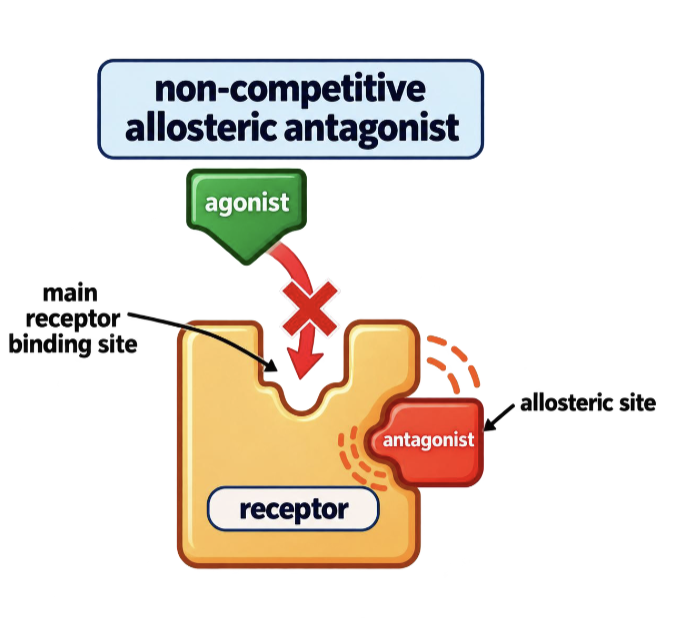
Reversible competitive antagonists: surmountable
Agonist and antagonist compete for the
same orthosteric site.Increasing agonist concentration can
overcome the antagonist under equilibrium
conditions.The maximum response can still be achieved
if enough agonist is present.

Graph rule: reversible competitive antagonist
A reversible competitive antagonist produces a
parallel rightward shift of the agonist curve in the
classical model.The agonist EC50 increases (apparent potency
falls).Emax remains unchanged if antagonism is fully
surmountable

Non-competitive antagonism: reduced maximum
Non-competitive antagonism can involve
irreversible receptor inactivation or negative
allosteric action.Increasing agonist often cannot restore the
previous maximum response.A reduction in Emax is typical, but receptor
reserve can affect the observed pattern

Inverse agonists: below basal activity
Some receptors signal even without added
agonist (constitutive activity).An inverse agonist reduces this basal
receptor activity.This differs from a neutral antagonist, which
blocks agonist stimulation without lowering
basal activity.
