lecs 10-14
 Call Kai
 Learn
 Practice Test
 Spaced Repetition
 Match
 Flashcards
 Knowt Play
1/45

There's no tags or description
Looks like no tags are added yet.
46 Terms
productivity - ecosystem ecology
controls on CO2 uptake
primary production
carbon sources and sinks
why care about photosynthesis/CO2 uptake via plants?
rising CO2 concentrations are contributing to global climate change
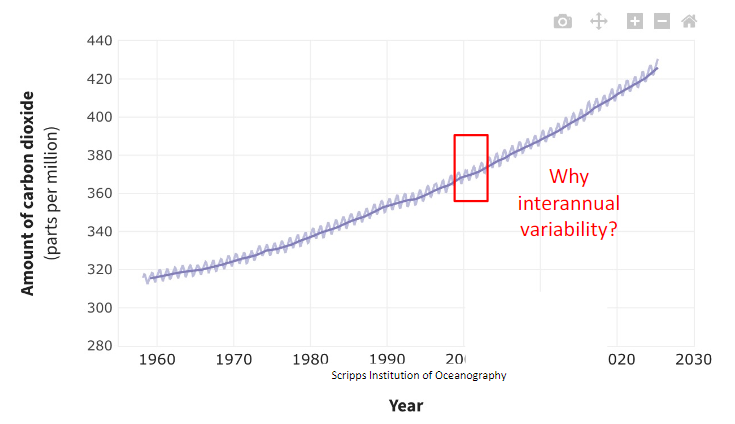
keeling curve interannual variability - more photosynthesis in warmer months, more CO2 sequestered
photosynthesis carbon inputs
single most important chemical process on earth
carbon enters ecosystems through photosynthesis
C drives all biotic processes
accounts for half of organic matter on earth, rest is mostly H and O
photosynthesis mechanism
sunlight + CO2 + water → photosynthesis → glucose + O2
photosynthesis constraints
water and nutrient uptake
water - tension-cohesion theory
light, CO2 and temperature
tension-cohesion theory of water uptake
water vapor diffuses out of the stomata (open during photosynthesis)
water evaporates from mesophyll (main site of photosynthesis) cells
internal leaf spaces contain high concentration of water vapor
water vapor level in external air is generally low
when stomata open it causes water vapor to diffuse out of the leaf into external air to balance (transpiration)
tension pulls water column upward and outward in the xylem (transport tissue) of veins in the leaves → stem → roots
this is the direction of the pull
water molecules form cohesive column in xylem
water movement is from roots → stem → leaves → out
water moves into roots via osmosis

stomata
tiny openings on the underside of leaf
open/close based on guard cells
two guard cells on each stomatal pore
control water loss by opening/closing stomata
influence of moisture on plant distributions
too much water - plants can be O2 limited
too little water - plants can desiccate
O2 limitation - too much water
O2 diffuses 10,000x slower in water than air
plant doesnt have access to as much O2 as it normally does on land
plant growth stagnates
waterlogging
plant responses to waterlogging/O2 limitation
pneumatophores - adventitious (extrinsic/not inherent) roots
mangroves have roots above the water as well to have access to O2
aerenchyma tissue - allows for greater exchange of gases btwn shoot and root
can be found on stem and root of plants
phragmites australis aka common reed - higher part of the tidal zone so they can access O2 when the water rises, probably has aerenchyma tissue on higher part of stem
arid environments - too little water
retention of H2O vs uptake of CO2 from atmosphere !!!
both regulated by stomata
CO2 flows in but H2O flows out
leads to a trade-off btwn carbon (needed for photosynthesis) and water uptake (evaporates when stomata are open)
reducing heat loading
heat focused onto single area
increase surface area for dissipation of convective heat
example - increased dense hairs/spines (succulents)
reducing evaporative losses
protect surfaces w thick, waxy cuticle so that water cant just accidentally evap out
recess stomates in (hair-filled) pits
orient leaves to minimize solar gain
avoid excess evap
shed leaves and become inactive during periods of stress
drop leaves in the winter
periodic droughts in mesas
dry seasons in tropical forests
water loss vs carbon gain trade-off
graph conditions:
1 - no water deficit
2 - mild water deficit
3 - extreme water deficit
more transpiration with wetter soil, less as soil dries out
under extreme water deficit/stress:
stomata close
CO2 uptake stops → photosynthesis stops

net photosynthesis
balance of two processes
photosynthesis - CO2 into plant
respiration - CO2 loss from plant (and into environment)
plants release CO2 from all cells into atmosphere as a byproduct of breaking down sugars to produce energy
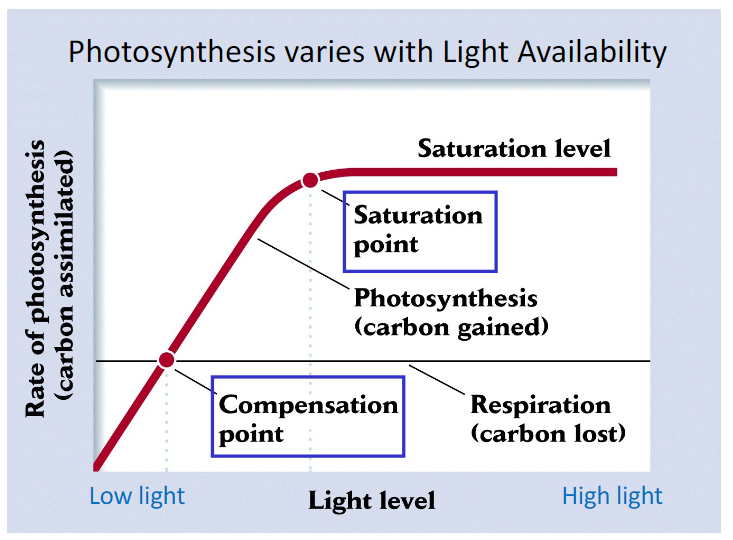
net photosynthesis depends in part on light availability
saturation level
photosynthesis light availability
more light, more photosynthesis until you reach saturation level
saturation level - where plant currently is irt saturation
saturation point - point where no matter how much light plant is exposed to it physically cant photosynthesize any more
compensation point - photosynthesis = respiration, net zero. above - loss, below - gain
respiration line at compensation point
at any given temp plants are either light-limited (more light more co2) or light saturated (no more co2) - this is before/after saturation point
primary production
production of organic compounds from inorganic material via photosynthesis + chemosynthesis by autotrophs
photosynthesis - plants + algae use light to form chemical bonds in carbohydrates
chemosynthesis - some bacteria use specific compounds as sources to transform into chemical bonds
common in environments w fluctuating redox potential
hudson river marsh
H2S → SO4 2- → S (sulfate) - OXIDATION, uses H2S for production of organic material
reverse direction is REDUCTION, uses sulfate for respiration
components of PP
GPP - gross primary production, total carbon assimilated by primary producers
R - respiration, energy consumed by producers for maintenance and biosynthesis
NPP - net primary production, carbon accumulated/stored by primary producers
NPP = GPP - R
patterns of primary production
seasonal flux in atmospheric CO2
high respiration in winter, high photosynthesis in summer
PP increases w temp + precip
PP patterns among ecosystems
terrestrial
swamp + marsh highest
desert lowest
aquatic
algal beds/reefs highest
open ocean lowest (less autotrophs)
measuring terrestrial primary production
harvest techniques
determine dry mass accumulated over specific amt of time
experimental procedure - n amount of plots, measured from time t to t+1
gas exchange techniques
determine net CO2 uptake in light (NPP), production of CO2 in dark (R) and their sum is GPP
eddy covariance
used to determine whole ecosystem CO2 exchange = net ecosystem exchange (NEE)
harvard forest + hubbard brook flux towers examples of eddy covariance measuring sites
two pieces of equipment on the tower
processing of data ends up with approximation of gas/CO2 exchange
global models + large timescales

measurement of aquatic primary production
problems aquatic systems pose:
cant use harvest approach, not practical for small organisms like phytoplankton
aquatic eddy covariance exists but we dont cover it
solutons/alternatives:
light/dark bottles may be used to determing O2 changes (production rates) rather than track CO2
what limits primary production
experimental lakes area study
canadian lakes have higher P associated with higher algal biomass
whole lake experiments founded in NW ontario, CA 1968
fertilized (P added) vs control (standard P) lakes
1970 - similar initally
1975 - big discrepancy btwn lakes, peak of fertilized lake
1980 - still large discrepancy of 4,600 mg/m³ plankton biomass but fertilized lake getting closer to control. last spike of plankton before drop
1982 - close in phytoplankton biomass again, potentially correlated with lower levels of P in the lakes
long story short this is if you add stuff that makes plankton grow to place where plankton live they will grow

PP limit ocean
most marine productivity occurs near coasts (more producers close to the surface + more producers overall)
flask experiments w Baltic sea water
reveals that N is the most limiting nutrient in marine water
correlation + whole-lake experiments
P limitation of freshwater ecosystems
essentially:
freshwater - usually P limited
open ocean - usually N limited
PP limit terrestrial
measured diameter growth of canopy trees Metrosideros as productivity indicator
young soils - N limited
intermediate soils - N + P limited
old soils - P limited
amt of P decreases and N increases over time

natural atmospheric CO2 sinks
plant sequestration/photosynthesis, CO2
soil sequestration, C (indirect sink)
ocean uptake
direct - photosynthesis
indirect - sedimentation at bottom of ocean
who gaf - carbon uptake by plants offsets fossil fuel emissions by ~30%
eddy covariance study ameriflux sites
42 sites used
eddy covariance techniques
mean annual net ecosystem exchange (NEE) for 2001-2006
most ecosystems are sinks rather than sources with the exception of shrublands (short grasses, very few trees)
PNW most effective at offsetting fossil fuel emissions by a margin of 200%, then

human alteration of global sulfur cycle
S emissions
S deposition
impacts on ecosystems
acid rain causes
SOx and NOx emitted to atmosphere as gases
SOx and NOx from manmade sources (gasoline from vehicles, coal and oil from power plants etc)
NOx from natural sources (lightning)
SOx and NOx in atm react with + dissolve in water vapor
forms H2SO4 (sulfuric acid) and NHO3 (nitric acid) - -ic acid
H+, SO4 2- and NO3- get deposited on land in rain/snow/clouds/dust

acid rain history
mid 1870s - acid rain first observed in england, think river thames and industrial revolution pollution
1960s - discovered to be major environmental problem
1980 - US congress passed Acid Deposition Act
1990 - title IV amendment of Clean Air Act to include mandated control of sulfur dioxide (SO2) and nitrogen oxides (NO and NO2) emissions
many states have seen decrease in S deposition but N deposition is still a major problem
sources of anthropogenic SOx emissions to atm
electrical power plants (coal, oil)
automobiles (gasoline)
NA emissions of SO2 peaked in 1970s and have decreased significantly since !!
Asia emissions still very high (37ish mil tonnes/year)

S deposition
gaseous + particulate pollutants in atm
wet - rain and snow
dry - gases and particles
neither - clouds and fog
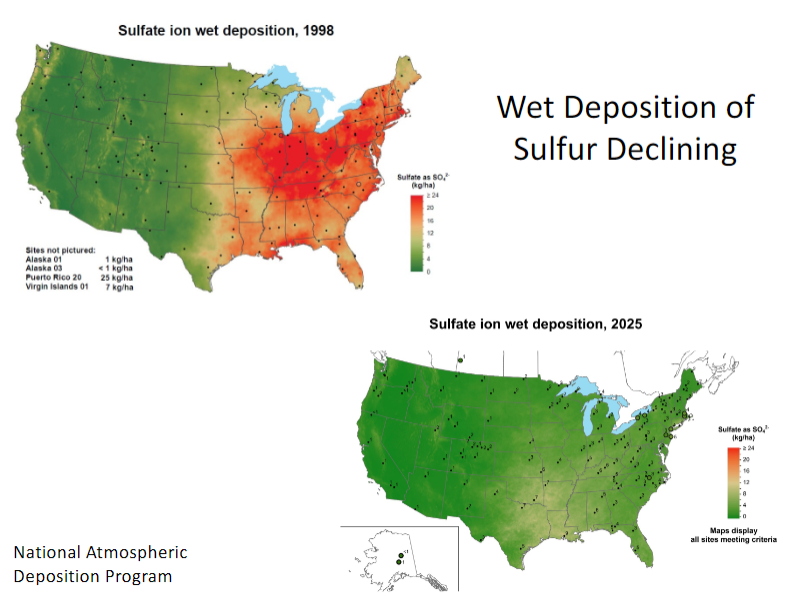
wet deposition of sulfate
1988 - lot of wet sulfate ions (SO4 2-) located in eastern US + puerto rico
2025 - very little across US
declining over years
wet deposition of S at hubbard brook, NH
declining from ~63 mu eq/L to ~5 over the course of 1965 - 2020
measured via rain gauge and wet deposition collector
rain gauge - measures volume of rainwater, left
wet deposition (rain/snow) collector - collects water to measure concentrations of pollutants, right
steps:
measure volume of rainwater RG
measure concentration of S in lab from wet deposition sample from WDC
convert concentration of sulfur to flux of sulfur using
concentration of S from WDC * vol of RG precipitation
hubbard brook sulfur decreasing in deposition via precipitation (wet deposition) and stream water !!!

v-notched weirs
measuring streamwater S
v-notch - weirs (stainless steel plates) with a v shape cut into them placed into part of a stream where all the water has to flow through it
measures volume of stream water = the flow
from here you measure S concentration from stream water sample
convert concentration of S into flux of S using stream flow/volume
S concentration = mass S/volume streamwater = mu mol S/L
S flux = mass/unit area/time = mu mol S/ha/yr
acid rain solved?
no lol. made huge headway/covered most of our bases but some challenges remain (surface acidic waters mobilizes inorganic aluminumm, acidifies waterways, accumulates mercury in fish + sulfate aerosols leading to diminished visibilty and global warming offset)
impacts of acid/sulfur deposition
acidifies waters
depletes soil of base cations (Ca, K, Mg)
mobilizes/moves around dissolved inorganic Al
acidifies waterways
surface water acidification → mercury accumulation in fish
sulfate aerosols
diminish visibility/views (think fog)
bright side - may offset global warming in the short term
reflect sunlight, exist in atmosphere for a brief period (3-5 days) but produced constantly, so overall cooling effect
cation exchange capacity - acid rain
trait of soils around the globe
clay minerals have (-) surface charge
hold onto hydronium (H+) that fall in rain/snow or released from natural plant/microbial processes
acid rain (wet deposition)
respiration (plant/microbial process)
presence of H+ blocks other (+) ions from binding (K+, Mg+2, Ca+2)
K+, Mg+2, Ca+2 cant bind to soil so they’re released into the soil solution
can be taken up by plants later
problem: increased acidity from acid rain makes enhances this process to a level higher than standard bg levels
cations can be leached out with precipitation and lead to nutrient imbalances in trees aka rain drives these cations off of the soil and the trees end up lacking these nutrients → impedes development

sources of H+ in soil water
plant roots
cation exchange
nitrification
acid rain
both nfication and acid rain can be increased via atmospheric deposition/acid rain
cation exchange - H+ in soil water through plant roots
same thought process as acid rain cation exchange
plant roots respire and release CO2
CO2 dissolves in soil water and converts to H2CO3
H2CO3 → HCO3- + H+

cation exchange - nutrient runoff effect on trees
red spruce
calcium leached from needle membranes (lack of Ca+2 taken up from leaves/needles)
leads to decreased cold tolerance + increased freezing injury
sugar maple
calcium and magnesium leached from soil (lack of Ca+2 or Mg+2 taken up from soil)
aluminum moved up and taken up by tree
leads to impaired root function + nutrition
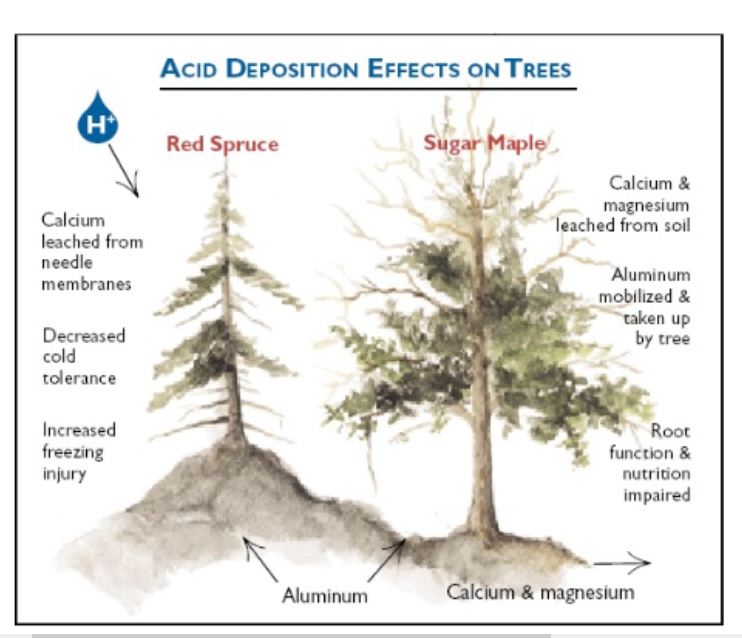
multiple stress syndrome
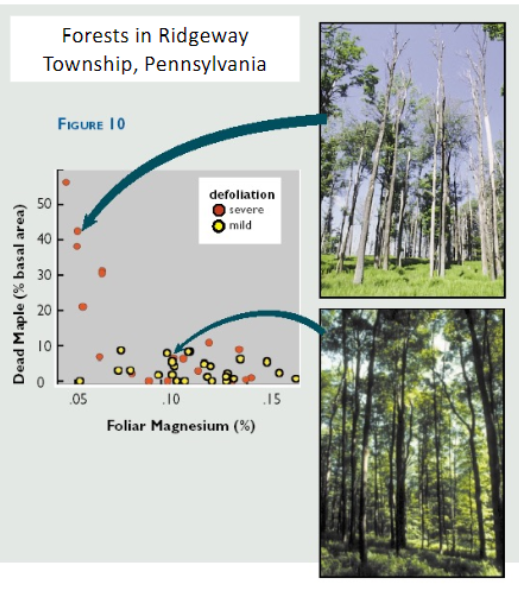
sugar maple decline
forests in ridgeway township, pennsylvania
both forests have same level of insect defoliation
bottom site (represented w yellow dot) has higher concentrations of cations in soil
found that cation depletion makes trees more susceptible to harm caused by insect defoliation - aka the more cations you have in soil the more hardy the trees are to insects chewing on leaves/needles/etc
acidity on fish community diversity
adirondack region of NY
n = # lakes in each pH class (4 to >8 in increments of 0.5)
long story short higher acidity = lower fish diversity
likely due to limiting range of tolerance like how less species can live in extreme environments

ecosystem recovery from acid rain
function of/relies on
how much S and N deposition in the past
rate and magnitude of decreases in acid deposition
how many base cations have been depleted from the soil
extent of S and N accumulation in soil and the rate at which they’re released through decomposition of SOM
weathering rate of soil/underlying rock and base cations associated w that weathering rate
rate of atmospheric deposition of base cations
clean air act accomplishments since 1990 summary
national electric utilities have met/surpasses emission targets set by 1990 CAA title IV amendments
HOWEVER !!! targets are still not sufficient for full recovery of sensitive ecosystems
need lower SOx and NOx emissions bc of poor buffering capacity of acid sensitive/low base cation available ecosystems
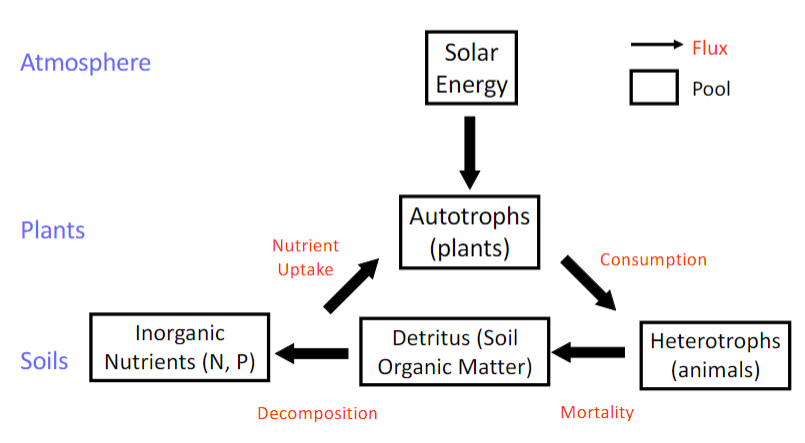
general ecosystem nutrient model for N cycle
atmosphere
solar energy
plants
solar flows into autotrophs/plants
soils
autotrophs flow into heterotrophs - consumption
heterotrophs flow into detritus/SOM - mortality/death
SOM flows into inorganic nutrients (N, P) - decomposition
inorganic nutrients flow into autotrophs - nutrient uptake through soil
N cycle inputs
atmosphere → plant
CO2 enters plant via photosynthesis
atmosphere → soil
N from atm fixed through S or N deposition, results in leaf/root literfall and animal/microbial mortality
plant → soil
leaf/root literfall results in soil organic matter (SOM) accumulation
soil processes

N cycle outputs