Lab 1: The Basics of R
 Call Kai
 Learn
Learn Practice Test
 Spaced Repetition
 Match
Match Flashcards
 Knowt Play
1/59

There's no tags or description
Looks like no tags are added yet.
Name | Mastery | Learn | Test | Matching | Spaced | Call with Kai | Chat |
|---|
No analytics yet
Send a link to your students to track their progress
60 Terms
What is the difference between R and R studio?
R is the programming language that performs the data analysis and calculations, R studio is the program/interface used to work with R.

Name each section of the R studio screen:


What is the Script side of the R studio screen for?
It is for writing and saving R code. The important thing about it is that the code remains there, so you can save it, change it, and run it.
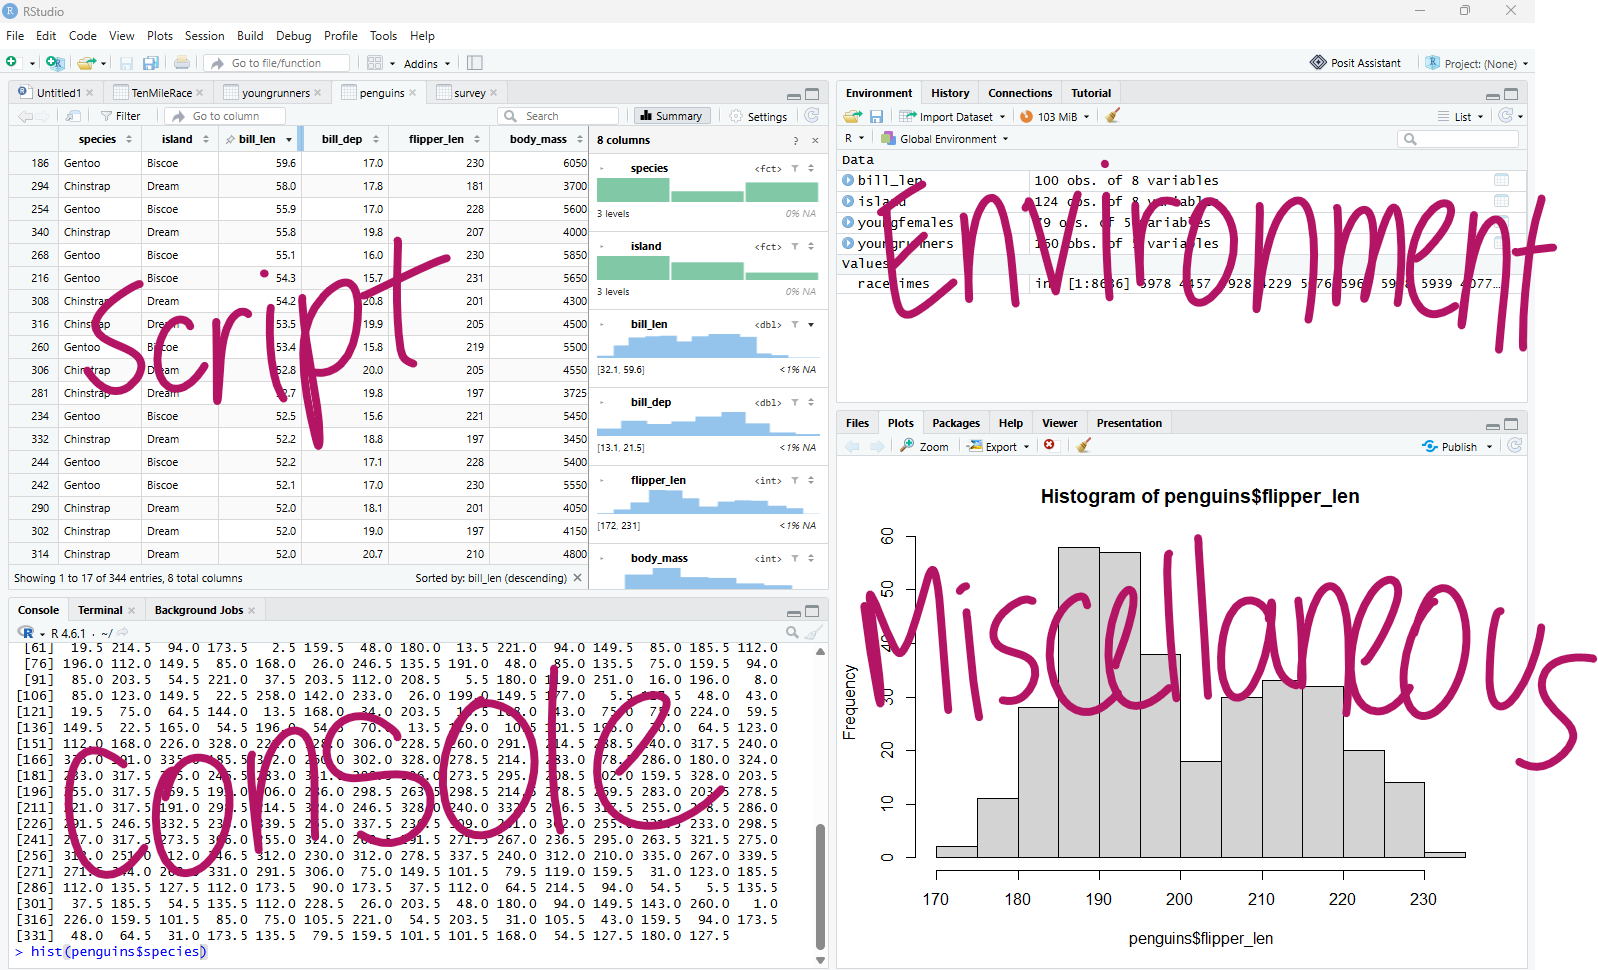
What is the Console side of the R studio screen for?
It is where all R commands are executed and where the output appears.

What is the Environment side of the R studio screen for?
It is for displaying the objects that you’ve created and loaded during your current session.

What is the Miscellaneous side of the R studio screen for?
The miscellaneous side of the screen is for various tabs, including: Plots, Files, Packages, Help…etc.
Plots = displays the graphs you create
Packages = show installed or loaded packages
Help = documentation about R functions or datasets
What is the R command for calculating a square root?
(ex. calculate the square root of 25)
sqrt(25)
How can you calculate the following arithmetic expression in R?
73(15) - 237
73*15-237
What is the exponent symbol in R?
^
What are packages for in R? What is the most important package?
Packages are used for accessing additional functions that are not already loaded.
The most important package is called mosaic.
What is the command for installing a package?
(ex. install the package mosaic)
install.packages(“mosaic”)
What is the command for loading a package?
(ex. load the package mosaic)
library(“mosaic”)
What does the $ mean in R?
$ means get the variable from X dataset
How can we get more documentation information or help about a dataset or function?
(ex. write a command to get help on the penguins dataset)
help(penguins)
Let’s say we had a dataset called students, containing age, height, and pulse.
Write a command to access the height variable of this dataset.
students$height

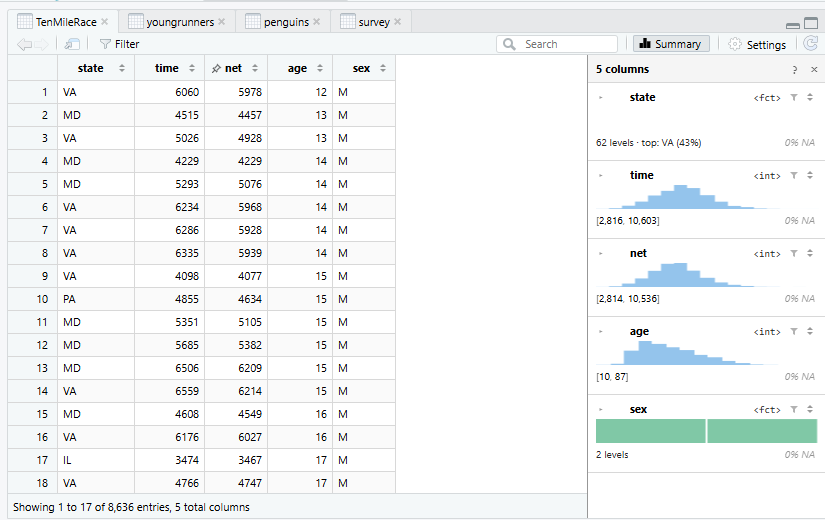
Write a statement that creates an object called racetimes and stores the net variable of the TenMileRace dataset in it.
(Note: In this dataset, net represents the net racing times of a single racer)
racetimes ← TenMileRacenet</strong></p><p></p><p>Note:</p><p>racetimesistheobject</p><p>←istheassignmentoperator</p><p>TenMileRacenet means access the net variable from the TenMileRace dataset

Write a statement to find the mean of all net variables in TenMileRace.
mean(TenMileRace$net)
Write a statement to find the mean of our object, racetimes.
mean(racetimes)
Is = a valid assignment operator?
Yes, it is, but we generally don’t use it because it can behave differently depending on the context. In general, we want to recognize ← as being the assignment operator.
Is R Case-Sensitive?
Yes

Write a statement checking to see if racetimes were less than 4000.
racetimes ← TenMileRace$net
racetimes < 4000

What kind of output can we expect to see from the following code?
racetimes ← TenMileRace$net
racetimes < 4000
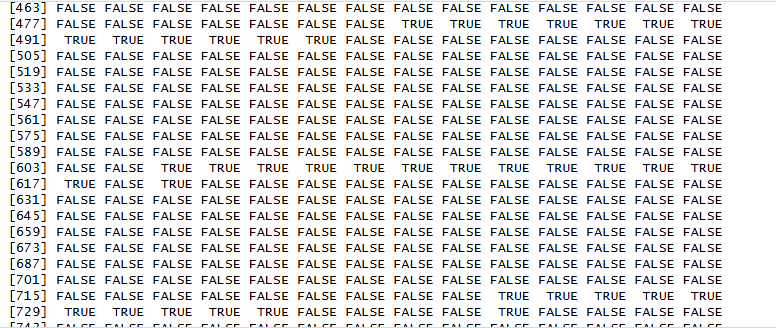
We can expect a bunch of TRUE and FALSE.
It just maps a boolean true or false value to every individual runner to indicate whether or not their net racing time was less than 4000.
What does sum(racetimes < 4000) do, assuming the output is:
TRUE FALSE TRUE TRUE FALSE
The sum function sums up of these true values:
TRUE FALSE TRUE TRUE FALSE
1 + 0 + 1 + 1 + 0
= 3
So it just counts how many runners had a racetime less than 4000.
What does filter() do?
It keeps the rows of a dataset that satisfy a certain condition.
Note that filter() can only operate on an entire dataset, not a single column.
What does filter(TenMileRace, age <= 21) do?
It filters to only shows rows where age <= 21
Write a statement to store the result of this filter function in a variable called youngrunners.
filter(TenMileRace, age <= 21)
youngrunners ← filter(TenMileRace, age <= 21)
Write a statement to count how many runners are in this filtered dataset:
youngrunners ← filter(TenMileRace, age <= 21)
If we consider each runner = one row, we can simply count the number of rows to find out.
nrow(youngrunners)
This tells us how many rows (or how many runners) matched the following condition.
In the TenMileRace dataset, you have the variables time, net, sex, and age.
Write a statement to filter for runners who are female and 21 years or younger.
filter(TenMileRace, sex == “F” & age <= 21)
How come when we write the following filter statement, we can say age directly, instead of TenMileRace$age?
filter(TenMileRace, sex == “F” & age <= 21)
This is possible because we already supplied the TenMileRace dataset to the function.
Write a statement to produce a table that shows how many runners are female, and how many are male.
table(TenMileRace$sex)

For racetimes, write a statement that:
a) calculates the mean
b) calculates the max
c) calculates the min
d) calculates the range
mean(racetimes)
min(racetimes)
max(racetimes)
range(racetimes)
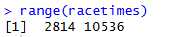
What does the range() function actually return in R?
It does NOT return max-min.
It returns both the minimum and maximum value.
ex. 3000 4500
Write a statement to sort the time for each runner in ascending order
rank(youngrunners$net)
This produces a table that looks like:
Runner Time
A 3000
B 3200
C 3500
D 4000
What happens when you are using the rank function and you have 2 values in your dataset that are identical?
ex. 3000, 3200, 3200, 4000…
The ranks are averaged, giving something like 2+3/2 = 2.5
Write a statement to create a histogram of racetimes
hist(racetimes)
When should you use table() over hist() ?
Use table() when you want counts for categories like sex.
Use hist() when you have numerical data you want to visualize across intervals.
Assuming the following program called StudentData:
Student Age Program Score
A 18 CST 92
B 21 CIT 76
C 19 CST 68
D 22 CST 85
E 20 CIT 88
Write a statement to figure out how many students belong to each program. What would it show?
table(StudentData$program)
CST → 3
CIT → 2
Assuming the following program called StudentData:
Student Age Program Score
A 18 CST 92
B 21 CIT 76
C 19 CST 68
D 22 CST 85
E 20 CIT 88
Write a statement to calculate the average score.
mean(StudentData$score)
Assuming the following program called StudentData:
Student Age Program Score
A 18 CST 92
B 21 CIT 76
C 19 CST 68
D 22 CST 85
E 20 CIT 88
Write a statement to calculate the lowest score.
min(StudentData$score)
Assuming the following program called StudentData:
Student Age Program Score
A 18 CST 92
B 21 CIT 76
C 19 CST 68
D 22 CST 85
E 20 CIT 88
Write a statement to calculate the min and max scores.
range(StudentData$score)
Assuming the following program called StudentData:
Student Age Program Score
A 18 CST 92
B 21 CIT 76
C 19 CST 68
D 22 CST 85
E 20 CIT 88
Write a statement to compare average scores between programs.
mean(data=StudentData, score~program)
Assuming the following program called StudentData:
Student Age Program Score
A 18 CST 92
B 21 CIT 76
C 19 CST 68
D 22 CST 85
E 20 CIT 88
Write a statement to create a histogram of scores.
hist(StudentData$score)
Assuming the following program called StudentData:
Student Age Program Score
A 18 CST 92
B 21 CIT 76
C 19 CST 68
D 22 CST 85
E 20 CIT 88
Write a statement to rank the students based on score.
rank(StudentData$score)
Given the dataset penguins, with properties: species, island, bill_len, bill_dep, flipper_len, body_mass.
What are the commands need to filter:
a) All data for only those penguins that are on the “Dream” island
filter(penguins, island == “Dream”)
Given the dataset penguins, with properties: species, island, bill_len, bill_dep, flipper_len, body_mass.
What are the commands need to filter:
b) All data for penguins that have a bill length less than 40.0 mm
filter(penguins, bill_len < 40.0)
Given the dataset penguins, with properties: species, island, bill_len, bill_dep, flipper_len, body_mass.
What are the commands need to filter:
c) All data for penguins that are both Adelie species and female
filter(penguins, species == “Adelie” & sex == “F'“)
Given the dataset penguins, with properties: species, island, bill_len, bill_dep, flipper_len, body_mass.
What are the commands need to filter:
d) All data for penguins that are not Adelie species or are on Biscoe island
filter(penguins, species ! = “Adelie” | island == “Biscoe”);
Given the dataset penguins, with properties: species, island, bill_len, bill_dep, flipper_len, body_mass.
What are the commands need to filter:
e) All data for only those penguins that have a bill length of at least 41.0 mm but do not have a bill depth of more than 15.0 mm.
filter(penguins, bill_len >= 41.0 & bill_dep > 15.0)
Given the dataset penguins, with properties: species, island, bill_len, bill_dep, flipper_len, body_mass.
Write the commands to create the following table:
a) A table of the penguin count by species
table(penguins$species)
Given the dataset penguins, with properties: species, island, bill_len, bill_dep, flipper_len, body_mass.
Write the commands to create the following table:
b) A table of the penguin count by island
table(penguins$island)
Given the dataset penguins, with properties: species, island, bill_len, bill_dep, flipper_len, body_mass.
Write the commands to create the following table:
c) A table of the penguin count by bill_len
table(penguins$bill_len)
Given the dataset penguins, with properties: species, island, bill_len, bill_dep, flipper_len, body_mass.
Write a command that outputs the number of penguins with a body_mass of at least 3900g
fatpenguins ← filter(penguins, body_mass >= 3900)
nrow(fatpenguins)
Given the dataset penguins, with properties: species, island, bill_len, bill_dep, flipper_len, body_mass.
Write commands that find the number of male penguins with bill lengths larger than the longest bill length of all female Gentoo penguins. Your commands should not have any hardcoded numbers, only variables.
femalegentoos ← filter(penguins, sex == “F” & species = = “Gentoo”)
femalegentoobeaks ← femalegentoosbilllen</p><p>largestfemalegentoobeak←max(femalegentoobeaks)</p><p>malepenguins(penguins,sex==“M”)</p><p>malepenguinbeaks←malepenguinsbill_len
sum(malepenguinbeaks > largestfemalegentoobeak)
Given the dataset penguins, with properties: species, island, bill_len, bill_dep, flipper_len, body_mass.
Give the commands for creating:
a) A histogram of the flipper lengths for all penguins
hist(penguins$flipper_len)
Given the dataset penguins, with properties: species, island, bill_len, bill_dep, flipper_len, body_mass.
Give the commands for creating:
b) A histogram of the flipper length for only Adelie penguins
adeliepenguins ← filter(penguins, species == “Adelie”)
hist(adeliepenguins$flipper_len)
Given the dataset penguins, with properties: species, island, bill_len, bill_dep, flipper_len, body_mass.
Give the commands for creating:
c) a histogram of the flipper length for only Chinstrap penguins
chinstrappenguins ← filter(penguins, species == “Chinstrap”)
hist(chinstrappenguins$flipper_len)
Why are there two peaks in the histogram for part:
a) the flipper lengths of all penguins?
Well because, Gentoo penguins tend to have very long flippers, while Adelie and Chinstrap tend to have smaller flippers. So on the histogram distribution, Adelie and Chinstrap are combined, forming one concentration, while the Gentoo penguins form the other concentration.
Given the dataset penguins, with properties: species, island, bill_len, bill_dep, flipper_len, body_mass.
Give the command to give the rank, by body mass, of all penguins in this dataset
rank(penguins$body_mass)
Why are there so many fractional ranks in the body mass of penguins?
Because multiple penguins have the same body mass, so their ranks are averaged, giving us decimal values.
Given the dataset penguins, with properties: species, island, bill_len, bill_dep, flipper_len, body_mass.
Give a couple of commands that outputs the weight range for the 20% of penguins with the shortest bills. Your commands should not have any numbers, except 0.2 or 0.8 maybe.