PBHLTH 150A — Unit 1 Gordis Readings
 Call Kai
 Learn
 Practice Test
 Spaced Repetition
 Match
 Flashcards
 Knowt Play
1/174

There's no tags or description
Looks like no tags are added yet.
175 Terms
rates
express the frequency of a given event (disease case or death) in relation to a unit of time
proportions
tells us what fraction of the population has a disease of interest; a subset divided by whole
incidence
number of NEW cases of disease; identified in people who newly develop the disease and have not had the disease previously.
is incidence a measure of risk?
YES, it is a measure of risk since it is a measure of events (i.e. transition from non-disease to diseased)

what are the two types of denominators for incidence measures?
1. people at risk who are observed throughout a defined time period
2. units of time when each person is observed (person time)
what is the denominator of incidence?
the denominator represents the people who are AT RISK for the disease. any individual who is included in the denominator must have the potential to become a part of the group
e.g. when calculating the incidence of uterine cancer, the denominator should only include females with no history of hysterectomy, since males and females with hysterectomies would never get this cancer.
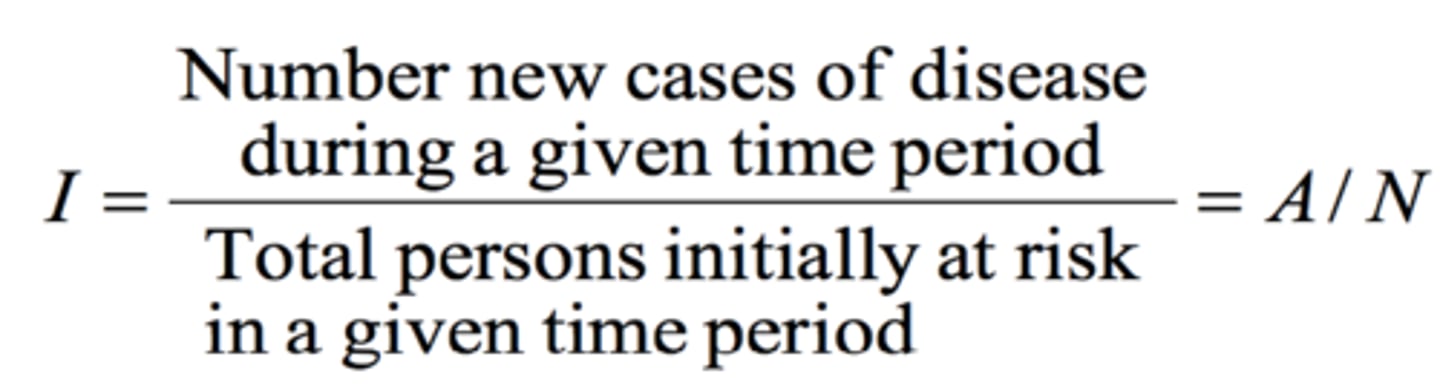
cumulative incidence
the frequency of NEW cases of a disease that occur during a specific period of TIME in a population AT RISK for developing the disease.
incidence rate
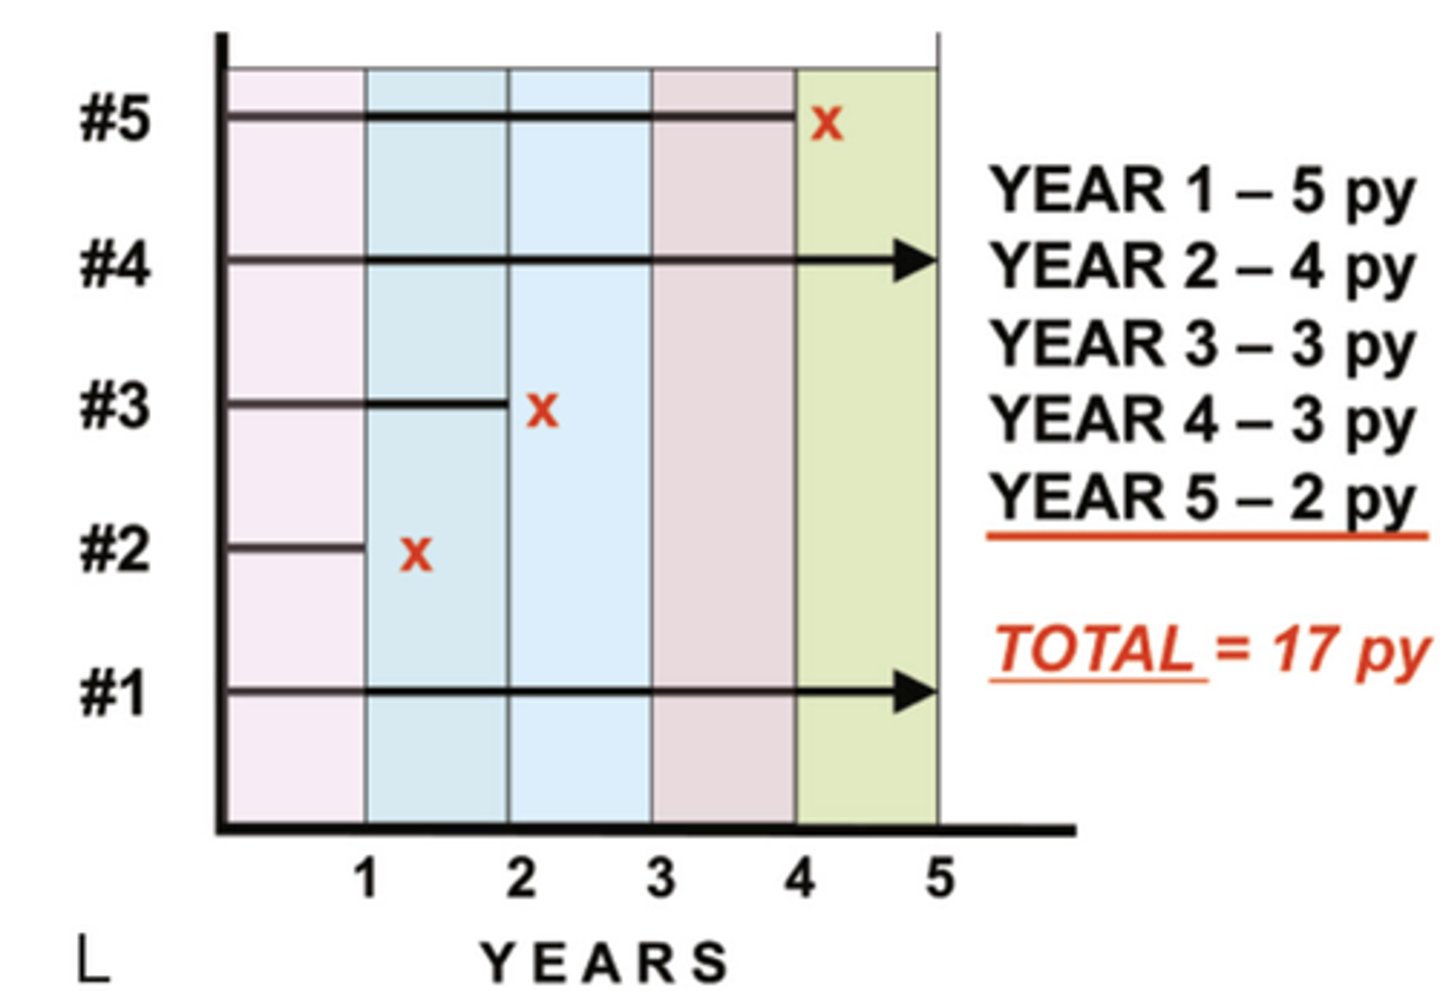
the rate in which individuals are observed for different lengths of time. the denominator is person time
person time
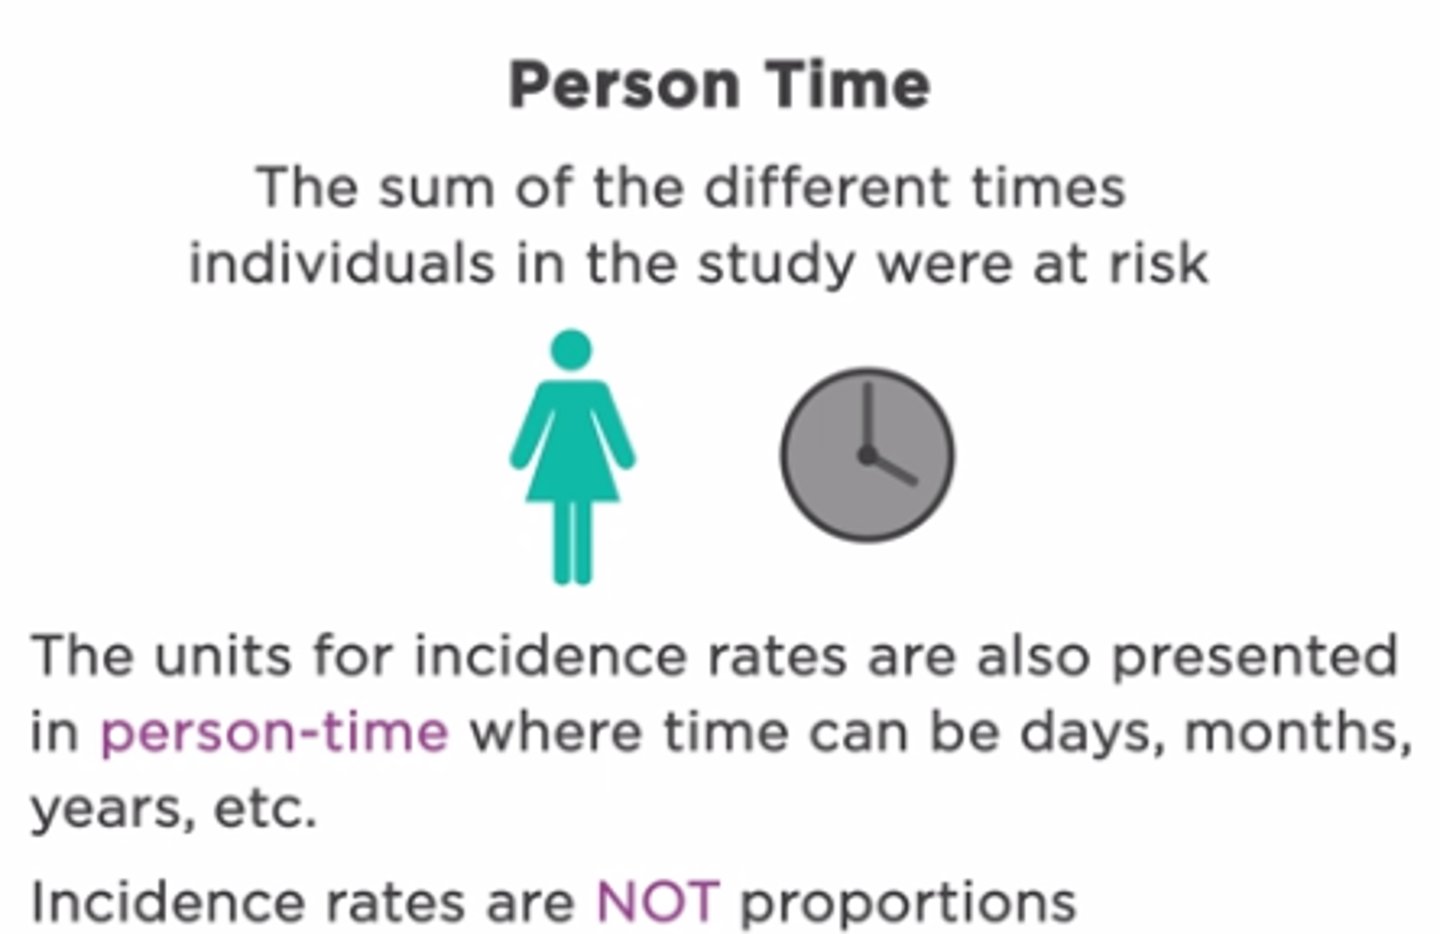
the denominator of incidence rate. it consists of the sum of the units of time that each individual was at risk and was observed.
often expressed in person years (py)
explain how person years (py) works.
one person who is observed for 1 year = 1 py.
one person who is observed for 5 years = 5 py.
5 at-risk people observed for 1 year = 5 py
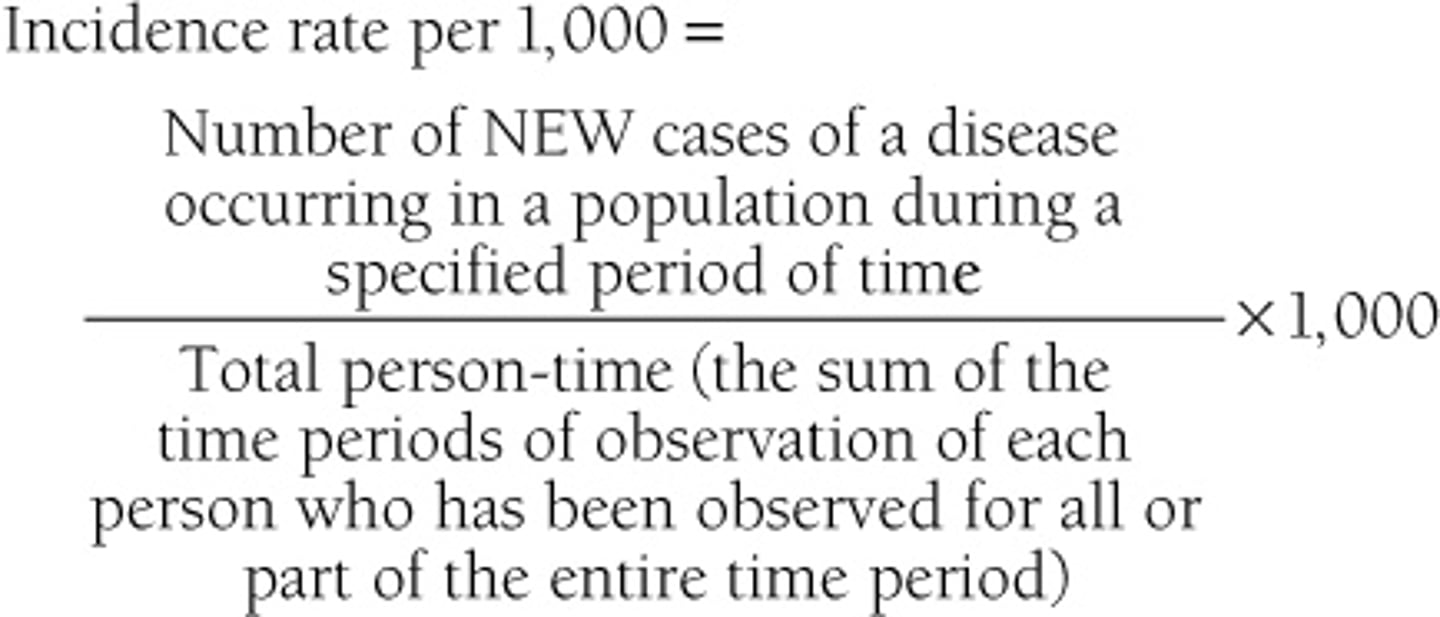
if people at risk are observed for different periods of times, the incidence rate is:
see image.
step 1: screening for prevalent cases at baseline
first, identify a population.
determine who has a disease and who does not. those who have the disease are considered "prevalent cases"
follow up with those who did not have the disease at baseline
step 2: follow up and re-screening at 1 year to identify cases that developed during that year
once followed up with those who did not have the disease at baseline, wait 1 year until rescreening.
follow up with the population at 1 year there will be a portion of the population who develop the disease -- these are new cases.
prevalence proportion
the number of affected people present in a population at a specific time divided by the number of people in the population at the time
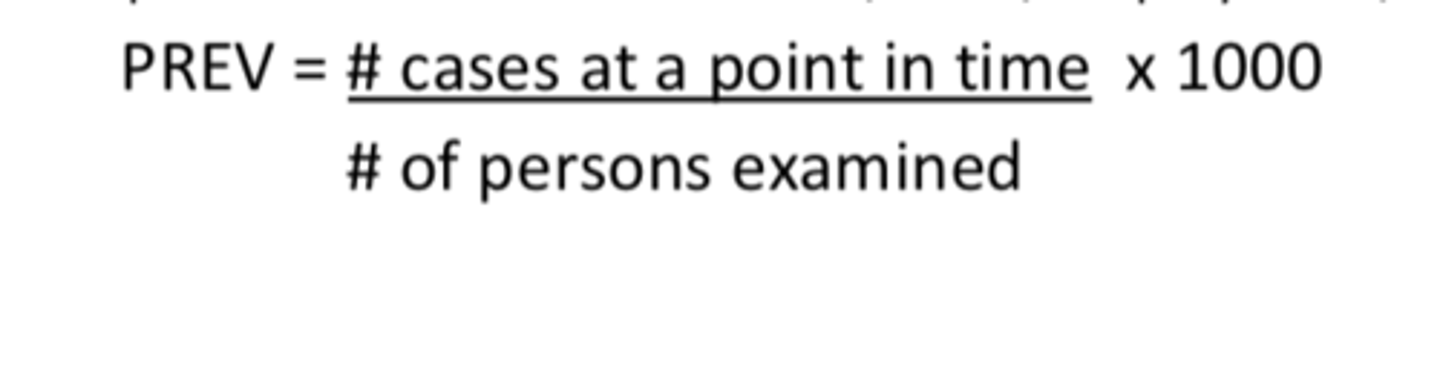
prevalence
a snapshot or a slice through the population at a point in time in which we determine who has a disease and who does not.
when the disease was developed is not determined nor the duration of the disease.
incidence vs prevalence
Incidence is the rate of occurrence in a specified group of people. usually studied in longitudinal method.
prevalence is determined by counting the number of individuals who currently have it. usually done by cross-sectional.
what are the two types of prevalence?
point prevalence
period prevalence
point prevalence
prevalence of a disease at a certain point in time; often referred to as just prevalence
takes time to gather data
period prevalence
how many people have had the disease at any point during a certain time period?
time period could be anything, 2 months, 3 years, etc.
give examples of the two types of prevalence and cumulative incidence, regarding asthma.
Point prevalence: do you currently have asthma?
period prevalence: have you had asthma during the last [x] years?
cumulative incidence: have you ever had asthma?
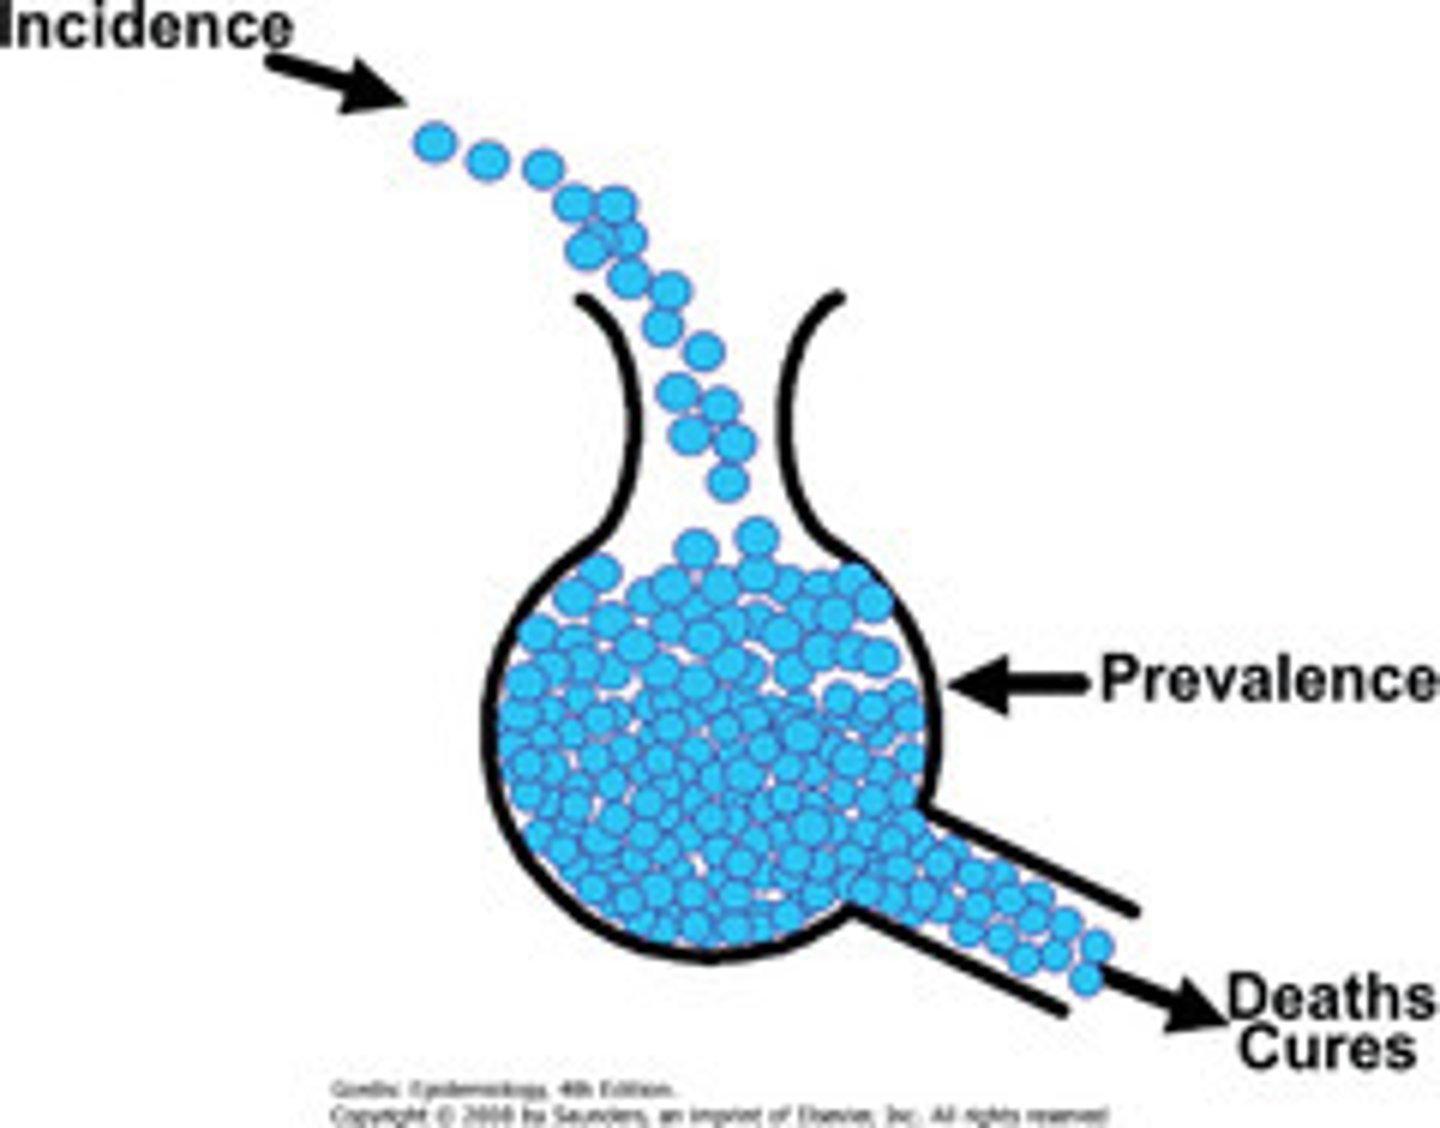
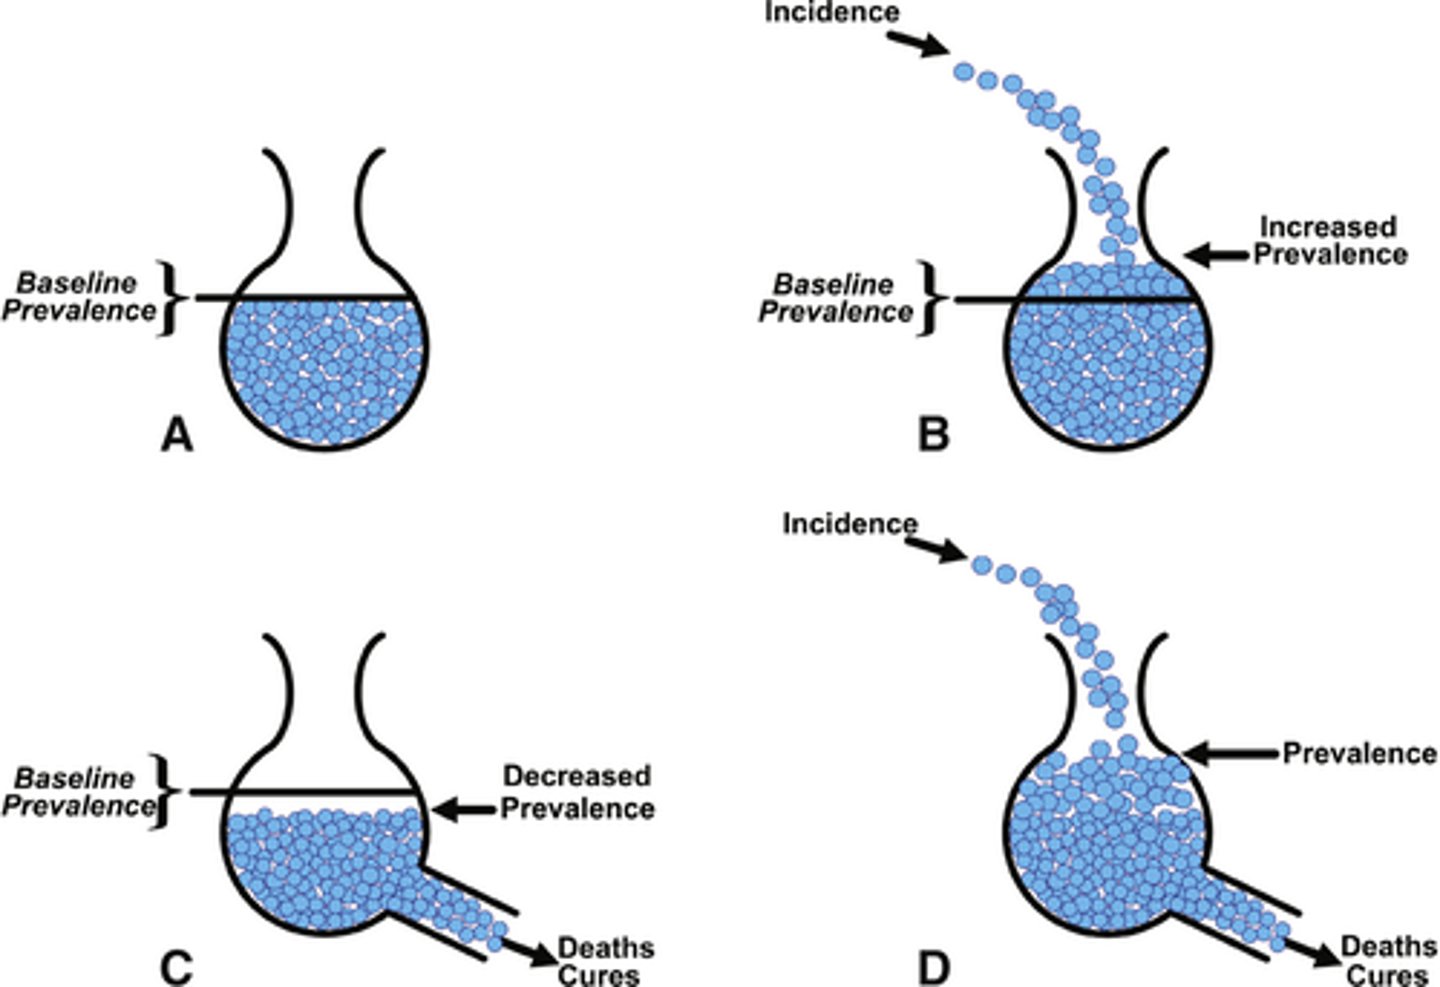
what is the relationship between incidence and prevalence? think of the flask drawings.
to add or increase prevalence: through incidence; adding new cases
to lower prevalence: can occur through either death or cure
therefore: new cases (incidence) increases prevalence whereas deaths/cures decreases prevalence
if prevalence is not a risk measure, why should we estimate prevalence?
prevalence is an important and useful measure of the burden of disease in a community to inform resource allocation by decision-makers. (e.g. how many clinics are needed, services, etc.)
name some possible sources of morbidity statistics
1. disease reporting
2. data accumulated as a by-product of insurance and medical plans
3. hospitals and clinics
4. absenteeism records (school, work)
5. pre-employment physical exams and periodic exams
6. morbidity surveys on population samples (e.g. NHS, NCS)
what are some problems that can arise with NUMERATORS, specifically when discussing incidence and prevalence measurements?
1. defining who has the disease. some diseases are difficult to diagnose
2. who should be included in the numerator; how do we find the cases? can be done with readily available data, studies, etc. but can be limited/inaccurate.
what are some problems that can arise with DENOMINATORS, specifically when discussing incidence and prevalence measurements?
1. undercounting populations
2. using either corrected or uncorrected rates
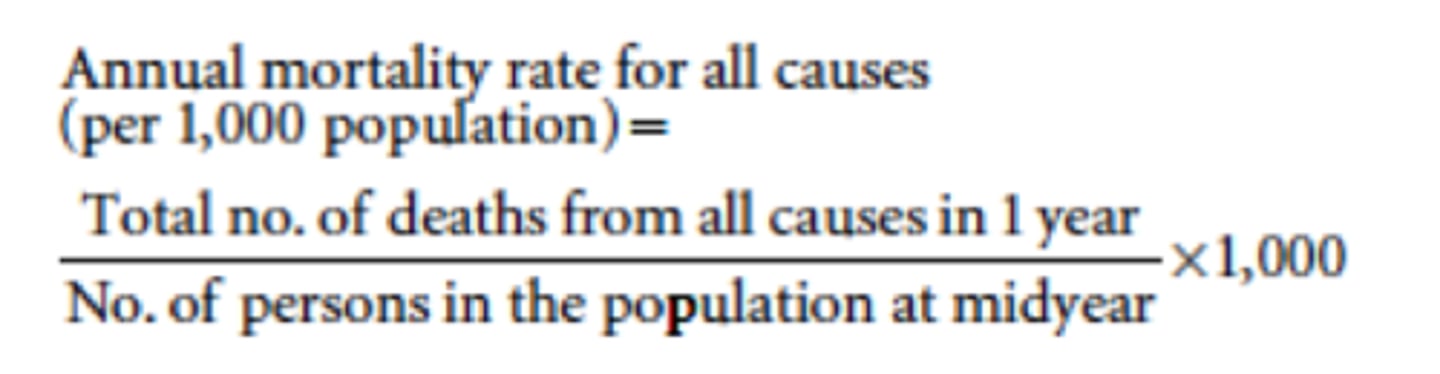
mortality rate
also called annual death rate. it is the total number of deaths from all causes in one year divided by the number of people in the population at midyear
because population changes over time, the number of people at midyear is generally used as an approximation of the average population of the year.
REMEMBER: anyone in the group represented in the denominator must have the potential to enter the denominator
mortality rate can be adjusted if interested in certain age groups; this change must be reflected in both numerator and denominator
what is specific rate?
specific for a certain group.
examples include: mortality rates for children under age 10 (age-specific mortality rate), rates for specific diagnoses (disease specific rate)
case-fatality
what percentage of people who have a certain disease die within a certain time after the disease was diagnosed?
measure of the severity or fatality of disease
this is a PROPORTION
mortality rate vs case-fatality
in mortality rate: denominator represents the entire population at risk of dying from the disease. this includes both who have the disease and who do not have it.
in case-fatality: denominator is limited by those who already have the disease. determines the proportion of people who died from people who already had the disease.
proportionate mortality
the proportion of deaths that are attributable to a specific cause. e.g. what proportion was caused by cardiovascular disease?
years of potential life lost (YPLL)
measure of premature mortality (early death)
YPLL recognizes that death occurring in a person at a younger age involves a greater loss of future productive years than death occurring at an older age
how to calculate YPLL
1. for each cause, each deceased person's age at death is subtracted from a predetermined (or average) age at death (e.g. 75 is the average in the U.S. dying at 50 is 75-50 = 25)
2. the YPLL for each individual are then added together to yield the total YPLL for the specific cause of death
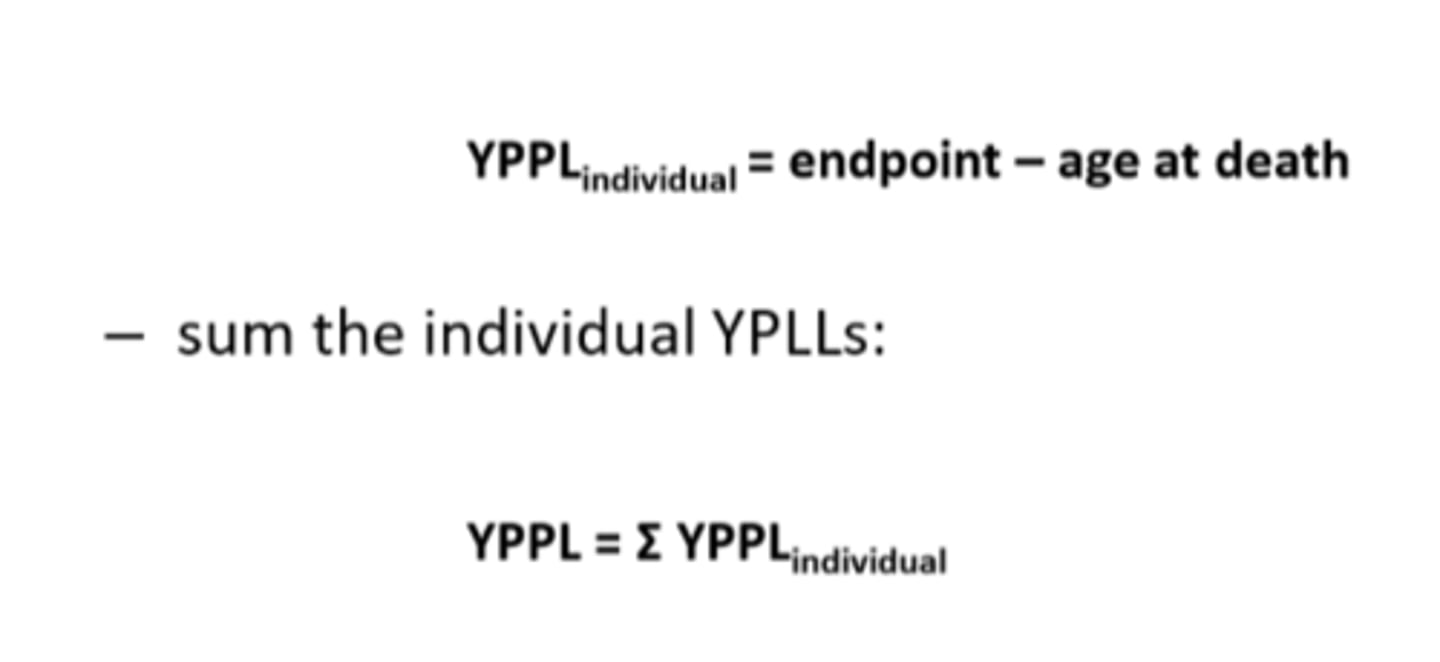
why is YPLL important? list three reasons.
1. establishes research and resource priorities
2. surveillance of temporal trends in premature death
3. evaluating the effectiveness of program interventions
when is mortality rate a good reflection of the incidence rate?
1. when case-fatality is high
2. when the duration of the disease (survival) is short
in these conditions, mortality is a good measure of incidence, thus a measure of risk of disease
underlying cause of death
The disease or injury which initiated the train of morbid events leading directly or indirectly to death or the circumstances of the accident or violence which produced the final injury.
what are two main problems with mortality data?
1. Coding categories and regulations for the International Classification of Diseases change from one revision to another. Therefore, any study that spans more than one revision must examine the possibility that observed changes could be entirely or in part of the changes in the ICD.
2. changes in the definition of the disease can have an effect of the number of cases that are reported.
crude mortality
deaths from all causes/population at risk for death. also known as unadjusted mortality
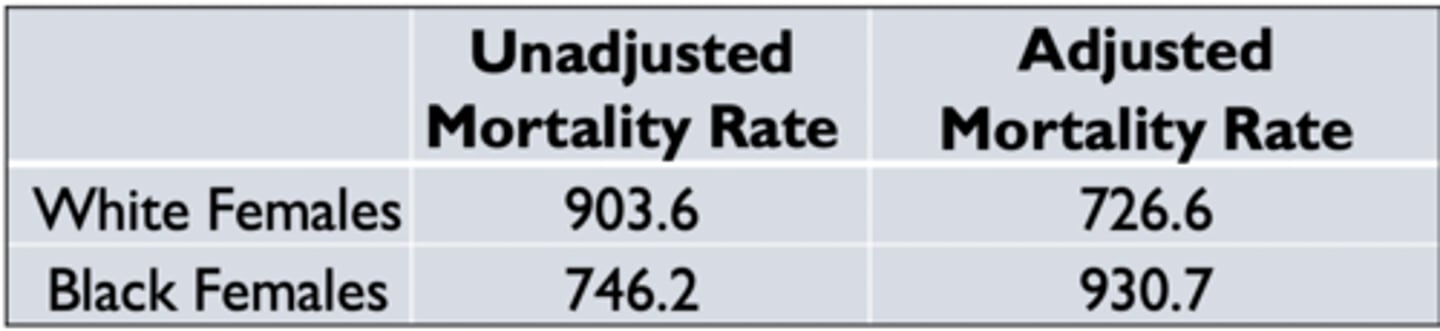
direct age adjustment
a standard population is used in order to eliminate the effects of any differences in age between two or more populations being compared
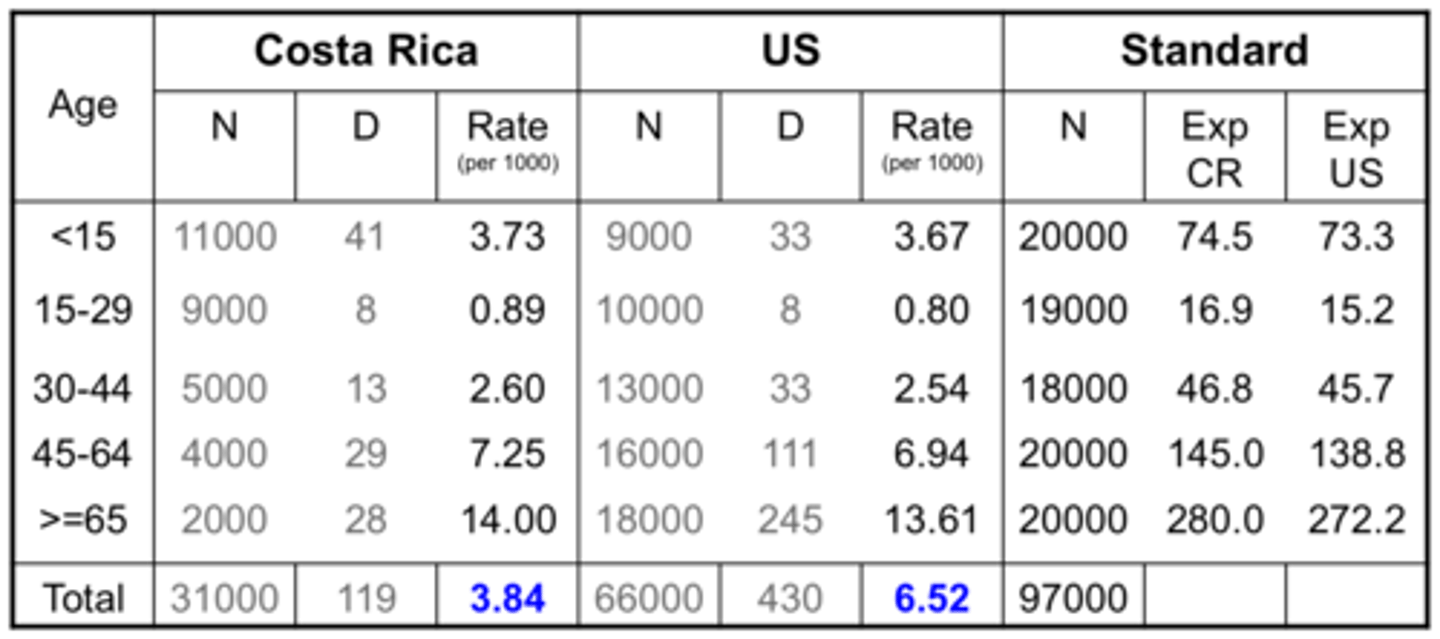
age adjusted rates
Epidemiological data that have been manipulated, using standard statistical techniques, to eliminate any effects that arise because some populations include more older or younger persons than do others.
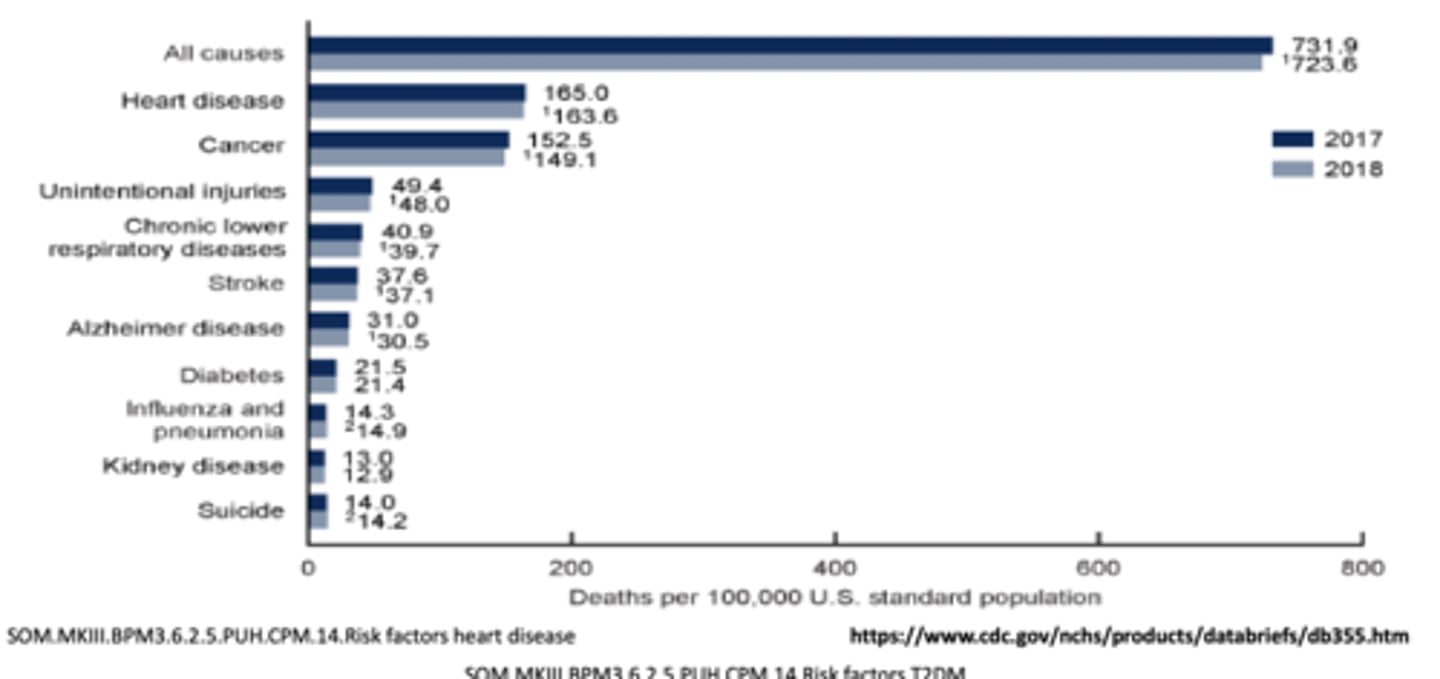
what are two things one should keep in mind when analyzing mortality data in regards to age adjusted rates?
1. when examining and analyzing comparative mortality data, one should carefully examine the age specific rates for any changes or differences
2. age adjusted rates are hypothetical because they involve applying actual age specific rates to a hypothetical standard population
indirect age adjustment
used when numbers of death for each age-specific stratum are not available, and to study mortality in occupationally exposed population
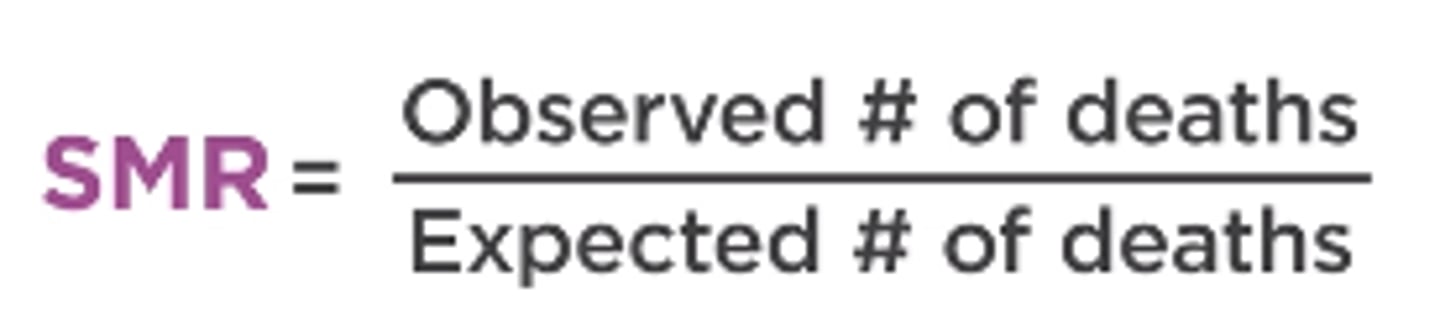
standardized mortality ratio (SMR)
the ratio of the observed number of deaths (or cases) in a study population to the expected number of deaths in that same population
what are some possible explanations of trends or differences in mortality?
- change in diagnostic modalities or management strategies
- change in survivorship without incidence change
- change in incidence
- change in age composition of the population(s)
- a combination of one or more above factors
what are two other measures of the impact of disease?
quality of life and projecting the future burden of disease
why should quality of life also be taken into account when prioritizing health care resources?
many diseases are chronic and non life threatening and may be associated with many years of disability, having physical and mental health consequences
why may measuring quality of life and developing indices that are useful to obtain comparative data in different patients and populations remain challenging?
patients may place different weights on different quality of life measures depending on their occupations and other activities, personalities, cultural backgrounds, education, and more.
disability adjusted life year (DALY)
the number of years of life lost to premature death and years lived with a disability of specified severity and duration
a DALY is 1 lost year of healthy life.
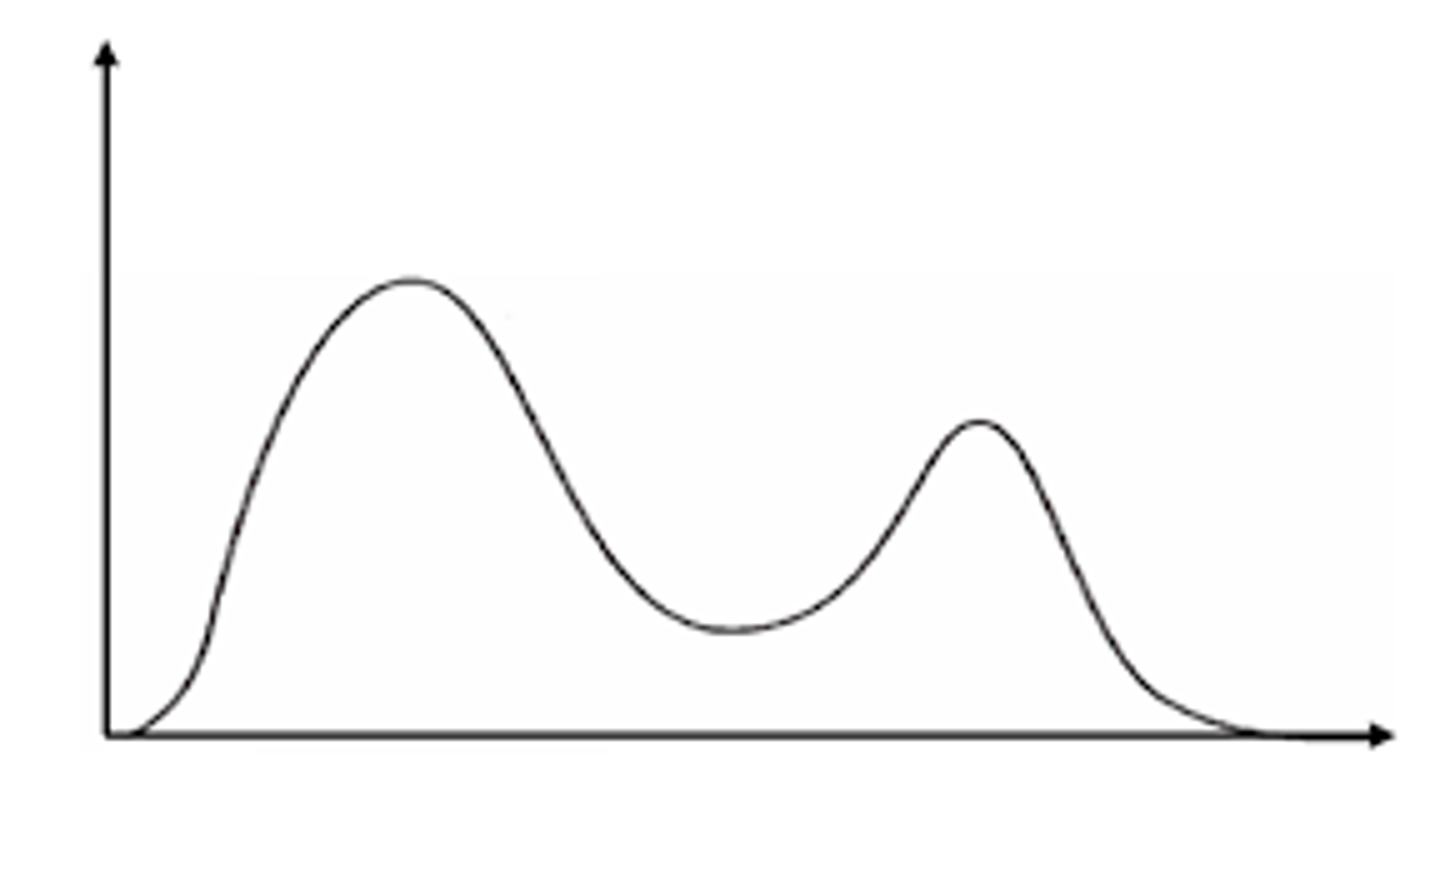
bimodal curve
a distribution where there are two peaks
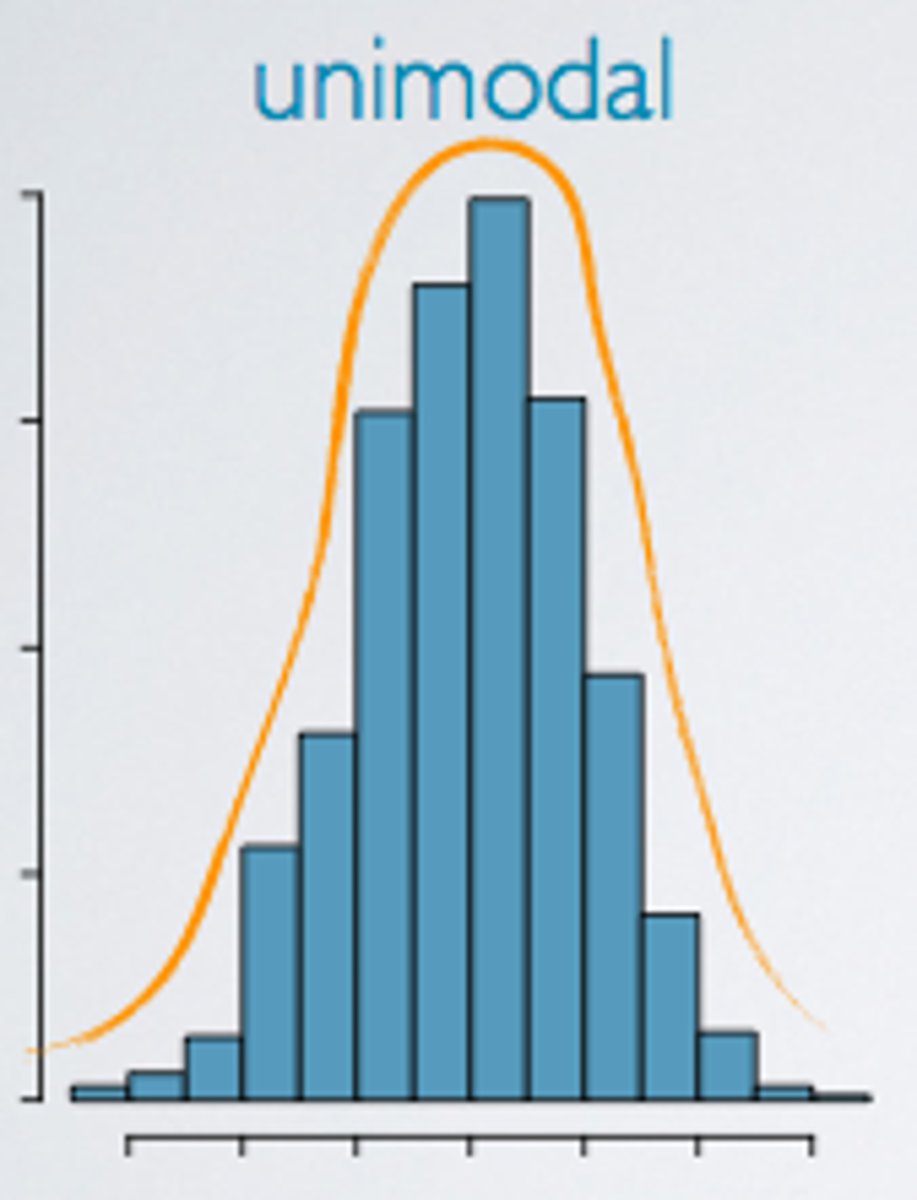
unimodal curve
a distribution where there is one peak
what is test validity? what are the two components of test validity?
a test's ability to correctly distinguish between who has a disease and who does not.
there are two components: sensitivity and specificity
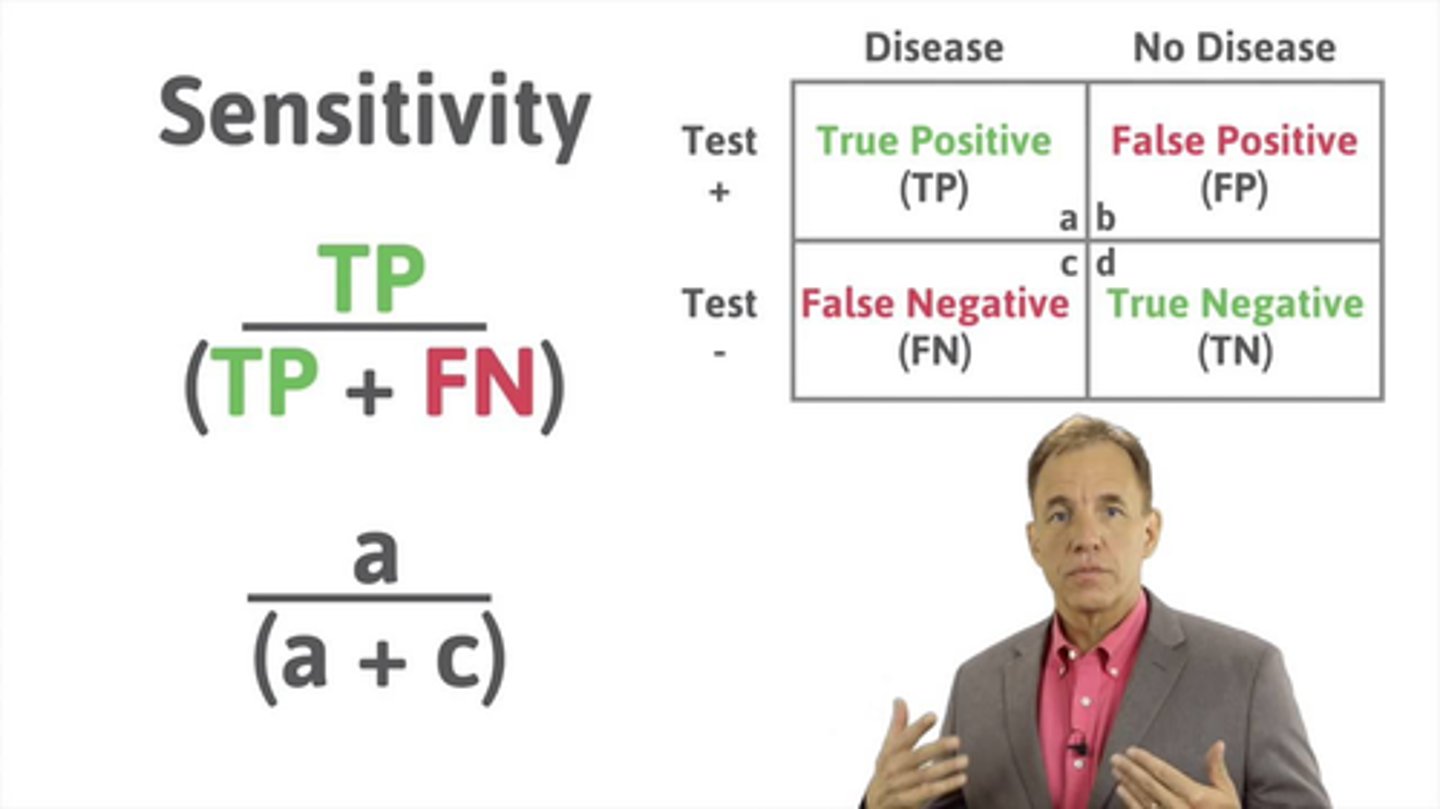
sensitivity definition and formula
definition: the ability of a test to correctly identify those who HAVE the disease
formula: (True Positive)/(True Positive + False Negative)
specificity definition and formula
definition: the ability of the test to correctly identify those who DO NOT HAVE the disease
formula: (True Negative)/(True Negative + False Positive)
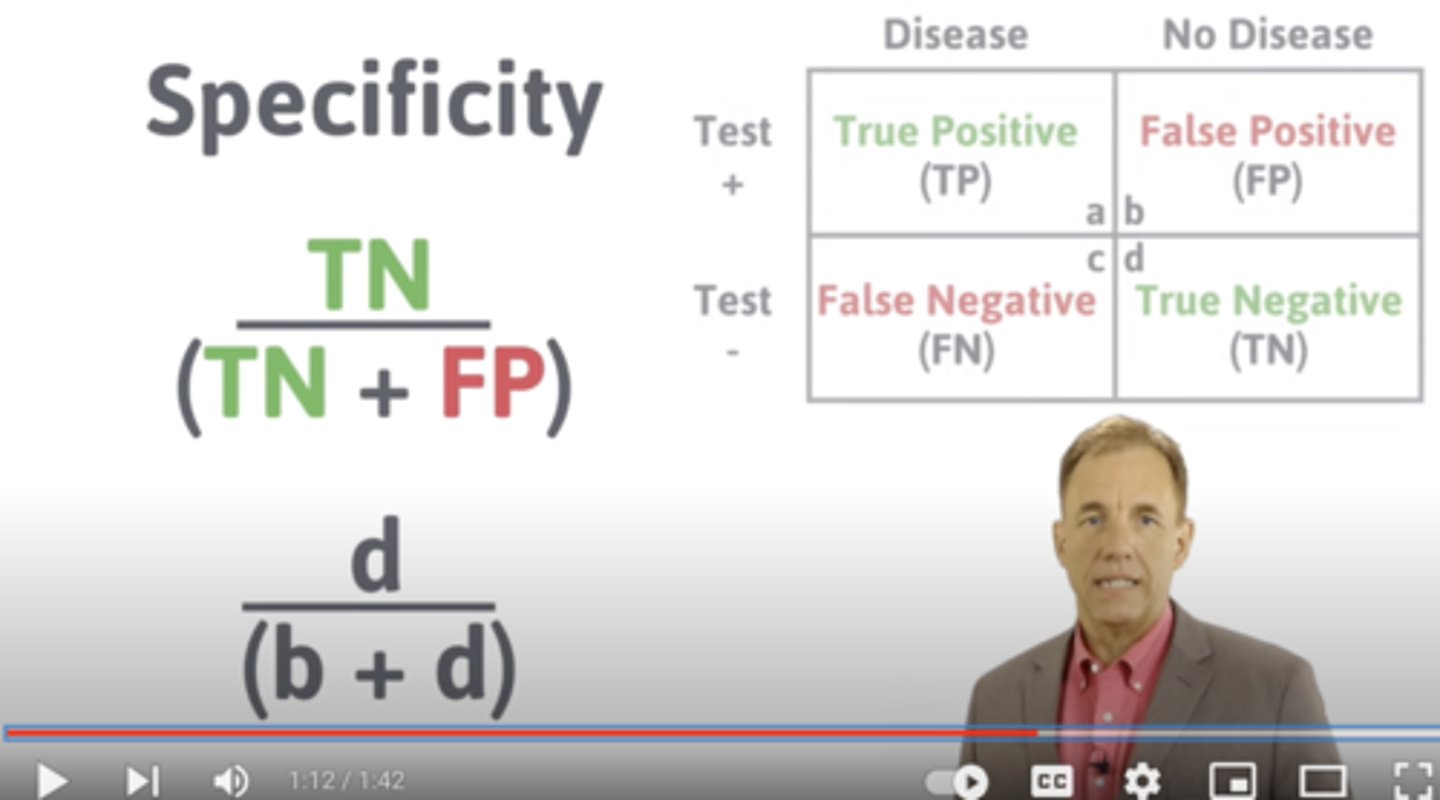
true positive
people WITH a disease who are correctly called "positive" by a test
true negative
people WITHOUT a disease who are correctly called "negative" by a test
false positive
people WITHOUT a disease who are correctly called "positive" by a test
false negative
people WITH a disease who are correctly called "negative" by a test
why can false positives be so problematic?
all people who screen positive are brought back for more sophisticated and more expensive tests, or even go through tests that are invasive. this is both a burden on the healthcare system and can be expensive.
furthermore, these people are then filled with anxiety and worry.
why can false negatives be so problematic?
if a person has a serious disease and is only curable in its early stages, a false negative can lead to a virtual death sentence.
what's the relationship between sensitivity and specificity when trying to determine cutoff levels? (i.e. what happens to one if the other is lowered?)
there is a trade off between sensitivity and specificity.
if we increase the sensitivity by lowering the cutoff level, we decrease specificity.
if we increase the specificity by raising the cutoff level, we decrease sensitivity.
how can we decide whether we want a high or low cutoff level for screening?
it depends on the importance we attach to false positives and false negatives.
false positives are associated with costs (both emotional and financial) as well as with the difficulty of "delabeling" a person who tests positive and is later found to not have the disease. finally, it poses a burden to the healthcare system as these individuals must be brought it for additional testing.
false negatives can lead to a serious disease being missed at an early treatable stage.
sequential screening
a less invasive/comfortable/expensive test is performed first → further testing for those who tested positive on the first test, which is usually expensive/invasive/uncomfortable.
the second test may have greater sensitivity and specificity.
sequential testing formula
use the values from the A cube in table 1 to fill out the values in the A and C cube in table 2.
use the values from the B cube in table 1 to fill out the values in the B and D cube in table 2
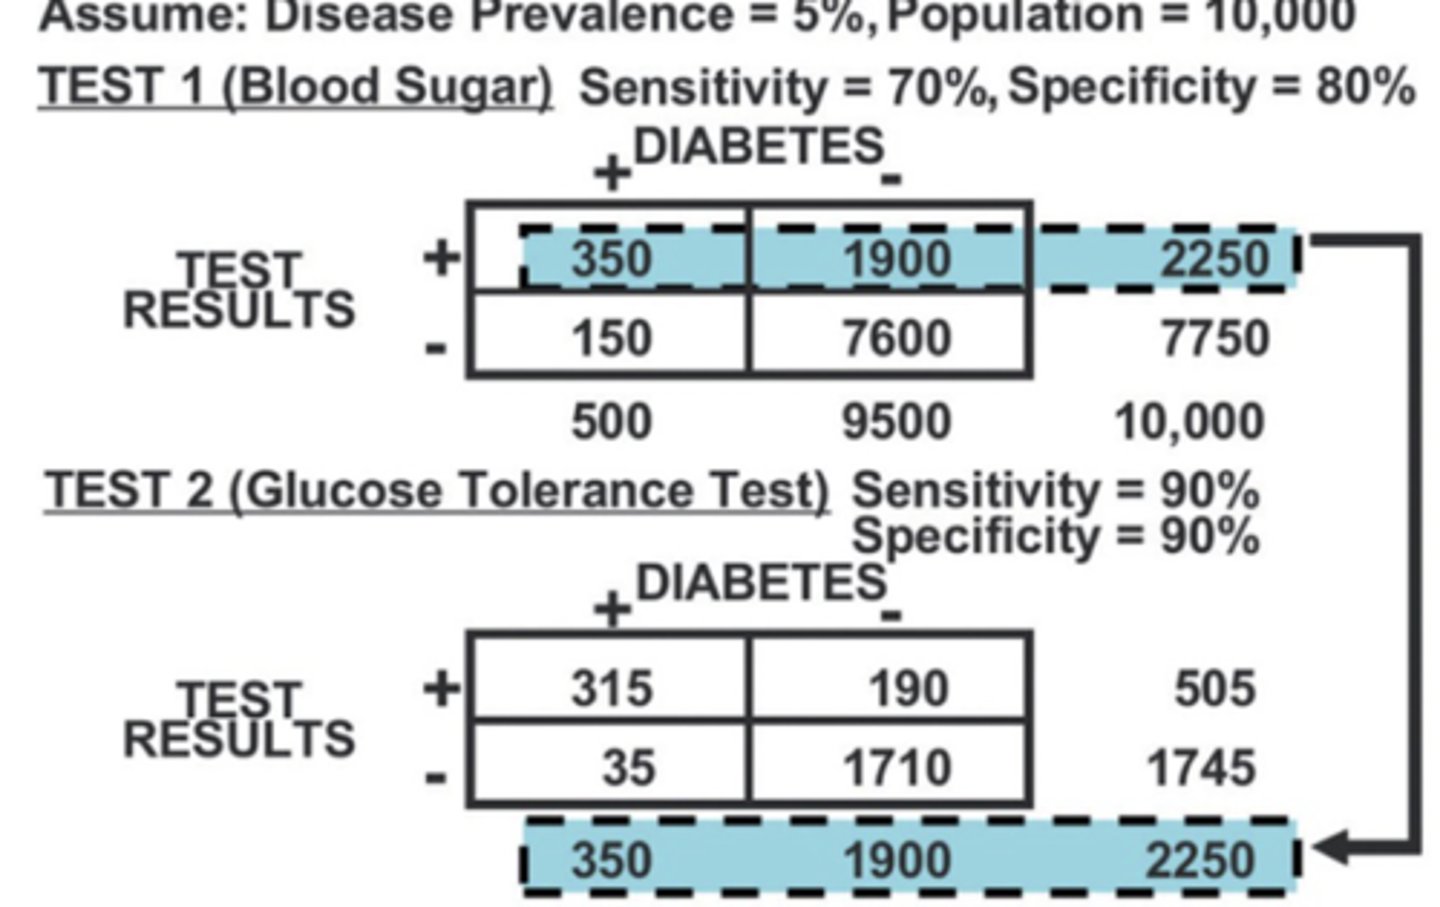
simultaneous testing
all individuals being screened are given both tests at the same visit
net gain in sensitivity and net loss in specificity
net sensitivity
in simultaneous testing, must be POSITIVE in EITHER test to be considered a positive.
formula: (positives in only Test A + Positives from both tests + Positives in only Test B) / (People with the Disease)
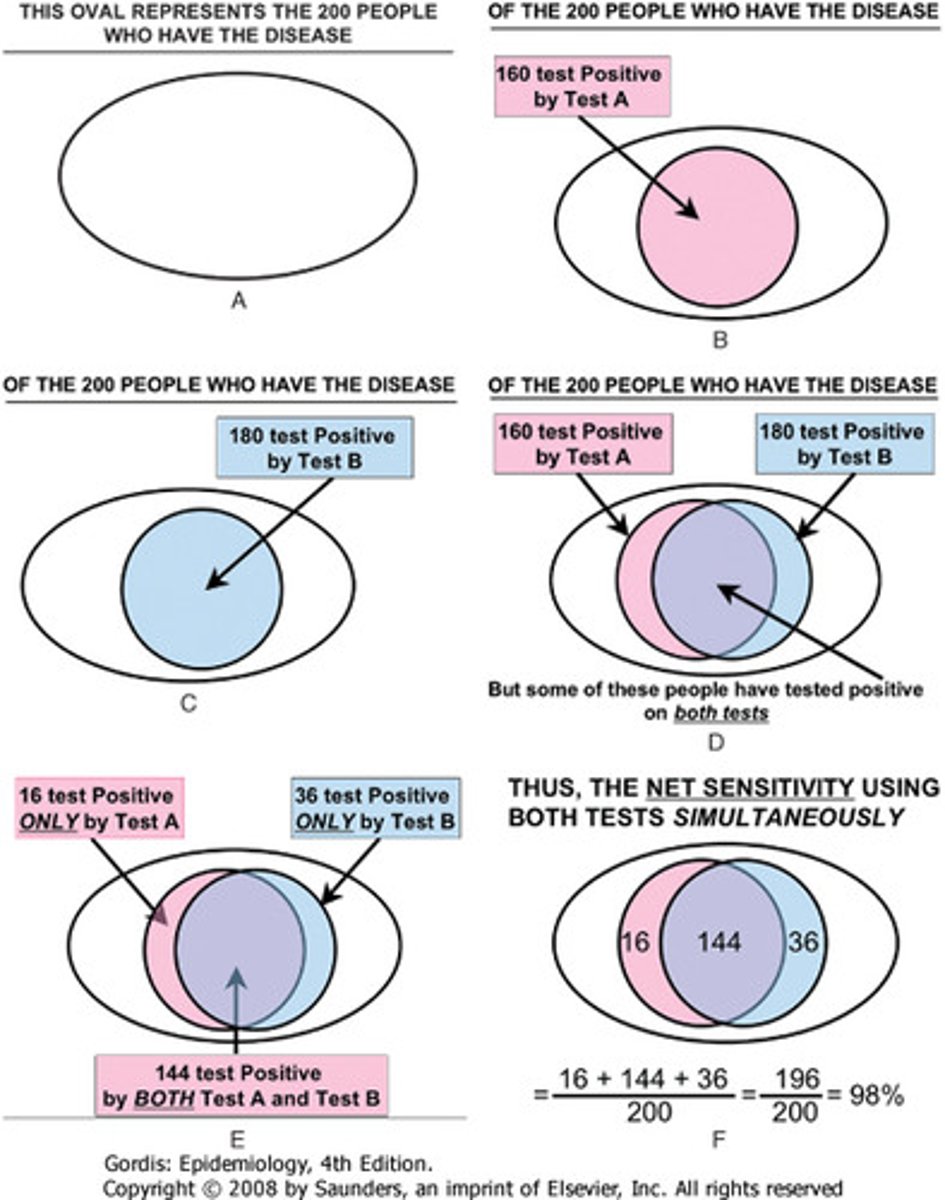
net specificity
in simultaneous testing, must be NEGATIVE in ALL tests to be considered negative (numerator).
(Negatives in both tests) / (People without the Disease)
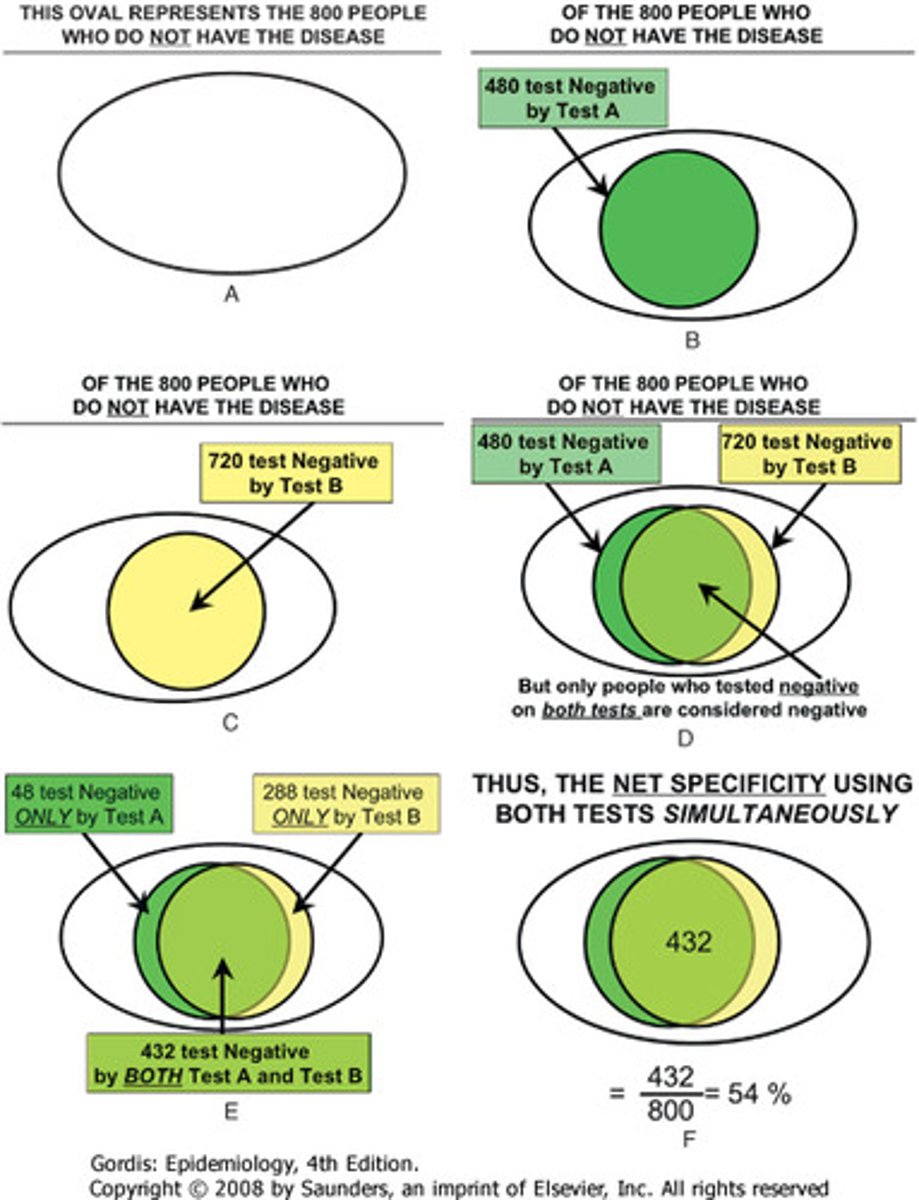
when two ______ tests are used and those who test positive by the first test and brought in for the second test, there is a net loss in ______ but a net gain in ______.
sequential; sensitivity; sensitivity.
when two ______ tests are used, there is a net gain in ________ but a net loss in ______.
simultaneous; sensitivity; specificity.
when should you use sequential testing vs simultaneous testing?
this decision depends on the objectives of testing
this includes whether testing is being done for screening or diagnostic purposes, and on practical considerations related to the setting in which the testing is being done, including the length of hospital stay, costs, and degree of invasiveness of each tests, as well as the extent of third-party insurance coverage.
positive predictive value (PPV) definition and formula
a proportion that helps clinicians answer the question, "what proportion of patients who test positive actually HAVE the disease?"
(True Positives) / (True Positives + False Positives)
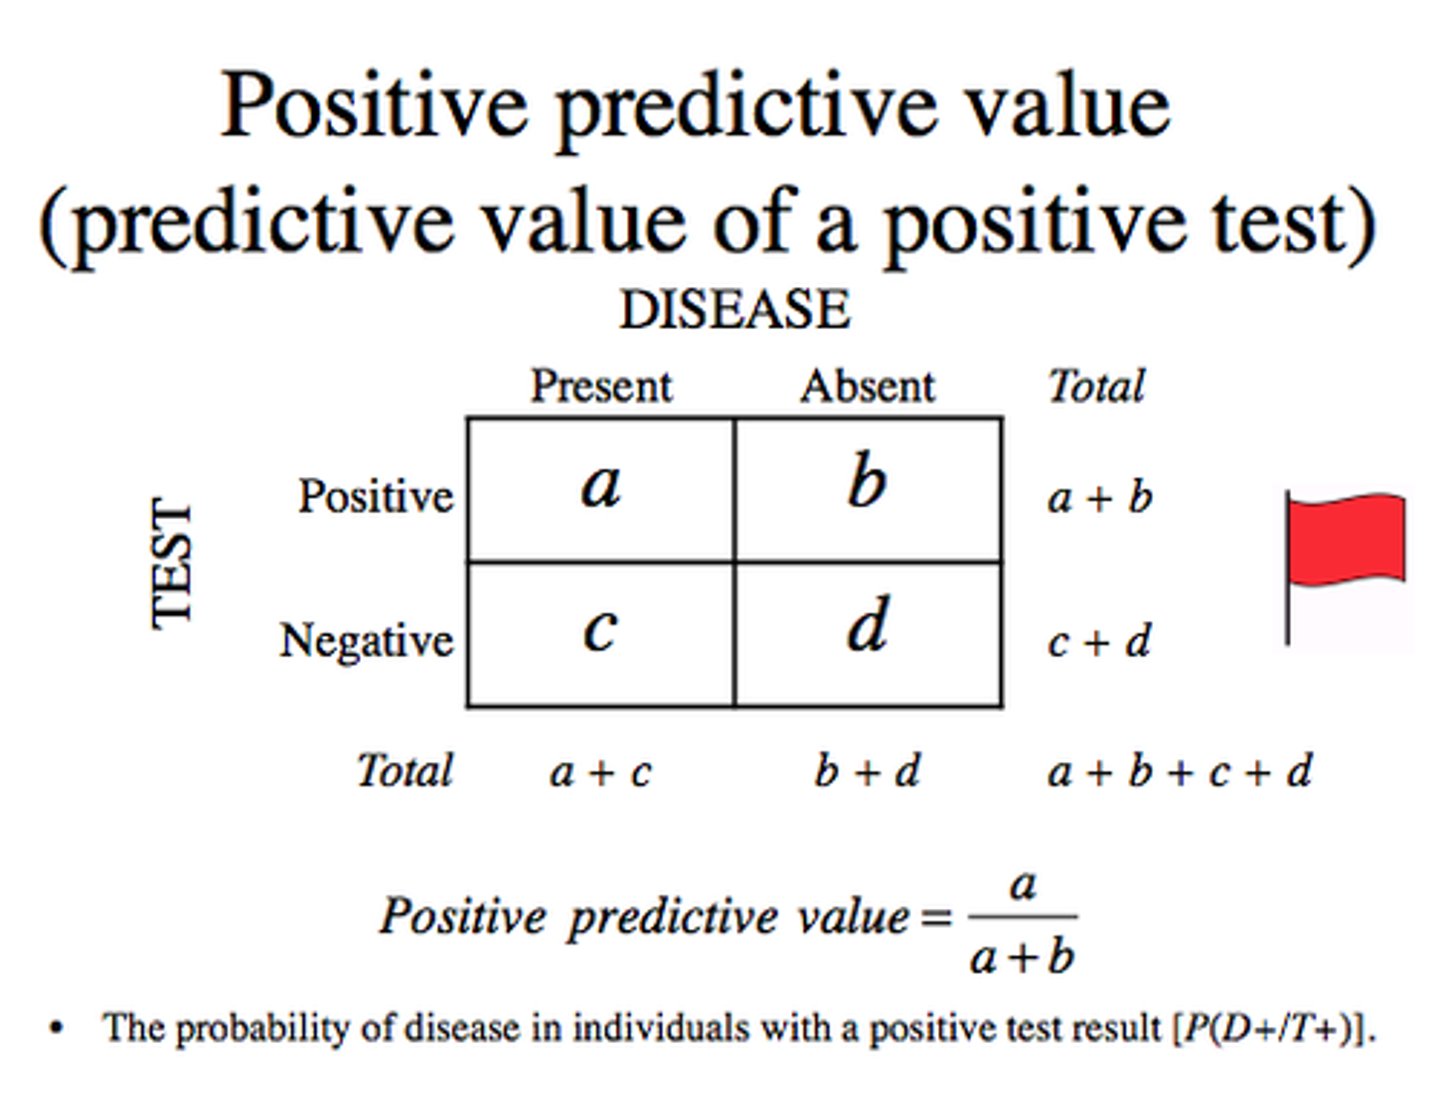
negative predictive value (NPV) definition and formula
a proportion that helps clinicians answer the question, "if the test result is negative, what is the probability that this patient DOES NOT have the disease?"
(True Negatives) / (True Negatives + False Negatives)
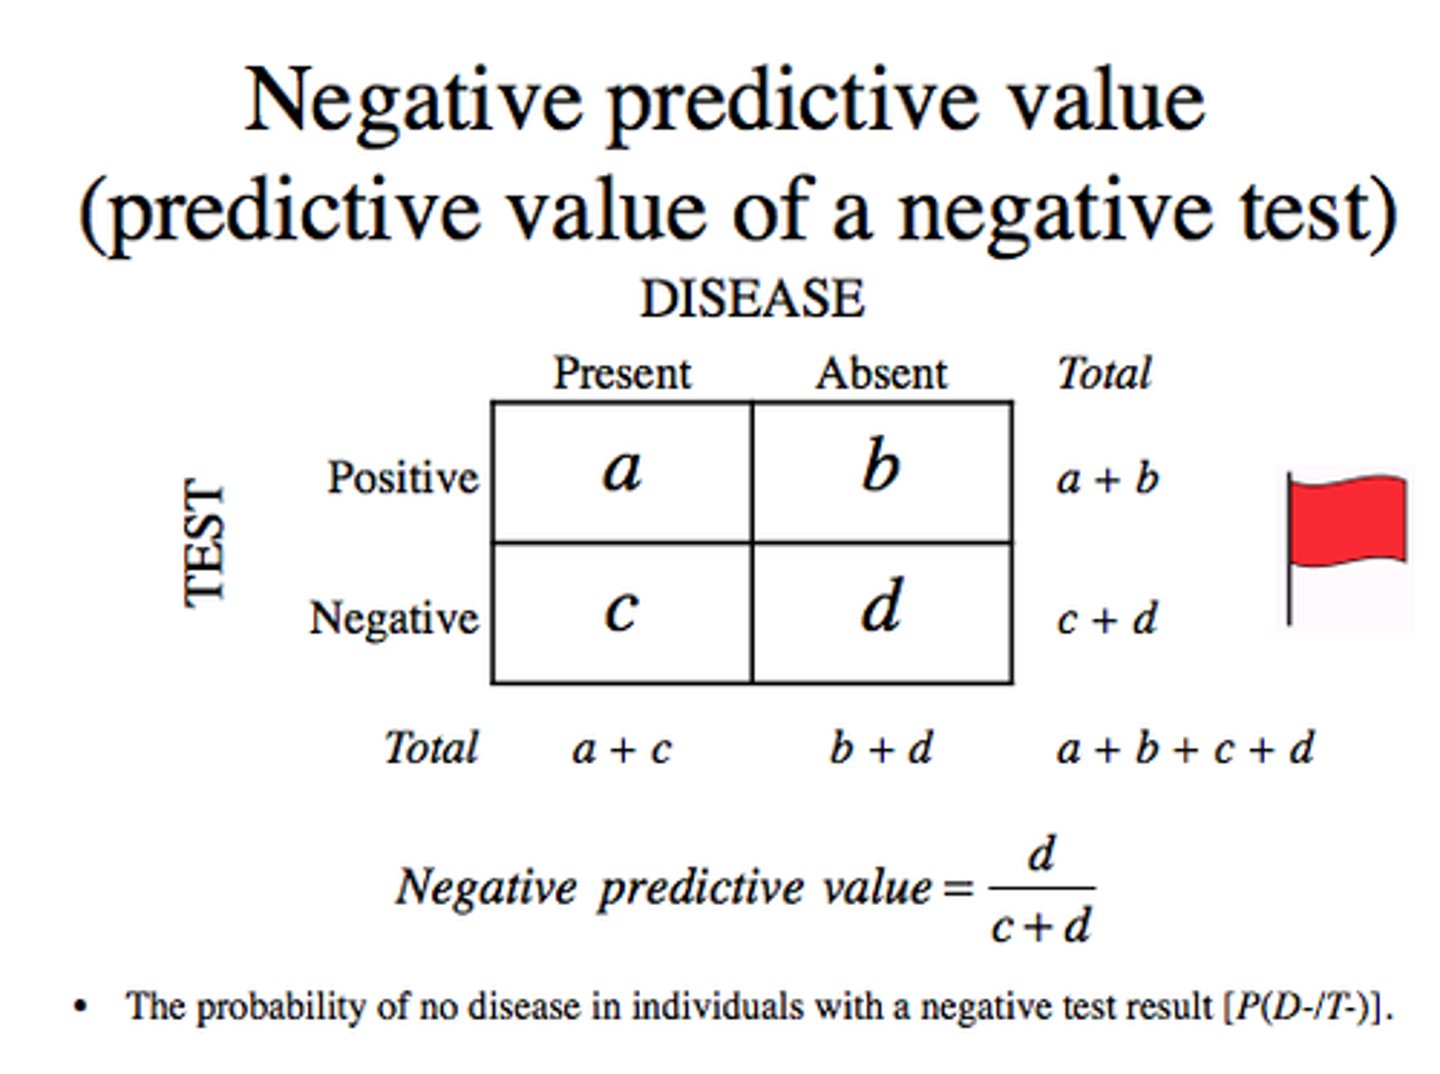
the higher the ______, the higher the PPV.
prevalence
why should we be concerned about the relationship between predictive value and disease prevalence?
a screening program is most productive and more cost effective if it's directed to a high-risk target population.
is it possible for the same test to have very different predictive value when administered to a high risk (aka high prevalence) population or to a low-risk (low prevalence) poplation
yes.
a change in ______ has a greater effect on predictive value than a comparable change in _____.
specificity; sensitivity
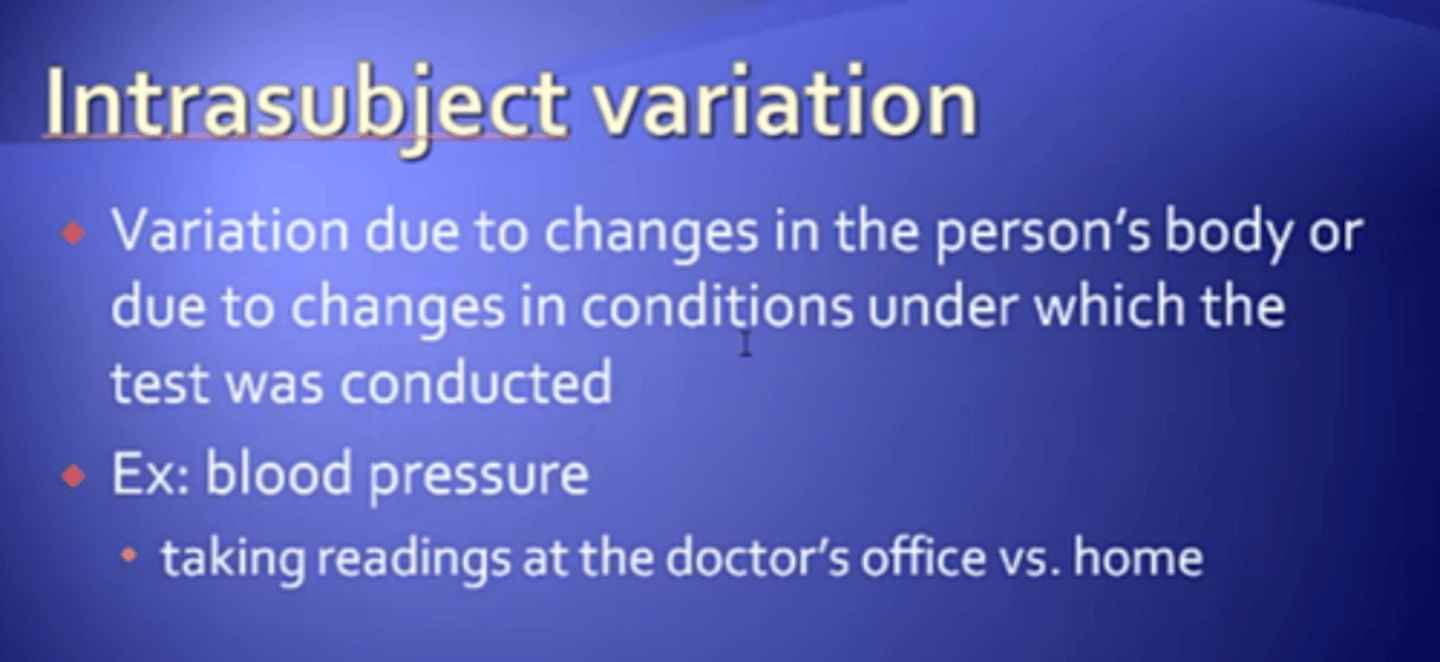
intrasubject variation
variation within individual subjects
e.g. changes in blood pressure readings over a 24-hr interval. changes can be caused by food ate, exercise done, etc.
intraobserver variation
variation occurring between two or more readings of the same test made by the SAME OBSERVER.
interobserver variation
variation between TWO EXAMINERS who do not give the same test results
what percent agreement and why may we disregard cell D?
The proportion of all observations where two (or more) readers agree.
why may disregard cell D because there is likely considerable agreement between the two observers about those negative subjects. this value may be high due to the large number of of clearly negative findings (cell D). thus, the high value may CONCEAL SIGNIFICANT DISAGREEMENT between observers in identifying subjects who are considered positive by at least one observer.
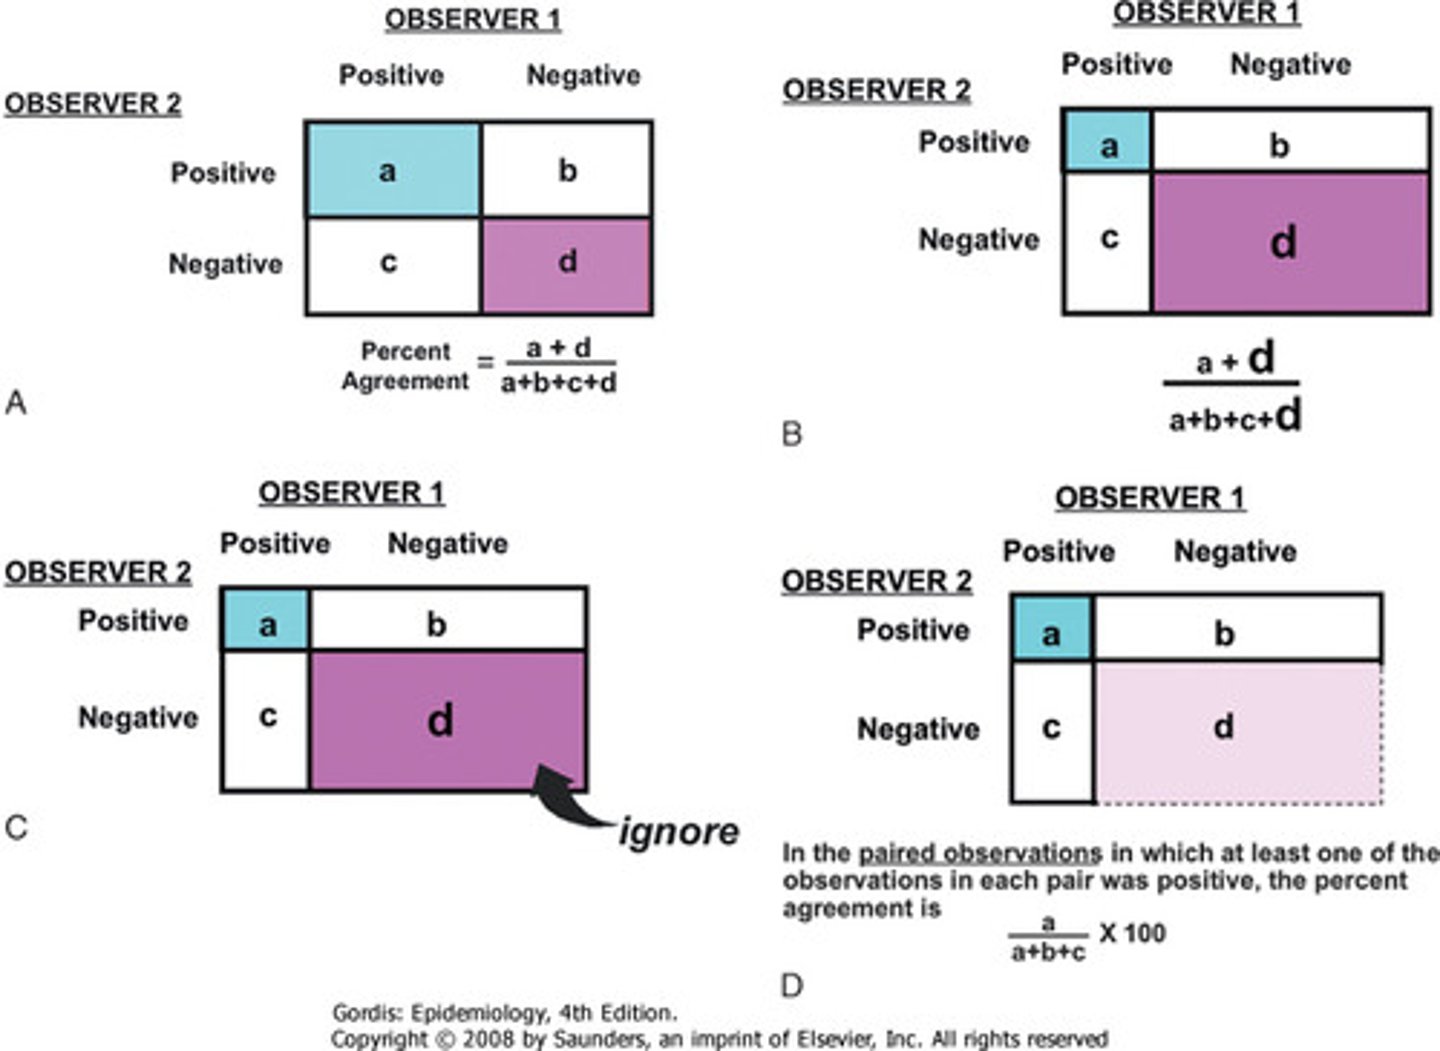
Kappa Statistic definition
A measure of the degree of nonrandom agreement between observers of the same categorical variable. in other words, the best method for assessing the level of agreement among several observers.
we want to answer the question, "To what extent do their readings agree beyond what we would expect by chance alone?"
kappa statistic
see image
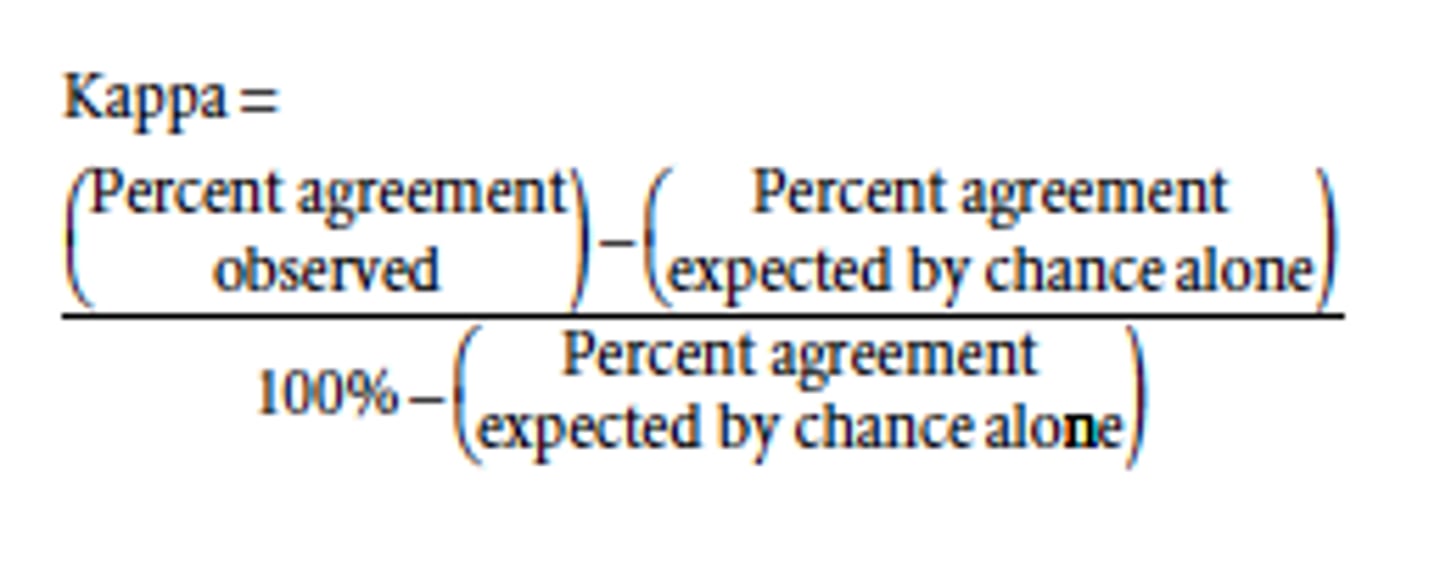
what are the two things you need to calculate the Kappa statistic?
• percent agreement observed
• percent agreement by chance
a kappa greater than _____ represents excellent agreement beyond chance. a kappa below _____ represents poor agreement and a kappa of _____ to _____ represents intermediate to good agreement.
0.75; 0.40; 0.40 to 0.75
when the reliability or repeatability of a test is poor, the ____ of the test for a given individual also may be poor.
validity.
early detection of disease
diagnosing a disease at an earlier stage than would usually occur in standard clinical practice
the disease is being detected at a pre-symptomatic stage, at which the patient has no clinical complaint (no symptoms/signs) and thus, no reason to seek for medical care for the condition
how do we assess the effectiveness of screening programs using outcome measures? (i.e., what are some of the possible outcome measures that might be used?)
1. reduction of mortality in the population screened
2. reduction of case mortality in screened individuals
3. increase in percent of cases detected in earlier stages
4. reduction in complications
5. prevention of OR reduction in recurrences or metastases
6. improvement of quality of life in screened individuals
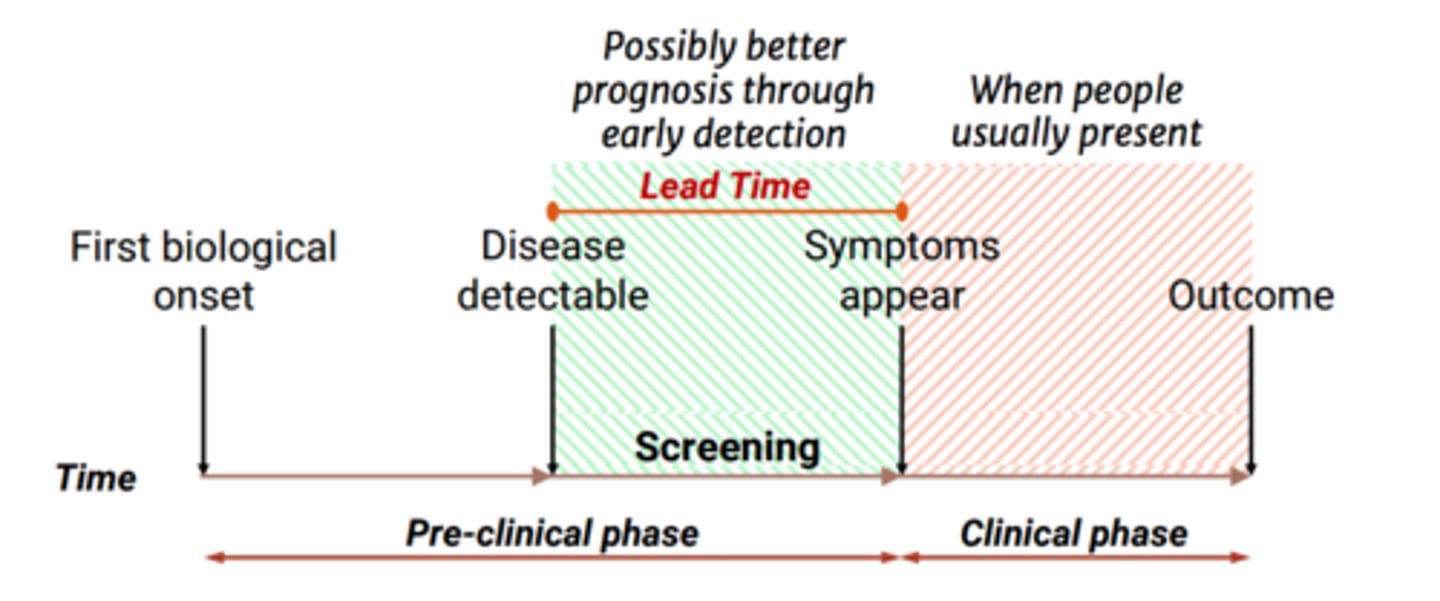
natural history of disease
course or progression of a disease process from onset to resolution
to study image, refer to pg 1027 in Gordis
into what two phases can the period during which a disease is present be divided?
preclinical phase and clinical phase
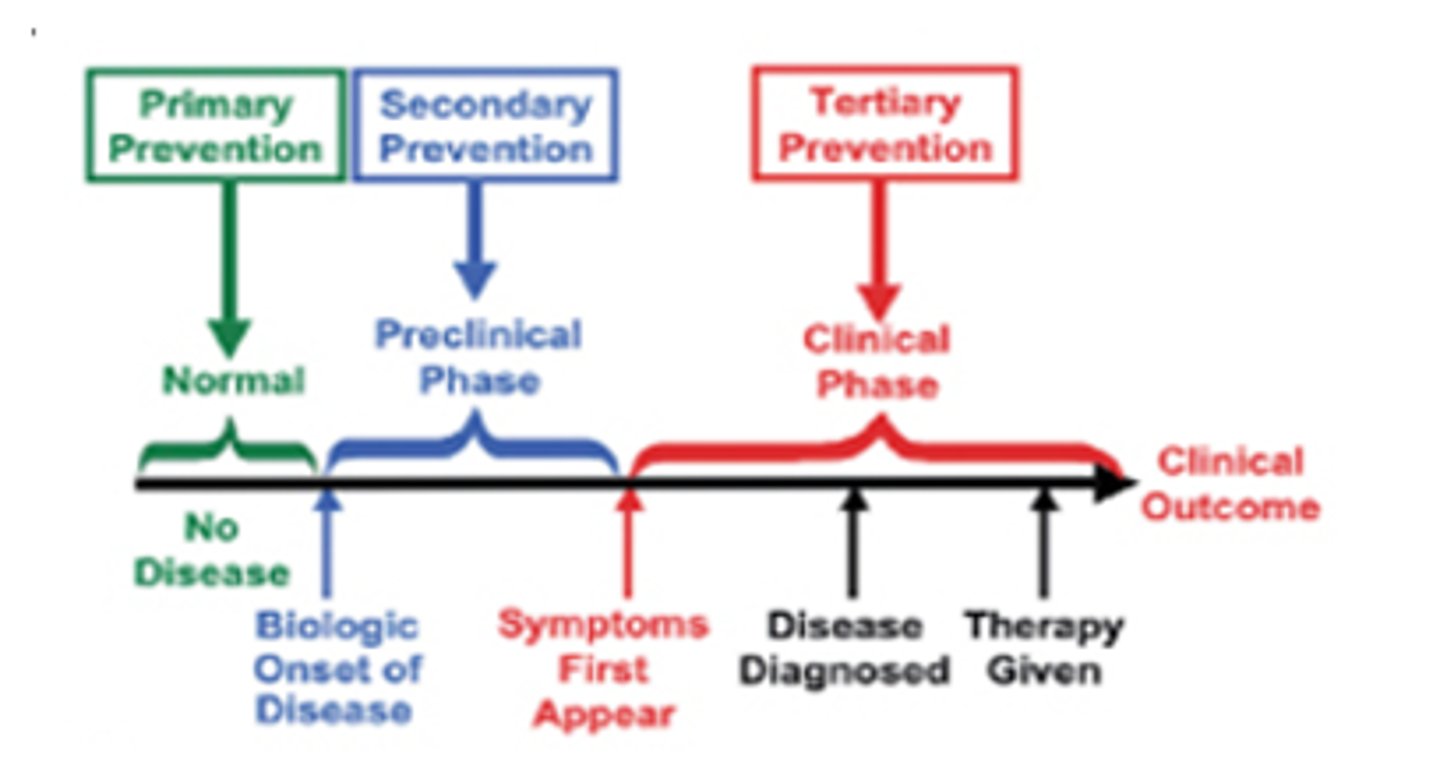
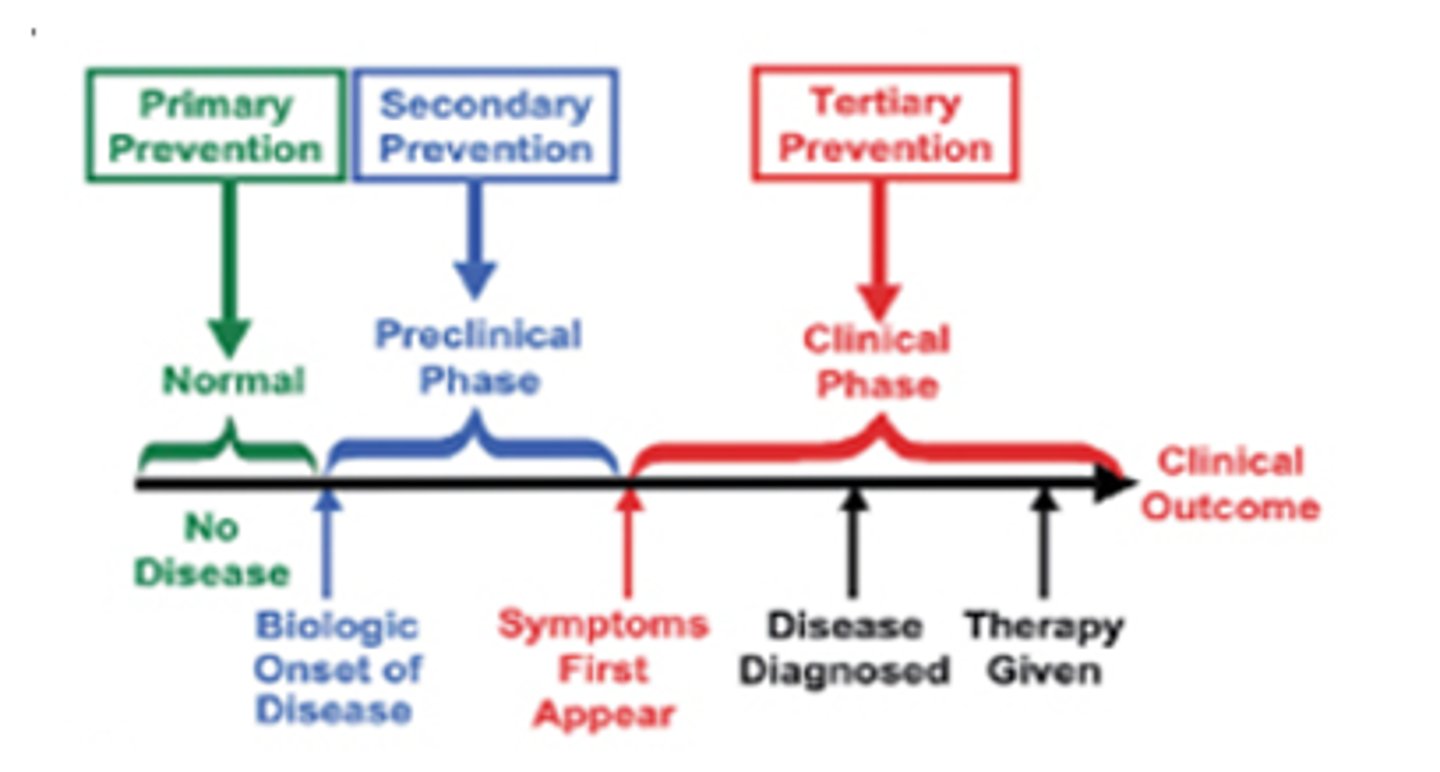
preclinical phase
the period from biologic onset of the disease to the development of signs and symptoms
comes BEFORE the clinical phase; a phase in which disease presence can be divided into
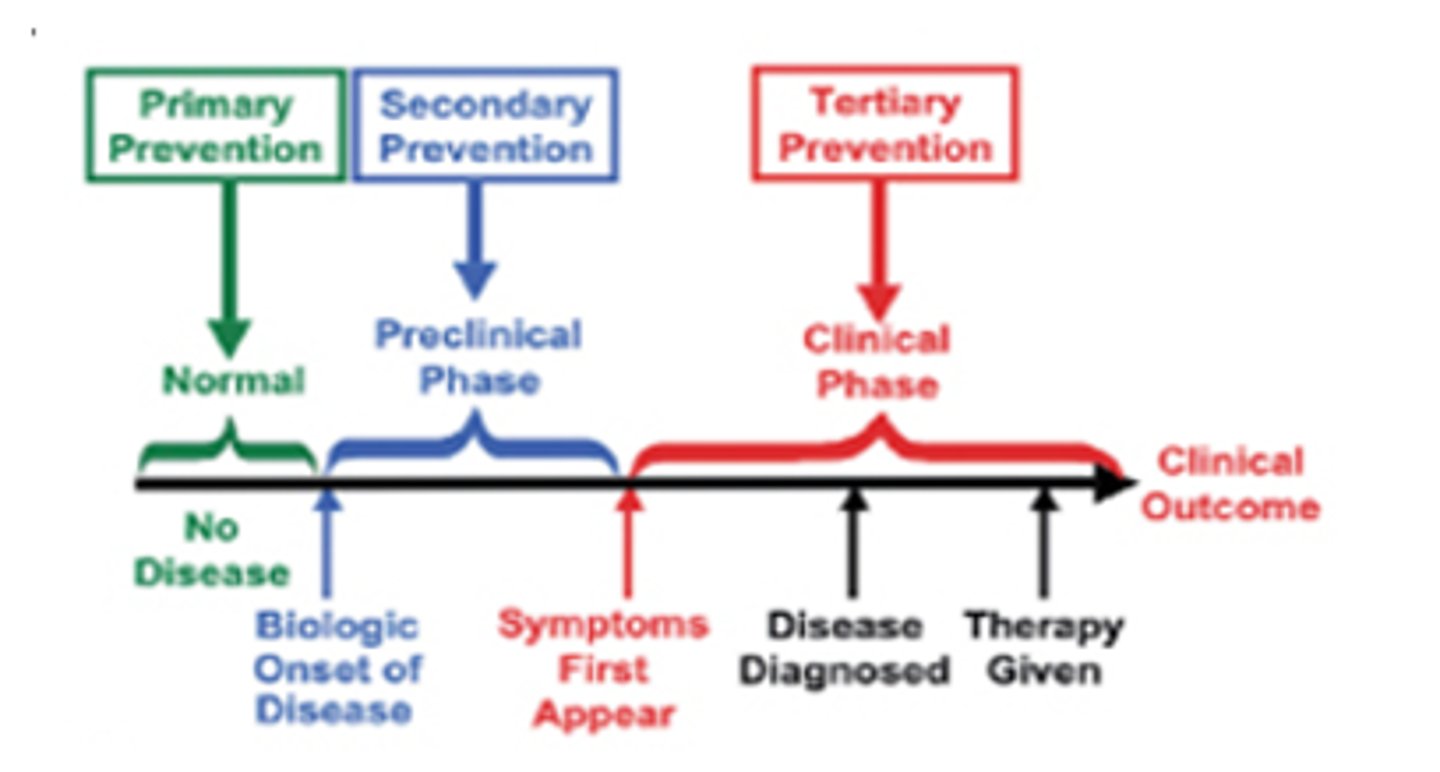
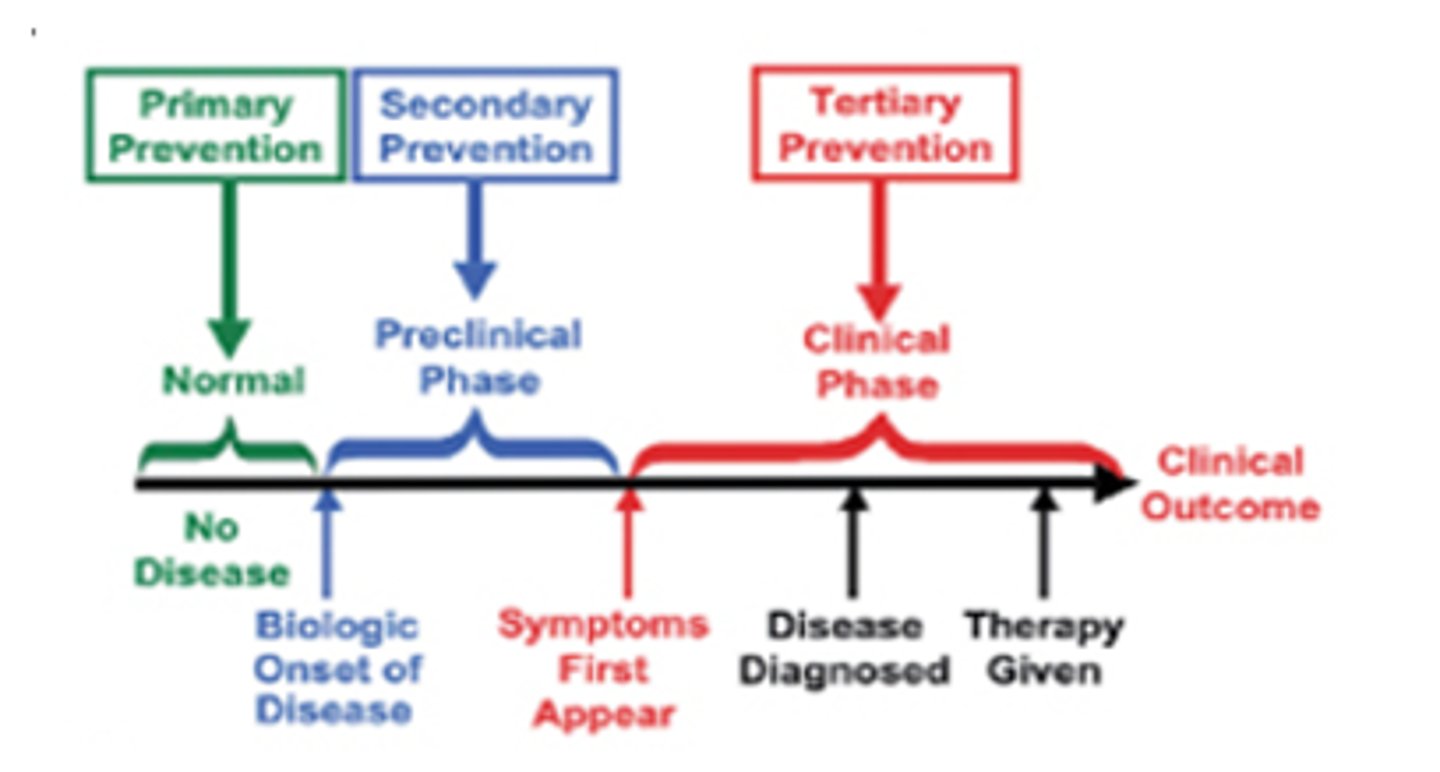
clinical phase
the period from the time when signs and symptoms develop to an ultimate outcome such as possible cure, control of the disease, or death
comes AFTER the preclinical phase
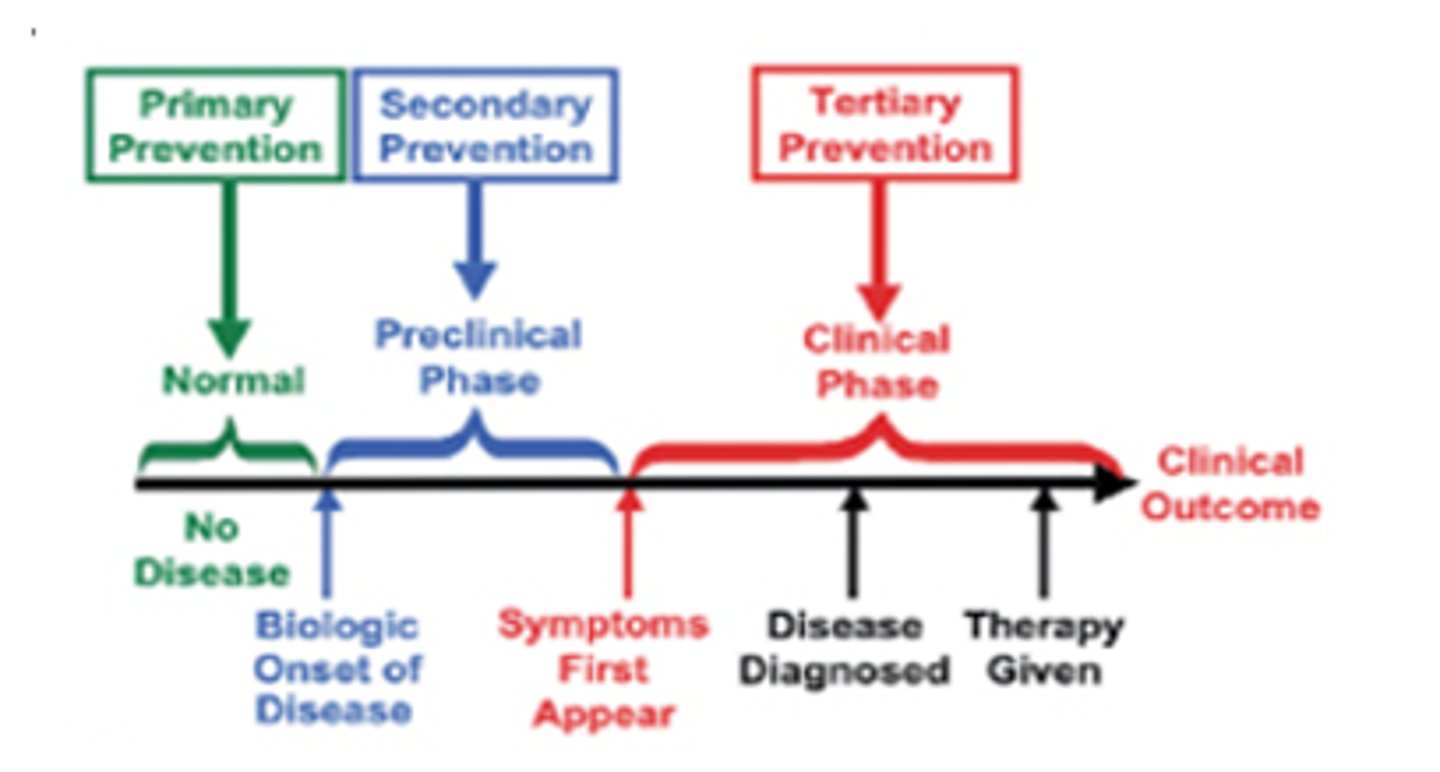
primary prevention
an intervention BEFORE the disease is developed. this is BEFORE the preclinical phase
e.g. immunization and prevention of smoking initiation
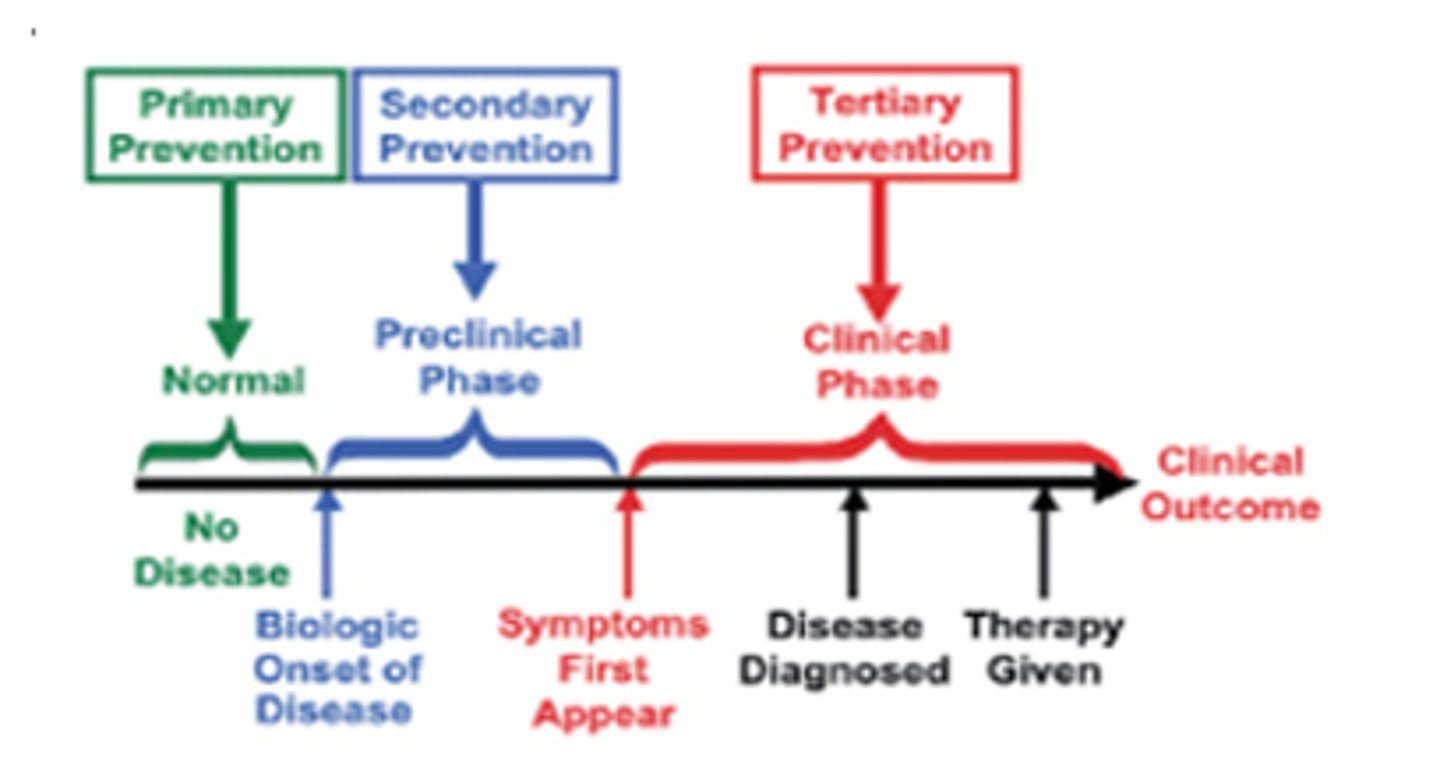
secondary prevention
detecting disease at an earlier stage than usual. takes place DURING the preclinical phase
e.g. screening
tertiary prevention
treating clinically ill individuals to prevent complications of the illness, including death of the patient
e.g. stroke rehabilitation
detectable preclinical phase
point during preclinical phase before symptoms develop but disease can be detected using tests
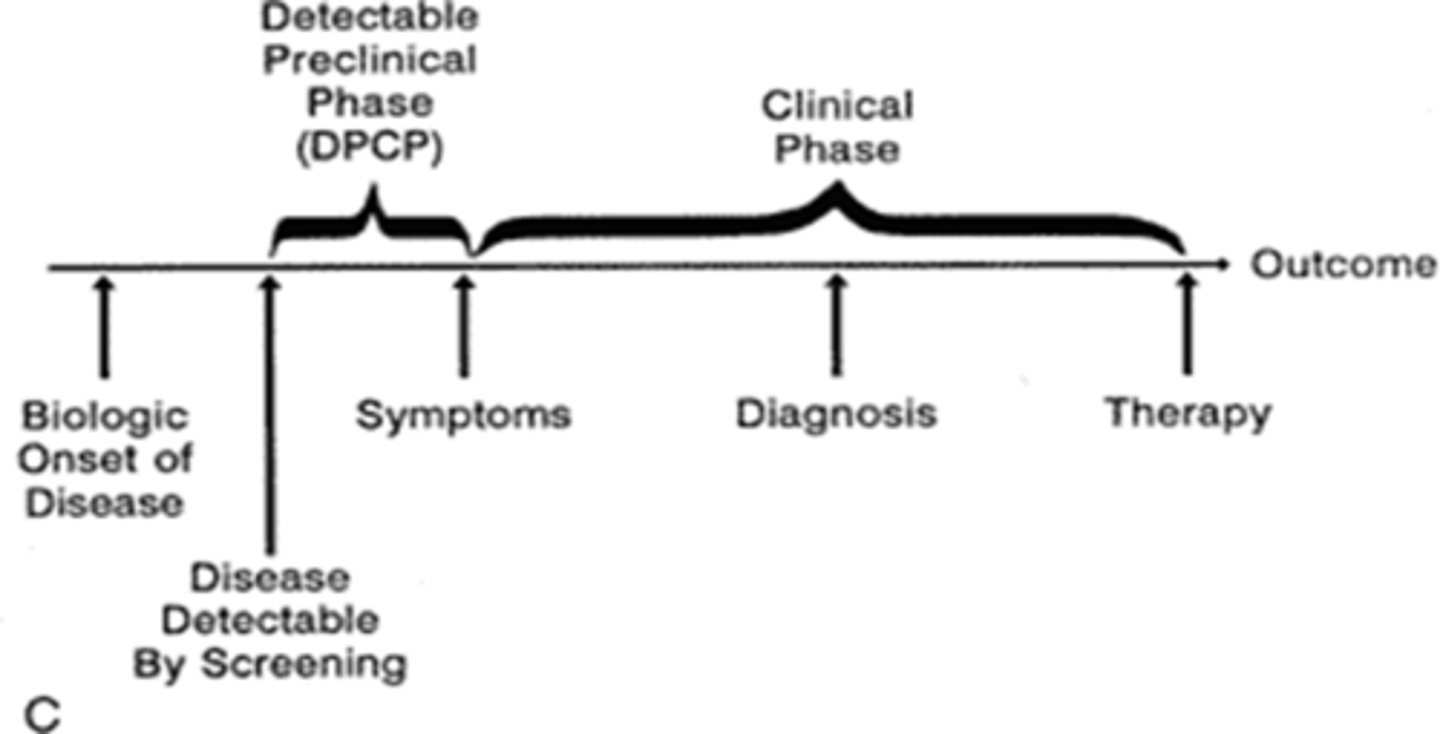
lead time
interval by which the time of diagnosis is advanced by screening and early detection compared to usual time of diagnosis
critical point
a point in natural history before which treatment is more effective and/or less difficult to administer
there can me multiple critical points, which suggests that the earlier the diagnosis, the better the prognosis.
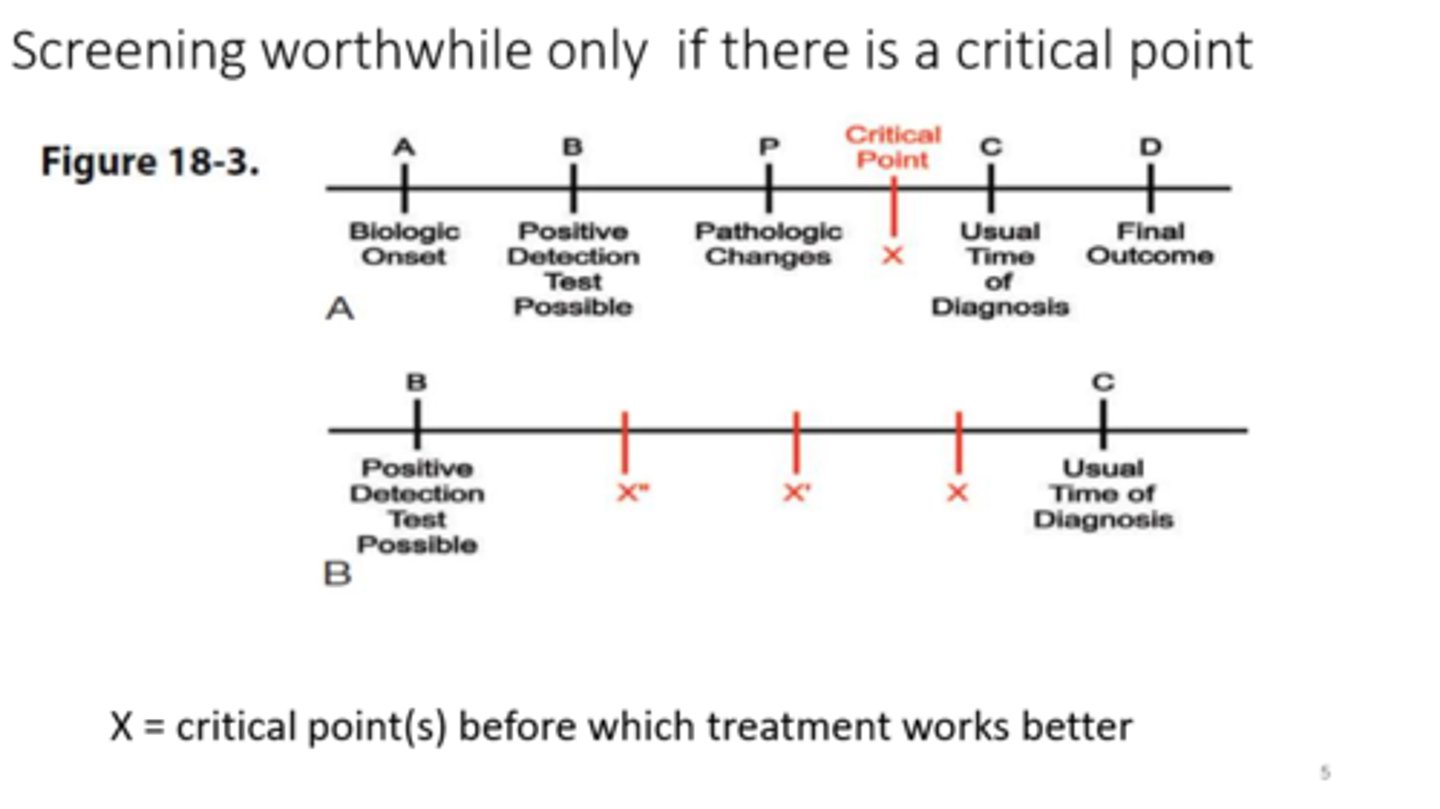
choose the correct words: if we (can/cannot) envision one or more critical points in the natural history of disease, then there is clearly (a/no) rationale for screening and early detection
cannot; no
what are the two assumptions we must hold if we want to see potential benefit from screening and early detection?
1. all or most clinical cases of a disease first go through a detectable preclinical phase
2. in the absence of intervention, all or most cases in a pre-clinical phase progress to a clinical phase
case reports and case series
describes the experience of a single patient or group of patients with similar diagnosis; documenting a comprehensive and detailed description of the case(s) under observation.
this allows other physicians to identify and potentially report similar cases from their practice.
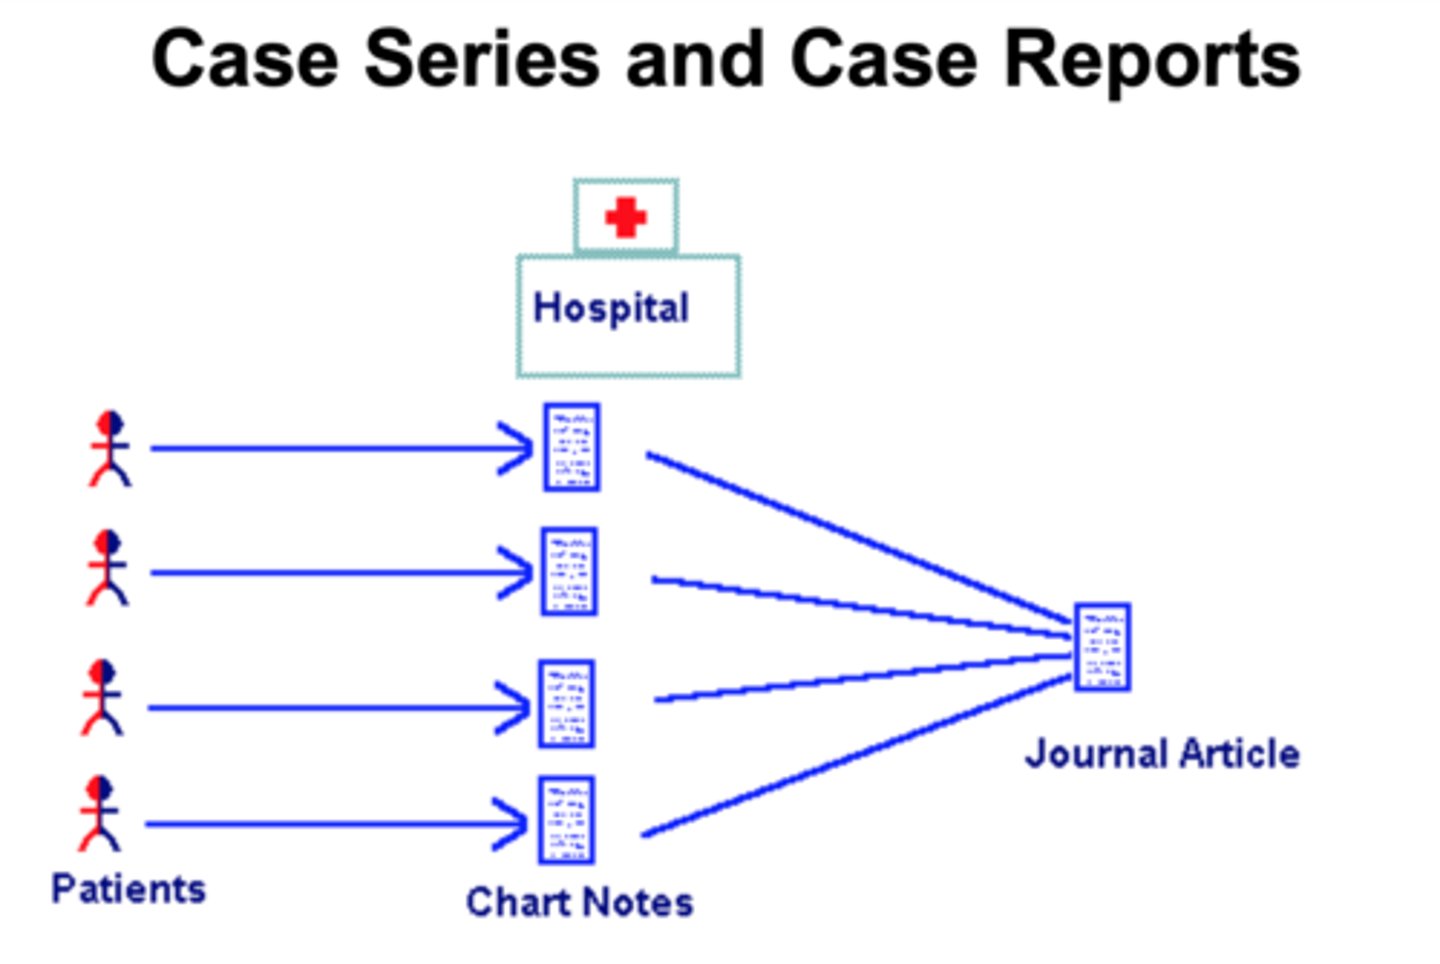
what are the advantages of case reports and case series?
• they are key hypothesis-generating tools, especially when they are simple, inexpensive, and easy to conduct
what are the disadvantages of case reports and case series?
• the lack of comparison group
• external validity (generalizability) is limited, given the possibly biased selection of cases