Analytical Methods Exam 1
 Call Kai
 Learn
 Practice Test
 Spaced Repetition
 Match
 Flashcards
 Knowt Play
1/49

There's no tags or description
Looks like no tags are added yet.
50 Terms
1. A research team wants to record how people walk on a two-kilometer hiking trail, outdoors, over uneven ground. Which measurement system fits that study best?
A. Passive reflective markers and an infrared camera system
B. Force plates
C. An electromagnetic tracking system
D. Wearable inertial measurement units (IMUs)
D
2. A surgeon’s hand has to be tracked inside a cramped operating room, where there is no space to put cameras around the person. Which system fits best, and what is its main weakness?
A. Wearable IMUs, which never drift over time
B. Electromagnetic tracking, which needs no line of sight but is distorted by nearby metal C. Passive reflective markers, which need no cameras
D. Force plates, which measure position without any sensors on the body
A
3. What does a force plate measure directly?
A. The force the ground exerts on the foot
B. The position of the foot in three dimensions
C. The angle of the ankle
D. The acceleration of the body’s center of mass
A
4. During steady walking, the right heel strikes at 2.10 s, the left heel at 2.66 s, and the right heel again at 3.22 s. How long is one stride?
A. 0.28 s
B. 0.56 s
C. 1.12 s
D. 2.24 s
A
5. Late in swing, the knee flexion angle of the class trial falls from about 66 degrees to about 12 degrees. During that time, the knee is
A. flexing
B. in double support
C. extending
D. at heel strike
C
6. A model reports the angle of the shank measured against the laboratory’s vertical axis. Which description is correct?
A. It is a segment angle, because it is measured relative to the laboratory
B. It is a joint angle, because the shank meets the thigh at the knee
C. It is a joint angle, because it is measured in degrees
D. It is a segment angle, because the shank contains only one bone
A
7. In one stride of walking, how many times are both feet on the ground at once, and what happens to those periods when walking becomes running?
A. Never; running adds them
B. Once; running doubles it
C. Twice; running lengthens them
D. Twice; running removes them
D

8. The figure shows the average knee flexion curve of the class trial, built from 212 strides. The shaded band is the mean plus and minus one standard deviation, computed separately at every percent of the cycle. Which statement is correct?
A. Every one of the 212 strides lies inside the band
B. The band is the standard error, so it shows how precisely the average is known
C. The band is measurement noise, which a more precise camera system would remove
D. At any point in the cycle, roughly two thirds of the strides fall inside the band
D
9. A right heel strike is found at sample 4,210 of a file recorded at 200 samples per second, and the next right heel strike at sample 4,442. How long was that stride?
A. 0.43 s
B. 0.86 s
C. 1.16 s
D. 2.32 s
C
10. Kinematics are recorded at 100 samples per second. How much time passes between one sample and the next?
A. 5 ms
B. 10 ms
C. 20 ms
D. 100 ms
B

11. Both plots show the stride intervals of the class trial. Using the bottom plot, about how many strides had an interval between 1.13 and 1.14 s?
A. 20
B. 35
C. 60
D. 75
D

12. Which of these could you learn from the top plot, but not from the bottom plot, however its bins were chosen?
A. Most strides lasted between about 1.12 and 1.15 s
B. The strides became shorter, on average, at about stride 130
C. The average stride lasted about 1.14 s
D. The shortest stride lasted about 1.11 s
B

13. Both plots show the stride intervals of Walker S. Using the bottom plot, how many strides lasted longer than 1.19 s?
A. 2
B. 9
C. 11
D. 27
A

14. Which of these could you learn from the top plot, but not from the bottom plot, however its bins were chosen?
A. Most strides lasted between about 1.13 and 1.19 s
B. The average stride lasted about 1.16 s
C. The strides became longer, on average, after about stride 80
D. The shortest stride lasted about 1.12 s
C
15. When computing a standard deviation by hand, we square each deviation score before adding them up. Why?
A. Because the deviation scores always add up to zero, so their plain sum says nothing about spread
B. To convert the deviations from seconds into seconds squared, the units of the mean
C. Because the formula divides by n − 1 rather than n
D. So that strides far from the mean count for less than strides close to it
A
16. The variance of a walker’s stride intervals is 0.0009 s². What is their standard deviation?
A. 0.00045 s
B. 0.0009 s
C. 0.03 s
D. 0.09 s
C
17. A walker’s 25 stride intervals have a standard deviation of 0.020 s. What is the standard error of their mean?
A. 0.0008 s
B. 0.004 s
C. 0.020 s
D. 0.100 s
B
18. A walker’s standard deviation and standard error are computed from 50 strides. If 200 strides of the same walking had been recorded instead, what would you expect?
A. The standard deviation about the same, and the standard error about half as big
B. Both about half as big
C. The standard deviation about half as big, and the standard error about the same
D. Both about the same
B
19. In R, a short contact signal is stored as
events <- c(0, 0, 1000, 1000, 1000, 0, 0, 1000, 1000) What does which(diff(events) > 0) + 1 return?
A. 2, 7
B. 6
C. 3, 4,
5, 8, 9
D. 3, 8
D
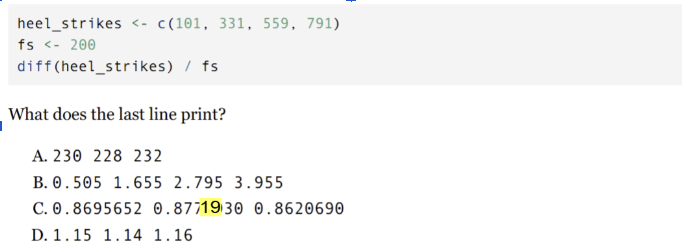
In R,
D
21. A student reads a file whose first row holds the column names:
d <- read.csv("walking_control.csv", header = FALSE)
heel_strikes <- which(diff(dV8)>0)+1 </span></p><p><spanstyle="background−color:transparent;">Thesecondlinestopswitha<em>non−numericargumenttoabinaryoperator</em>.Whatisthebestfix? </span></p><p><span>A. Removeheader=FALSE,sothatRreadsthefirstrowascolumnnames,anduse dLFootContact in place of dV8 </span></p><p><spanstyle="background−color:transparent;">B. Changedifftosum </span></p><p><spanstyle="background−color:transparent;">C. Removethe+1 </span></p><p><spanstyle="background−color:transparent;">D. DividedV8 by 1000 before taking diff
A
22. In 1.1.3 the band around the average curve is drawn with
polygon(c(pct, rev(pct)), c(hi, rev(lo)), col = "grey85", border = NA)
Why are pct and lo reversed?
A. To sort the points from smallest to largest before drawing
B. So the outline runs along the top of the band, left to right, and comes back along the bottom, right to left, closing the shape
C. Because polygon() only accepts decreasing values
D. To flip the band upside down so it sits under the curve
B
23. In 1.1.3, strides is a matrix with 101 rows, one per percent of the gait cycle, and 212 columns, one per stride. What does apply(strides, 1, sd) return?
A. 212 numbers: the standard deviation of each stride across its 101 points
B. 101 numbers: the standard deviation across all strides at each percent of the cycle
C. One number: the standard deviation of every value in the matrix
D. A matrix with 101 rows and 212 columns
B
24. In 1.1.3, strides is a matrix with one row per percent of the gait cycle and one column per stride. What is strides[, 1]?
A. The whole of the first stride, at every percent of the cycle
B. The value at 0 percent of the cycle, for every stride
C. The first value of the matrix only
D. The average of all the strides
A
25. Inside the 1.1.3 loop, each stride is cut out as one, and then
x <- seq(0, 100, length.out = length(one))
strides[, i] <- approx(x, one, xout = pct)$y
where pct is 0, 1, 2, … 100. What does this accomplish?
A. It removes noise from each stride before the strides are averaged
B. It makes every stride last the same number of seconds
C. It finds the heel strikes inside each stride
D. It reads every stride at the same 101 points of its own cycle, so that a row of the matrix is the same moment in every stride, whatever each stride’s length
D
26. Marker positions are measured with about half a millimeter of random error, which is too small to see in a plot of position. Velocity and acceleration are then computed from those positions with central differences. Which statement is true?
A. The error is largest, relative to the true signal, in the acceleration
B. The error is too small to matter in any of the three signals
C. The velocity is noisier than the acceleration, because it is computed first
D. Sampling twice as fast would make the error in the acceleration smaller
A
27. Jerk is the third derivative of position. If position is in meters and time in seconds, what are the units of jerk?
A. m/s
B. m/s²
C. m·s
D. m/s³
D
28. A point moves as x(t) = 0.2 sin(4πt) meters, with t in seconds. What is its velocity, v(t)?
A. 0.8π cos(4πt) m/s
B. 0.2 cos(4πt) m/s
C. −0.8π cos(4πt) m/s
D. 0.8π sin(4πt) m/s
A
29. A point moves as x(t) = 3t² + 2t meters, with t in seconds. What is its velocity at t = 2 s?
A. 8 m/s
B. 12 m/s
C. 14 m/s
D. 16 m/s
C
30. A heel marker is recorded 100 times per second. Three consecutive positions are 0.20, 0.23 and 0.27 m. Using the central difference, what is the velocity at the middle sample?
A. 0.035 m/s
B. 3.0 m/s
C. 3.5 m/s
D. 4.0 m/s
C
31. At 200 samples per second, a forward difference is plotted at the sample it was computed for, sample i. By how much does it run early?
A. 0 ms
B. 1.25 ms
C. 2.5 ms
D. 5 ms
C
32. A heel marker has 1,000 samples. After the central difference, padded with NA as on slide 30 of 1.2.1, how many of the velocities are not NA?
A. 996
B. 998
C. 999
D. 1,000
B
33. x is a position, sample by sample, and dt is the time between samples. Which line gives the forward difference, the same length as x, so that it lines up with x sample for sample?
A. v <- c(diff(x) / dt, NA) ← forward diff eq
B. v <- c(NA, diff(x) / dt) ← backward diff eq
C. v <- diff(x) / dt ← there is NO n/a
D. v <- c(NA, diff(x) / dt, NA) ← cental diff eq
A

34. The top panel is one cycle of knee flexion from the class trial, and the bottom panel is its angular velocity, found with the central difference. At which lettered point is the knee straightening fastest?
A. Point A
B. Point B
C. Point C
D. Point D
B
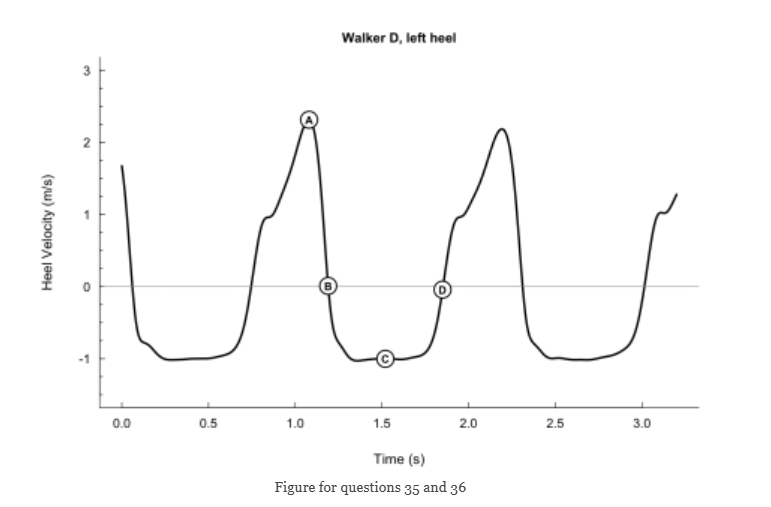
35. The figure shows the forward velocity of a heel marker of a person walking on a treadmill, found with the central difference. Which lettered point marks the moment the foot contacts the belt?
A. Point A
B. Point B
C. Point C
D. Point D
B

36. Using the same figure, about how fast is the treadmill belt moving?
A. 0 m/s
B. 0.5 m/s
C. 1.0 m/s
D.2.3 m/s
C

Label each letter
Word bank: foot contact, toe-off, loading-response peak, swing peak, the knee at its straightest in stance, stance phase, swing phase, double support, mid-swing
A: Loading response peak
B: Swing peak
C: The knee at its straightest in the stance
D: Toe off
E: Foot Contact
F: Stance Phase
G: Swing Phase

Review this

39. The figure shows the foot contact signals of both feet of one walker, in the format used in class: 1000 while the foot is on the ground and 0 while it is in the air. Name what each letter marks. A, B, C, D and G are spans of time; E and F are single moments.
Terms: stride, step, double support, single support, stance phase of the left foot, swing phase of the left foot, heel strike of the left foot, heel strike of the right foot, toe-off of the left foot, toe-off of the right foot
A: Stride
B: Step
C: Double support
D: Single support
E: Toe off L foot
F: Heel strike R foot
G: Swing phase of left foot

40. The four panels are a heel marker’s forward position and its first three derivatives, for a person walking on a treadmill, in some order. The axis titles have been removed.
a. Name the signal in each panel, with its units.
b. Name what happens to the foot at the moments marked P and Q.
Terms for a: position, velocity, acceleration, jerk; m, m/s, m/s², m/s³. Terms for b: foot contact, the heel leaves the belt, mid-swing, toe-off
1 - Position
2 - Velocity
3 - Acceleration
4 - Jerk
P - Mid swing
Q - Foot contact
In one sentence each: what does the standard deviation describe, and what does the standard error describe?
The standard deviation is the average distance each measurement sits from the
mean of the entire distribution, indicating spread. Standard Error is the precision and uncertainty of a sample statistic
Mean
x = (1/n) sigma/sum sum
Standard error of the mean
SE = s / √n
Standard Deviation
s = √[ Σ (xᵢ − x)² / (n − 1) ] ̄
Sampling rate from a time column
sampling rate = (N − 1) / (last time − first time), and Δt = 1 / sampling rate
Forward Difference
vᵢ ≈ (xᵢ₊₁ − xᵢ) / Δt
Backward Difference
vᵢ ≈ (xᵢ − xᵢ₋₁) / Δt
Central Difference
vᵢ ≈ (xᵢ₊₁ − xᵢ₋₁) / (2Δt)
Second Central Difference
aᵢ ≈ (xᵢ₊₁ − 2xᵢ + xᵢ₋₁) / Δt²
Write the R that turns the vector heel_strikes into stride_seconds.
stride_samples <- diff((heel_strikes)
stride_seconds <- stride_samples / fs