ECON 265 (Ch. 1 & 2 Study Set)
 Call Kai
 Learn
 Practice Test
 Spaced Repetition
 Match
 Flashcards
 Knowt Play
1/35

Earn XP
Description and Tags
36 Terms
True or False: Statistics are derived from a sample of data drawn from the population of interest.
True
__________ Statistics is the branch of statistics that involves using a subset of available data to make conclusions, estimations, or decisions about the larger data set.
Population
Estimative
Descriptive
Inferential
Inferential
True or False: A parameter is a numerical measure, which has been derived from the full set of population data, summarizing some attribute of a population.
True
True or False: A nutrition supplement company has created an herbal treatment for high blood pressure. It plans to conduct a series of double-blind clinical trials to determine if the supplement is effective at reducing blood pressure in hypertensive patients. In this situation, it is not possible for the company to test the supplement on every hypertensive person in the population.
True
True or False: A journalist is interested in the work habits of all successful CEOs, so he surveyed a random selection of 100 successful CEOs. Among other things, the survey asked about the number of hours each CEO devoted to work per week. The work-hours data taken from this survey is an example of sample data, which is used to obtain information about a population of interest.
True
True or False: The owner of a professional basketball team reports that the average salary for the athletes in the league this past year was $4,580,000. This average was calculated using every player's salary from the previous year. This average is an example of a population parameter.
True
True or False: A television producer for a cable sports channel is interested in the proportion of positive tweets directed at her channel's daily soccer show since its debut. An intern compiles every tweet directed at the show since its inception, and it is determined that 52% of the tweets were positive. This proportion is an example of a population parameter.
True
True or False: Discrete data often result from counting the number of items belonging to a set.
True
True or False: Inferential statistics is a branch of statistics that involves using a complete set of data to make conclusions, estimations, or decisions about a different, complete set of data.
Group starts
False
True or False: A fashion designer organizes the results of a study on fall color trends into a pie chart. This action fits under the umbrella of inferential statistics.
False
Statistics is a science that deals with the collection, organization, and ____________ of data.
Interpretation
Analysis
Presentation
All of the above
All of the above
True or False: Inferential statistics is the branch of statistics that involves using a subset of available data to make conclusions, estimations, or decisions about the larger data set.
True
True or False: Statistics is usually divided into two categories: descriptive and inferential statistics.
True
Statistics is a science that deals with which of the following with regard to data?
Collection and Organization
Interpretation
Presentation and Analysis
All of the above
All of the above
True or False: Statistics is a science that deals with the collection, organization, presentation, analysis, and interpretation of data.
True
A _____________ is a numerical measure summarizing some attribute of a set of sample data.
Both parameter & population
Statistic
Parameter
Population
Statistic
True or False: A frequency distribution groups qualitative data into categories called classes and shows the number of observations belonging to each class.
True
True or False: Relative class frequency is the fraction or proportion of observations that occur within a class.
True
A coffee shop wants to know the relative popularity of different sizes for its drinks. A sample of drink orders has been organized into a frequency table. Use the table below to find the relative frequency for drink orders in a size small.
Size → Frequency
Small → 12
Medium → 12
Large → 23
What is the relative frequency for drinks orders in a size small?
Relative frequency for drink orders in a size small = .120
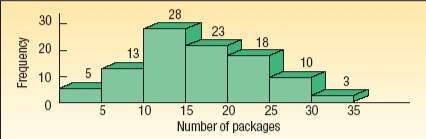
Molly's Candle Shop has several retail stores in the coastal areas of North and South Carolina. Many of Molly's customers ask her to ship their purchases. The following chart shows the number of packages shipped per day for the last 100 days.
A. What is the chart called?
Histogram
Bar chart
Frequency polygon
Histogram
B. What is the total number of frequencies?
Frequencies = 100
C. What is the class interval?
5
D. What is the class frequency of the 10 up to 15 class?
Class frequency = 28
E. What is the relative frequency of the 10 up to 15 class?
Relative frequency = 0.28
F. What is the midpoint of the 25 up to 30 class?
Midpoint= 27.5
G. On how many days were there 25 or more packages shipped?
Number of days = 13
Refer to the following frequency distribution on days absent during a calendar year by employees of a manufacturing company:
Days Absent | Number of Employees |
32 up to 37 | 63 |
37 up to 42 | 37 |
42 up to 47 | 10 |
47 up to 52 | 4 |
52 up to 57 | 2 |
How many employees were absent fewer than fourty two days?
51
100
37
63
100
Refer to the following distribution of commissions:
Monthly commissions | Class Frequencies |
$600-$800 | 8 |
800-1000 | 8 |
1000-1200 | 14 |
1200-1400 | 20 |
1400-1600 | 24 |
1600-1800 | 29 |
1800-2000 | 34 |
2000-2200 | 37 |
What is the relative frequency of those salespersons that earn $1,600 or more?
57.5%
43.1%
24.1%
57.5%
A group of 100 students was surveyed about their interest in a new International Studies program. Interest was measured in terms of high, medium, or low. 21 students responded high interest; 30 students responded medium interest; 49 students responded low interest. What is the relative frequency of students with high interest?
.21
.49
.30
Cannot be determined
.21
A frequency _____________ is used to organize numerical data, while a frequency ______________ is used to organize qualitative data.
table; category
category; distribution
distribution; table
table; distribution
distribution; table
A ____________ organizes categorical data into an easy-to-read format the shows the number of observations in each class.
Pie chart
Nominal chart
Frequency table
Frequency table
_________________ indicate the proportion of subjects that fall into each class of a frequency table. To calculate them, we divide the class frequency by the sum of all the frequencies.
Standardized frequencies
Frequencies
Class frequencies
Relative frequencies
Relative frequencies
A designer sells a scarf in three different colors. In order to understand the sales of the colors of the scarf, the designer's team could create a _______________.
Scatter plot
Frequency chart
Category table
Frequency table
Frequency table
A travel agency has surveyed 50 customers regarding what their preferred vacation destination would be: the beach, the mountains, a big city or taking a cruise. The results are shown below.
Customer | Preferred Destination |
1 | Beach |
2 | Cruise |
3 | Beach |
4 | Mountains |
5 | Beach |
6 | Big City |
7 | Cruise |
8 | Mountains |
9 | Beach |
10 | Beach |
11 | Beach |
12 | Mountains |
13 | Cruise |
14 | Mountains |
15 | Big City |
16 | Mountains |
17 | Cruise |
18 | Cruise |
19 | Beach |
20 | Mountains |
21 | Beach |
22 | Beach |
23 | Cruise |
24 | Beach |
25 | Mountains |
26 | Beach |
27 | Beach |
28 | Mountains |
29 | Beach |
30 | Beach |
31 | Beach |
32 | Big City |
33 | Cruise |
34 | Mountains |
35 | Big City |
36 | Beach |
37 | Mountains |
38 | Cruise |
39 | Cruise |
40 | Mountains |
41 | Big City |
42 | Beach |
43 | Mountains |
44 | Beach |
45 | Mountains |
46 | Cruise |
47 | Mountains |
48 | Big City |
49 | Big City |
50 | Mountains |
A. Complete the frequency table below using this data
Enter your frequencies as whole numbers. Round your relative frequencies to two decimal places.
Preference | Frequency | Relative Frequency |
Beach | 18 | .36 |
Mountains | 15 | .30 |
Big City | 7 | .14 |
Cruise | 10 | .20 |
Total | 50 | 1.00 |
B. Based on these results, which vacation destination was most popular among the customers surveyed?
Mountains
Cruise
Beach
Big City
Beach
C. Based on these results, which vacation destination was least popular among the customers surveyed?
Mountains
Beach
Big City
Cruise
Big City