F-Tests and Model Comparison
 Call Kai
 Learn
 Practice Test
 Spaced Repetition
 Match
 Flashcards
 Knowt Play
1/30

Earn XP
Description and Tags
Use of F and incremental F-tests, running and interpreting F-tests in R, using model comparisons to test different types of questions, difference between nested and non-nested models (and the appropriate statistics to use for comparison in each case)
31 Terms
What are some indications that the model might be significant (combination of xs significantly improve prediction of y, compared to not having any predictors)? What is the drawback of these indicators?
Slopes for individual predictors/betas associated with significant p-values
High R²
BUT don’t directly show model significance
What can be used to directly test the significance of the model as a whole?
F-test (use in combo with betas + R²)
What is an F-test?
Involves testing the stats significance of a test-statistic → F-ratio
What is the F-ratio?
Tests H0 that all the regression slopes in a model are 0
Ratio of explained to unexplained variance → how much of the variance is explained by the model (per parameter) VS how much of the variation is unexplained (per remaining df)
Compares 2 models → specified VS an intercept-only model (no IVs where the model’s predictions = mean of the outcome)
Predictors tells us nothing about our outcome → explain no variance
More variance our predictors explain compared to residual variance = bigger F-ratio = better fitting models
Always positive
What is the F-ratio compared to? What does this obtain?
F-distribution → p-value
What is the formula for the F-ratio?
Sums of squares of model = how much variability is explained by our model by having these lines/planes that explain the variance
Sum of squares residual = how much variability there is that's random/uncontrolled (how much each data point differs from the predicted value based on the model)
Mean squares (MS) = sums of squares calculations divided by associated df

How can F-ratio be interpreted?
High value (>1) = more variant being explained by the model than by the random variation in the residual
Used to show that model is explaining variability
Low value (<1) = more random variation than is being explained by the model

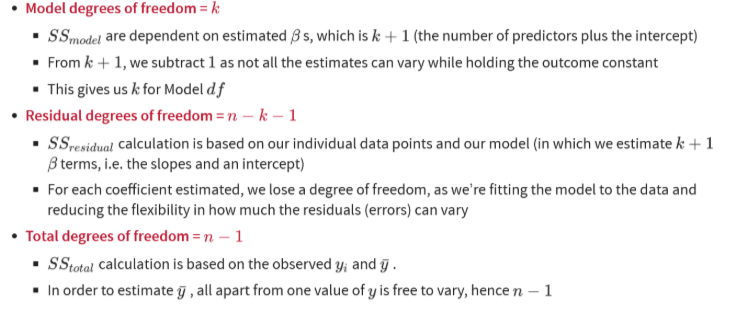
What are degrees of freedom?
The number of independent values associated with the different calculations
How many values in the calculation can vary, if we keep the outcome of the calculation fixed
Typically linked to:
Amount of data (e.g. n)
Number of things you need to calculate/estimate based on that data (e.g. betas)
How is the significance of F tested?
Select alpha level
Identify proper null F-distribution + calculate critical value of F associated with chosen level of alpha
Compare F-stat to critical value
More extreme F-stat than critical value = significant
What needs to be considered for the F-statistic?
DFmodel
In (), this is shown before DF residual
DFresidual

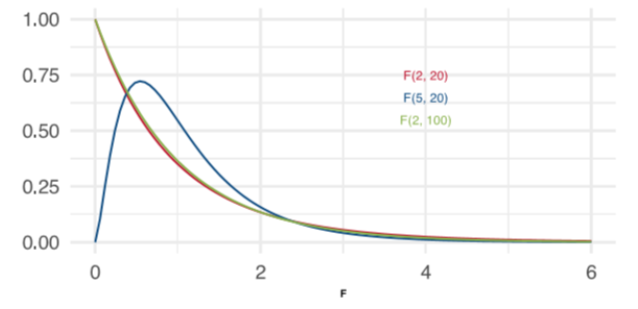
What does the F-distribution change shape based on?
df
What is the code for analysing the significance of F in R?

What is the difference between questions being asked for F-tests, t-tests of beta estimates, and model comparisons?
F-test → is our overall model better than nothing?
T-tests of beta estimates → which variables, specifically, are good predictors of the outcome variable?
Model comparison → when I make a change to my model (e.g. add predictors), does it improve or not?
OR is a model with X1, X2 + X3 as predictors better than the model with just X1?
How do model comparisons determine whether models improve when predictors are added?
We can look at the combined performance of a subset of predictors
In what circumstances are model comparisons not useful? Why?
When comparing 2 models that only differ in 1 parameter → significance test for that parameter tells you the same info
When choosing what predictors to include in a model
Should include predictors that are theoretically motivated by your RQ + required to control for confounds
Don’t remove predictors just because they’re non-significant or don’t significantly improve the fit of the model
When is model comparison useful?
When you want to test the combined impact of multiple predictors
What is an incremental F-test?
Way of thinking about the F-test + F-ratio as an incremental test against an empty/null model
Comparing 2 models that contain fewer/more predictors → difference in F-values between said models
Evaluates the stat significance of the improvement in variance explained in an outcome with the addition of further predictor(s)
What is an empty/null model?
Linear model with only the intercept
Predicted value of the outcome for every case in the data set = mean of the outcome (all beta = 0 → H0 of the F-test)
No predictors → no info that may help us predict the outcome → will be “least wrong” by guessing the mean of the outcome
What is a full model in an incremental F-test?
Model with additional predictors (little F)
What is a restricted model in an incremental F-test?
Model without additional predictors (little R)
What is the formula for an incremental F-test (model comparison)?

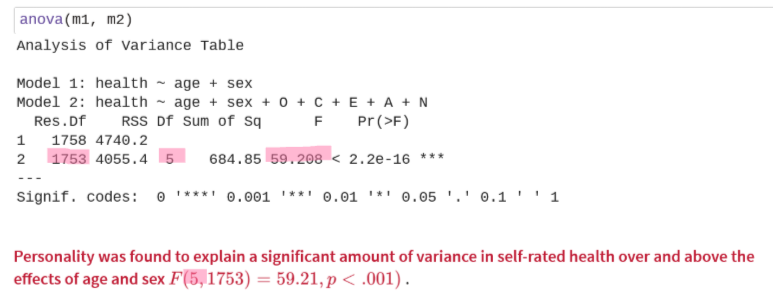
What are the steps involved in an incremental F-test in R?
Fit + run (summarise) models
Compare models based on an incremental F-test → anova(m1, m2)
In an incremental F-test, what does the F-ratio depend on?
The comparison models/variables being nested → the predictors in 1 model are a subset of the predictors in the other
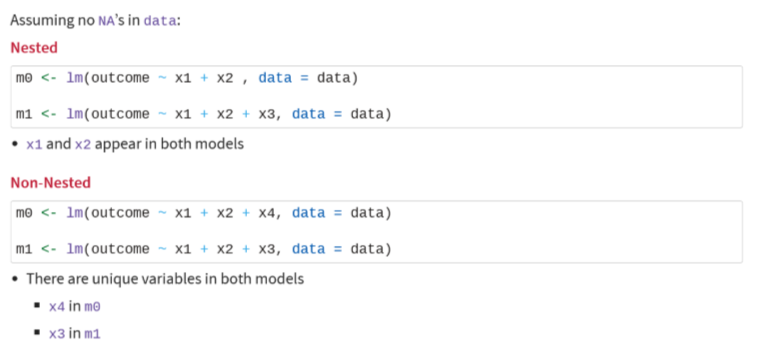
What is a further condition of conducting incremental F-tests?
Require the models to be computed on the same data
Be careful of NAs → lm() excludes the whole row of data if NAs for x or y are present
Data sets used by the models could end up different if the additional variables you add to the full model have NAs
What alternatives are used to compare non-nested models?
AIC
BIC
Neither require 2 models to be nested (can be used for both)
Using either for a single model isn’t meaningful → only make sense for model comparisons
Smaller (more negative) values = better fitting models → compare values + choose the model with the smaller AIC or BIC value

What do both AIC and BIC contain?
Parsimony correction → penalise models for being complex → helps us avoid overfitting (adding predictors arbitrarily to improve fit)

Does AIC or BIC have a harsher parsimony penalty for typical samply sizes when applying linear models?
BIC

What is the code for AIC and BIC in R (nested model)?

What is the code for AIC and BIC in R (non-nested model)?

What are the thresholds for △AIC?
No specific thresholds
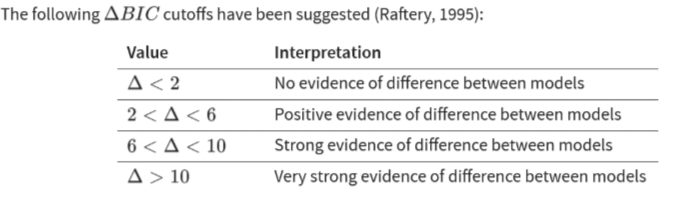
What are the thresholds for △BIC?