Post Lec 4 - MediaLab: write questions
 Call Kai
 Learn
 Practice Test
 Spaced Repetition
 Match
 Flashcards
 Knowt Play
1/27

Earn XP
Description and Tags
Describing a Red Blood Cell Population Using RBC Indices and Red Cell Distributi
28 Terms
Objectives
Identify red blood cell (RBC) indices reported by automated cell counters.
Correlate observed RBC morphology to red cell indices reported by automated cell counters.
Apply red cell distribution data to the RBC population observed on the peripheral smear.
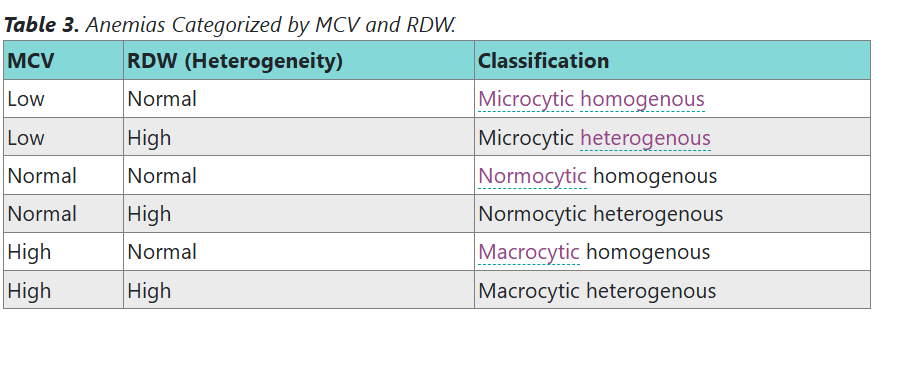
Correlate measured RBC indices to anemias.
Discuss the significance of delta checks in relation to RBC indices.
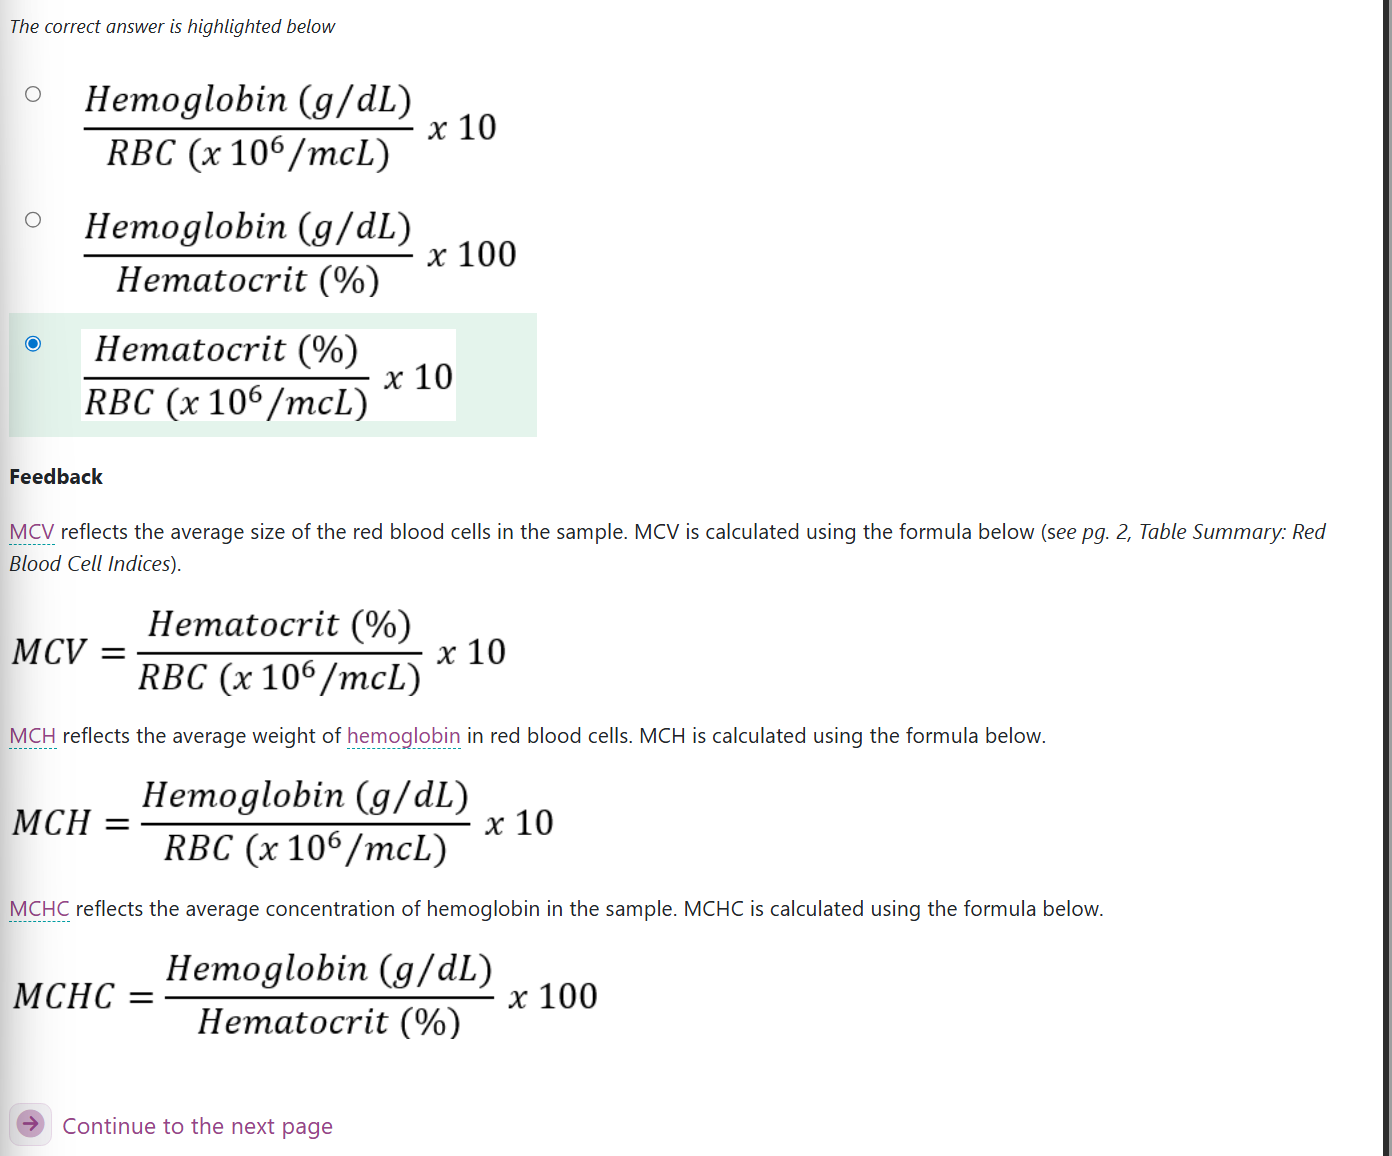
RBC indices are calculated (math‑based) parameters in an automated blood count report.
Parameters = things like MCV, MCH, MCHC plus their numerical values.
RBC indices have two main purposes:
Assist with the differentiation (telling apart) of anemias
Serve as quality control checks (make sure results make sense)
RBC indices include:
Mean cell (or corpuscular) volume (MCV)
Mean cell hemoglobin (MCH)
Mean cell hemoglobin concentration (MCHC)
These parameters identify characteristics (features) of the red cells circulating when the sample was collected.
MCV — Mean Cell Volume
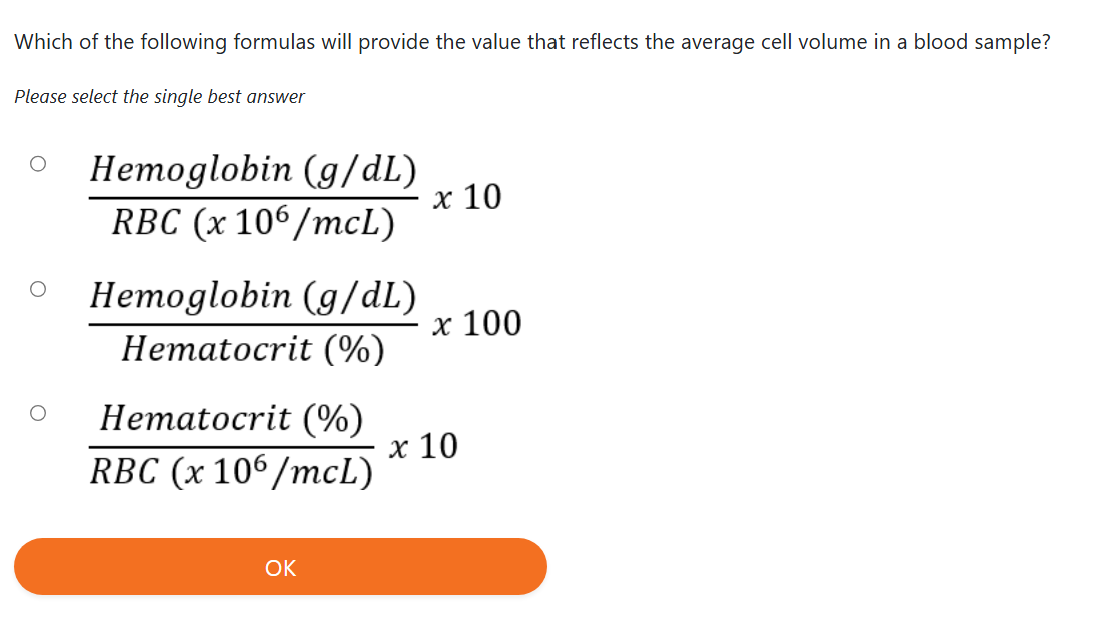
MCV refers to the average size of the RBCs in the sample.
If there is a mixture of cell populations (different-sized RBC groups), the analyzer will average the sizes.
Units: femtoliters (fL)
One femtoliter = 10^{-15} L
MCH — Mean Cell Hemoglobin
MCH refers to the average weight (mass) of hemoglobin in each RBC.
If there is a mixture of cell populations, the analyzer will average the hemoglobin weights.
Units: picograms (pg)
One picogram = 10^{-12} grams (very tiny weight)
MCHC — Mean Cell Hemoglobin Concentration
MCHC refers to the average hemoglobin concentration (how tightly packed the hemoglobin is) inside the RBCs.
If there is a mixture of cell populations, the analyzer will average the concentrations.
Units: g/dL (grams per deciliter)
Important Note
Some hematology instruments measure MCV directly and then calculate hematocrit, instead of calculating MCV from hematocrit and RBC count.
Reference ranges:
MCV: 80–100 fL
MCH: 26–32 pg
MCHC: 32–36 g/dL
Parameter | Definition | Units | Formula | Example |
Mean cell volume (MCV) |  | |||
Mean cell Hb (MCH) |  | |||
Mean cell Hb concentration (MCHC) |  |
Parameter | Definition | Units | Formula | Example |
Mean cell volume (MCV) | The average volume of the RBC | Femtoliters (fL) |  | |
Mean cell Hb (MCH) | The average weight of Hb in the RBC | Picograms (pg) |  | |
Mean cell Hb concentration (MCHC) | The average concentration of Hb in the RBC volume | Grams/deciliter (g/dL) |  | |
Hb= hemoglobin
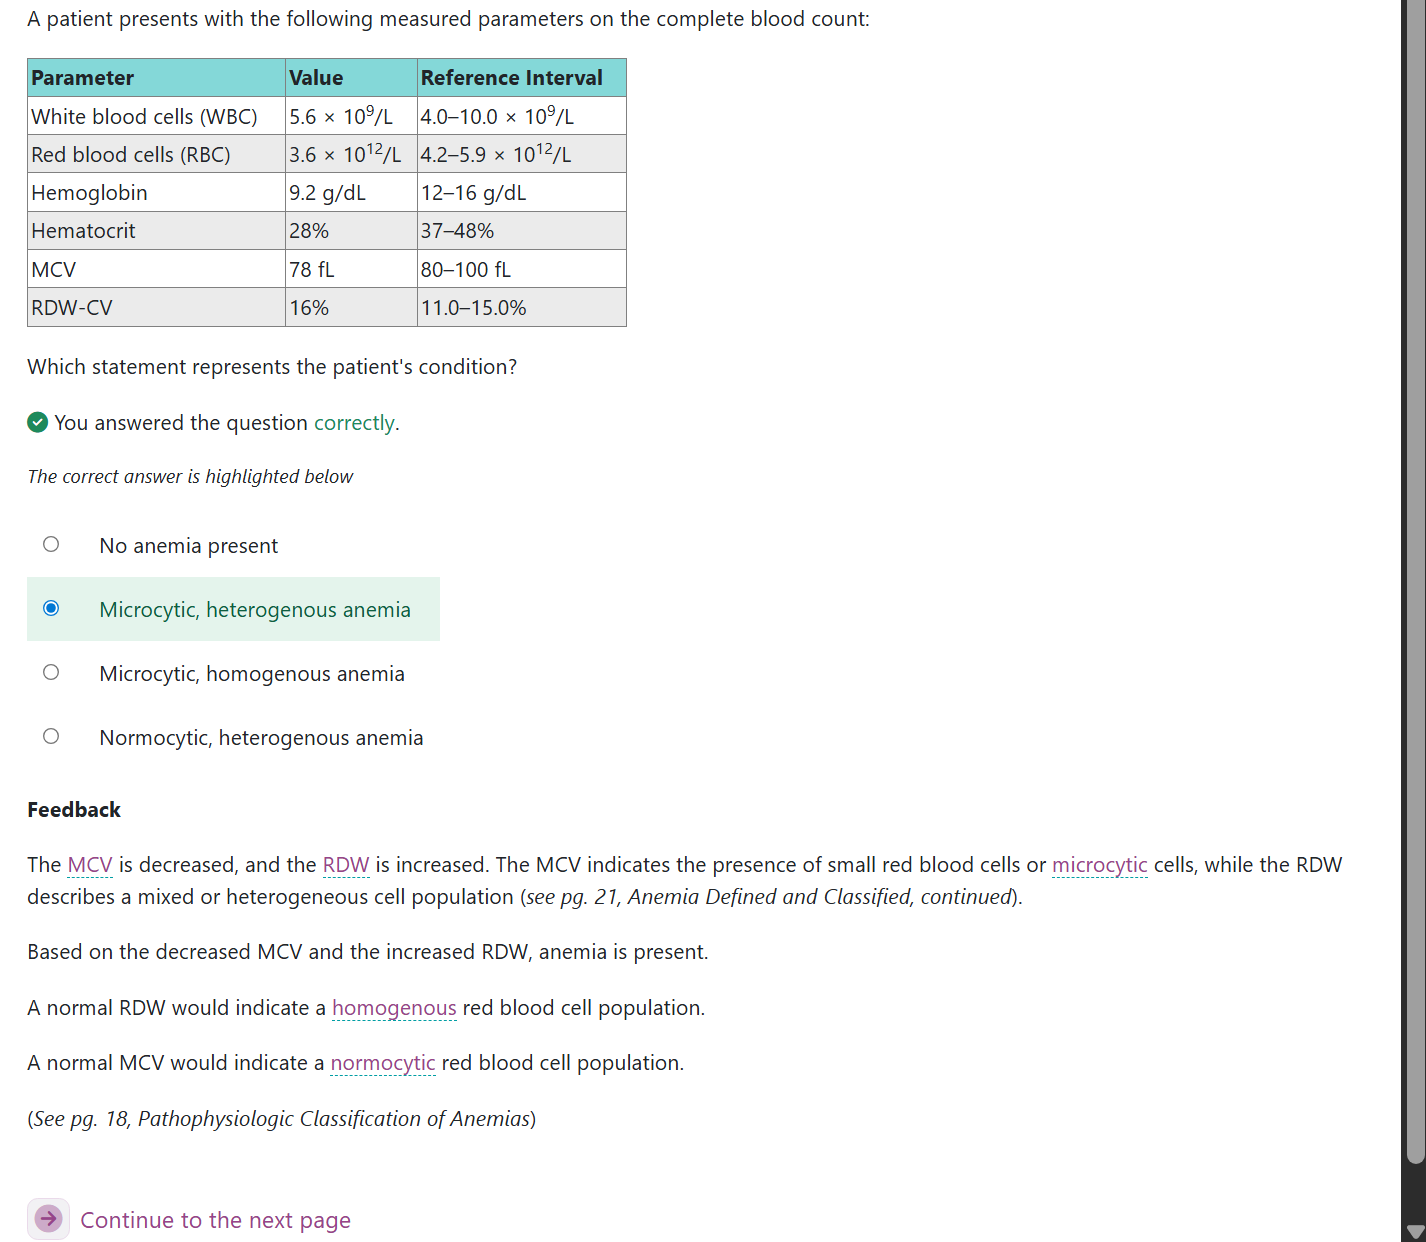
Red Blood Cell Distribution Width (RDW):
The red cell distribution width (RDW) is derived (calculated from) the red blood cell distribution curves (graphs showing RBC sizes) generated on automated hematology analyzers.
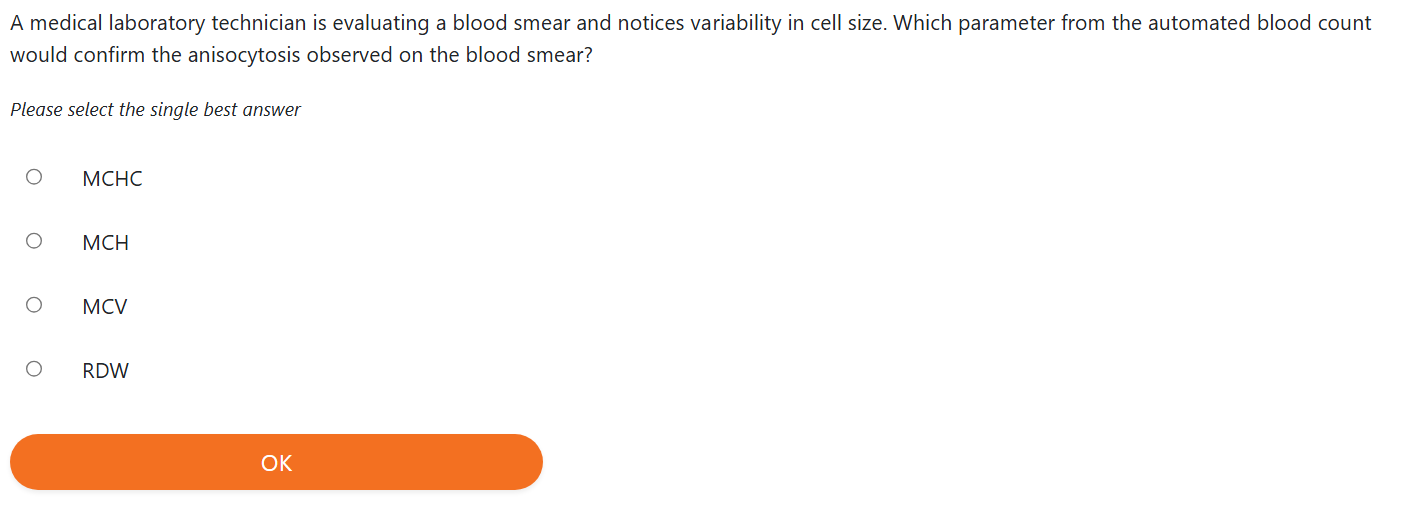
RDW indicates the variation (differences) in RBC size within a blood sample.
RDW is used along with the indices (MCV, MCH, MCHC — RBC parameters) to describe a population of RBCs.
There are two RDW measurements currently used
RDW‑CV — red cell distribution width coefficient of variation (percentage variation)
RDW‑SD — red cell distribution width standard deviation (actual numerical spread)
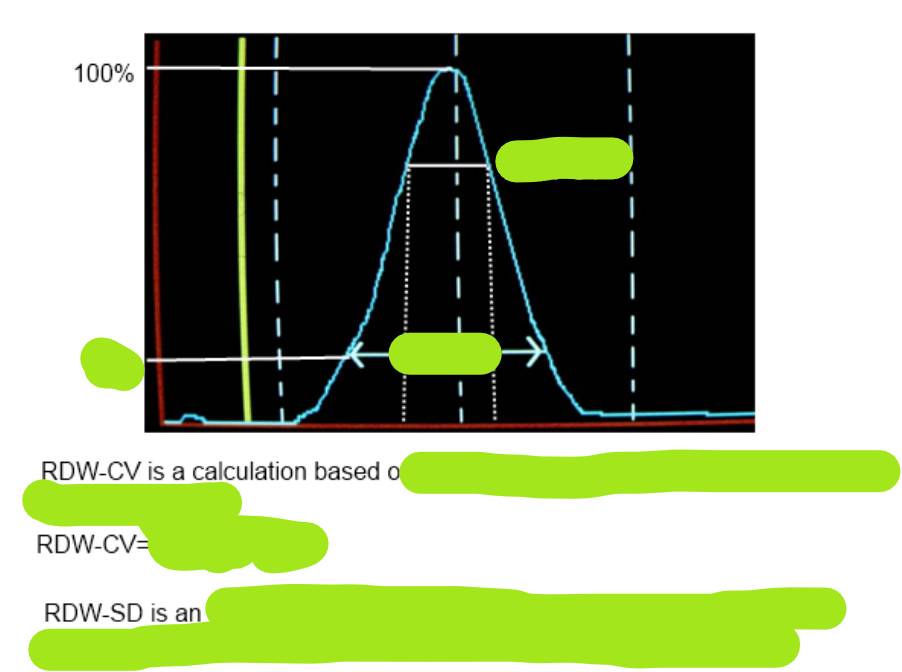
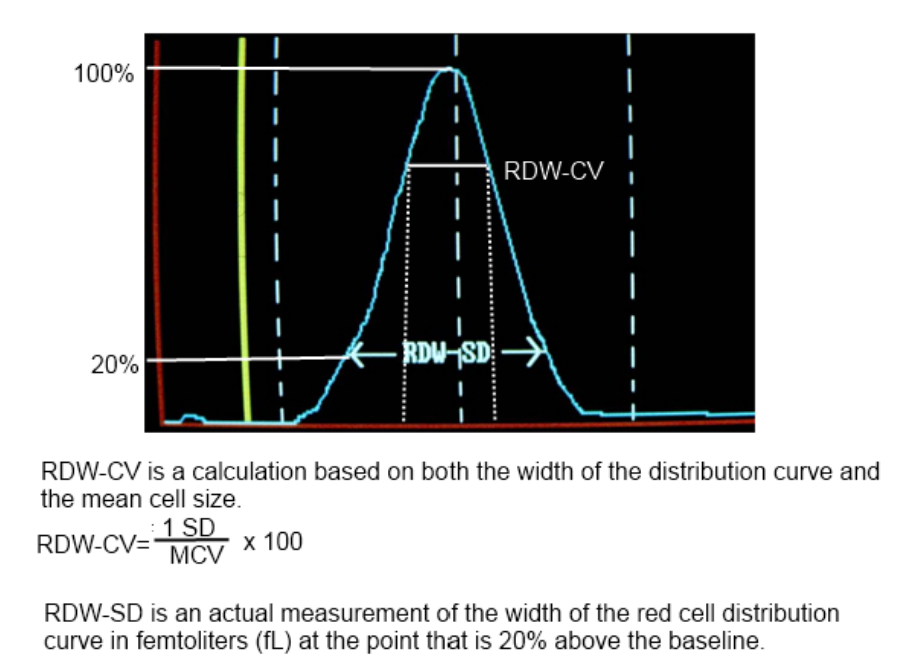
RDW‑CV and RDW‑SD
The RDW‑CV is a calculation (math formula) based on the distribution curve’s width (how wide the RBC size graph is) and the mean cell size (average RBC size).
RDW‑CV is calculated by:
Dividing the standard deviation (spread of sizes) of the mean cell size
By the MCV (average RBC size)
Then multiplying by 100 to convert it to a percentage (%)
A normal RDW‑CV range is 11.0–15.0%.
Because RDW‑CV is a calculation, it depends on:
Width of the distribution curve (how wide the RBC size graph is)
MCV (average RBC size)
This means RDW‑CV may not always show the true variation (real differences) in RBC size.
Be aware:
A homogeneous population (all similar) of red cells with a narrow curve (tight graph) and low MCV (small cells)
→ may still have a high RDW‑CVA heterogeneous population (mixed sizes) with a broad curve (wide graph) and high MCV (large cells)
→ may still have a normal RDW‑CV
RDW‑SD
The RDW‑SD is an actual measurement (direct reading) of the width of the red cell distribution curve in femtoliters (fL).
The analyzer measures the curve’s width at the point 20% above the baseline (20% height of the graph).
Because RDW‑SD is a real measurement, it is:
Not influenced by MCV (not affected by average cell size)
More accurate at showing true RBC size variance (real differences)
Normal RDW‑SD range for adults: 40.0–55.0 fL
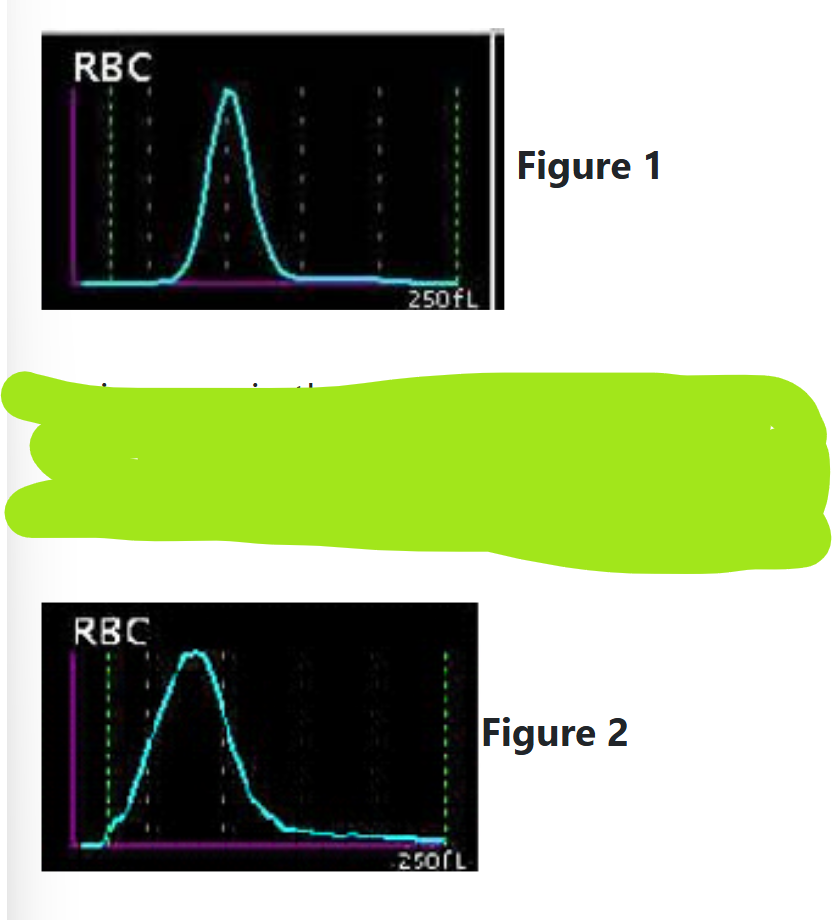
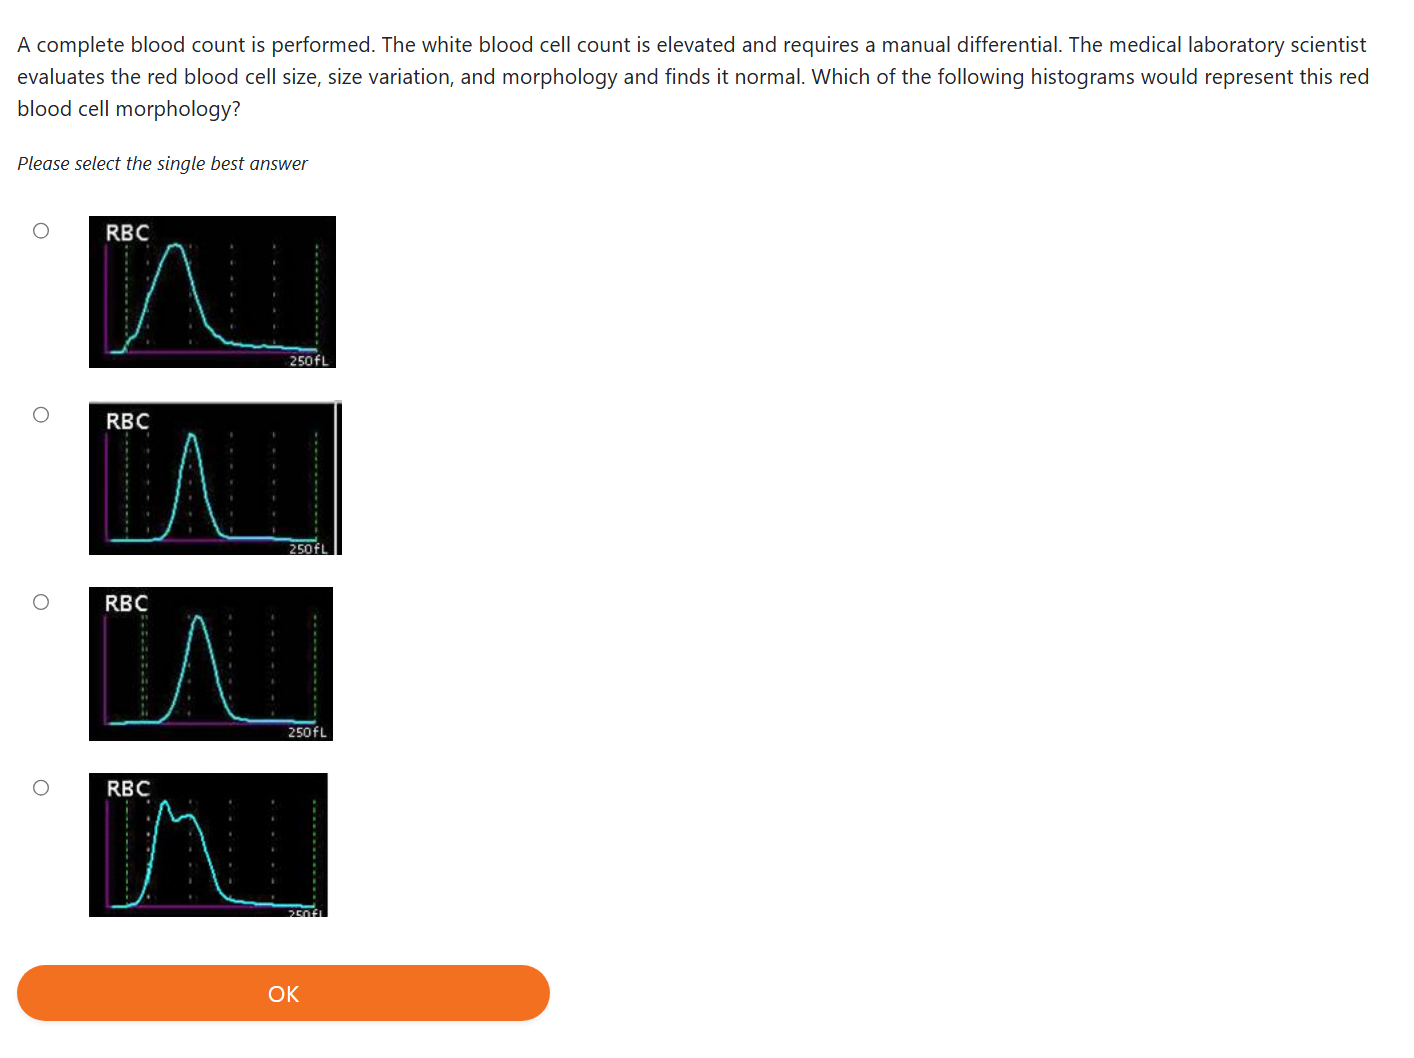
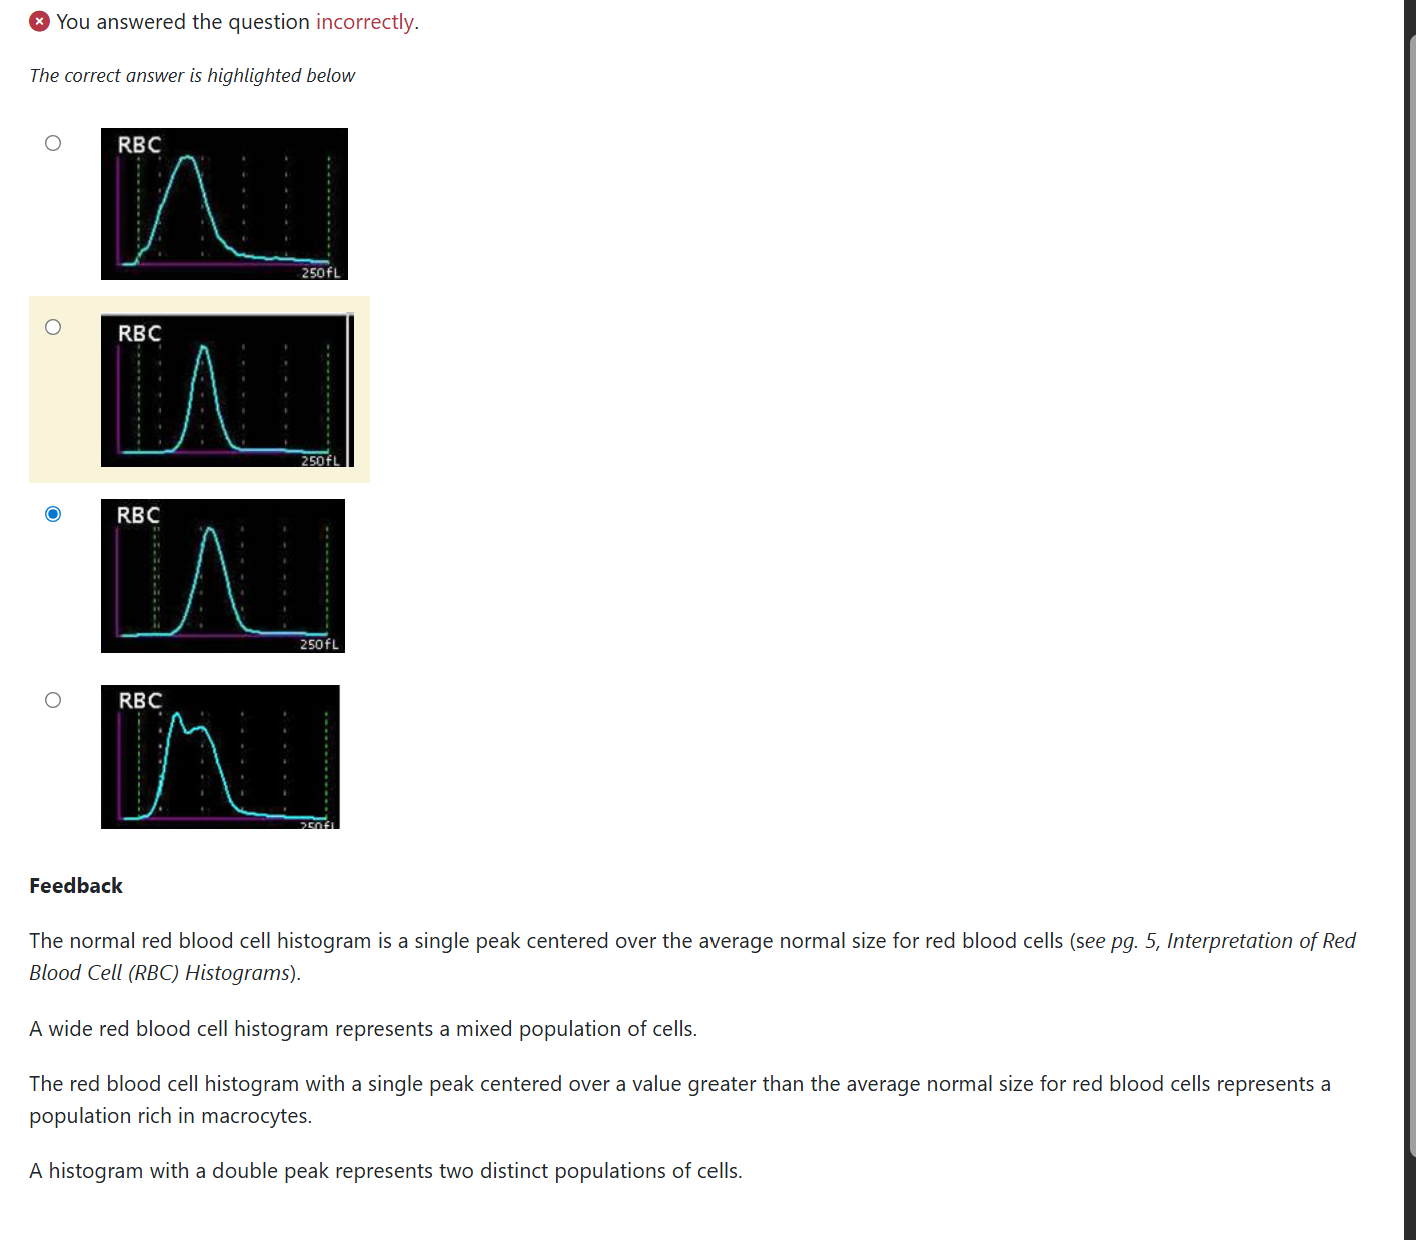
The normal red cell distribution curve is Gaussian (bell‑shaped), and the peak (highest point) should fall within the normal MCV range (average RBC size) of 80–100 fL, as shown in Figure 1.
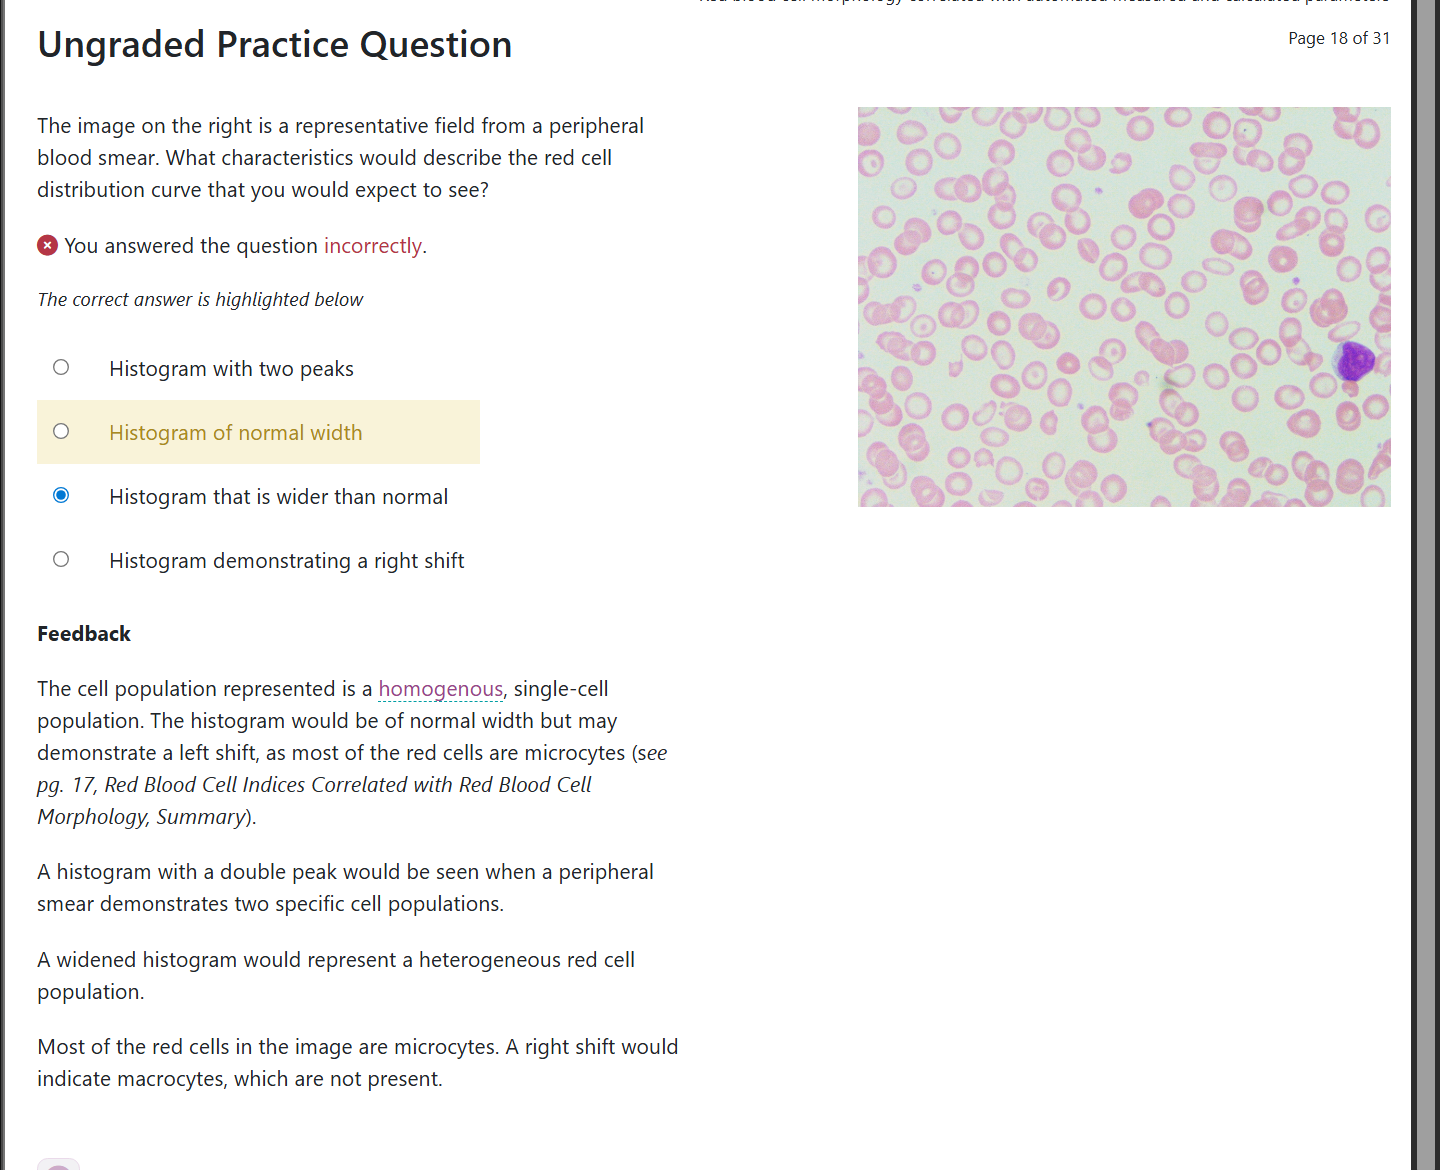
However, the red cell distribution curve will get wider (spread out more) as the red cells vary in size (have different sizes), as seen in Figure 2.
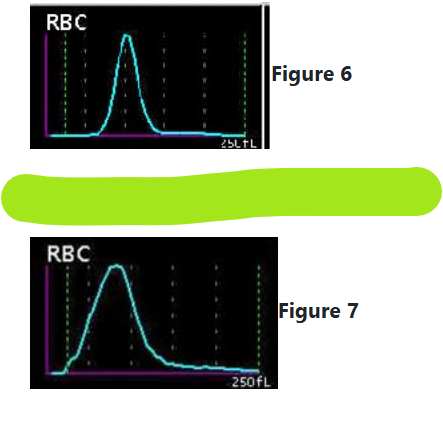
A narrow distribution curve (tight, thin curve) indicates a homogeneous population (all similar) of red cells.
A wide distribution curve (spread-out curve) indicates a heterogeneous population (mixed sizes) of red cells.
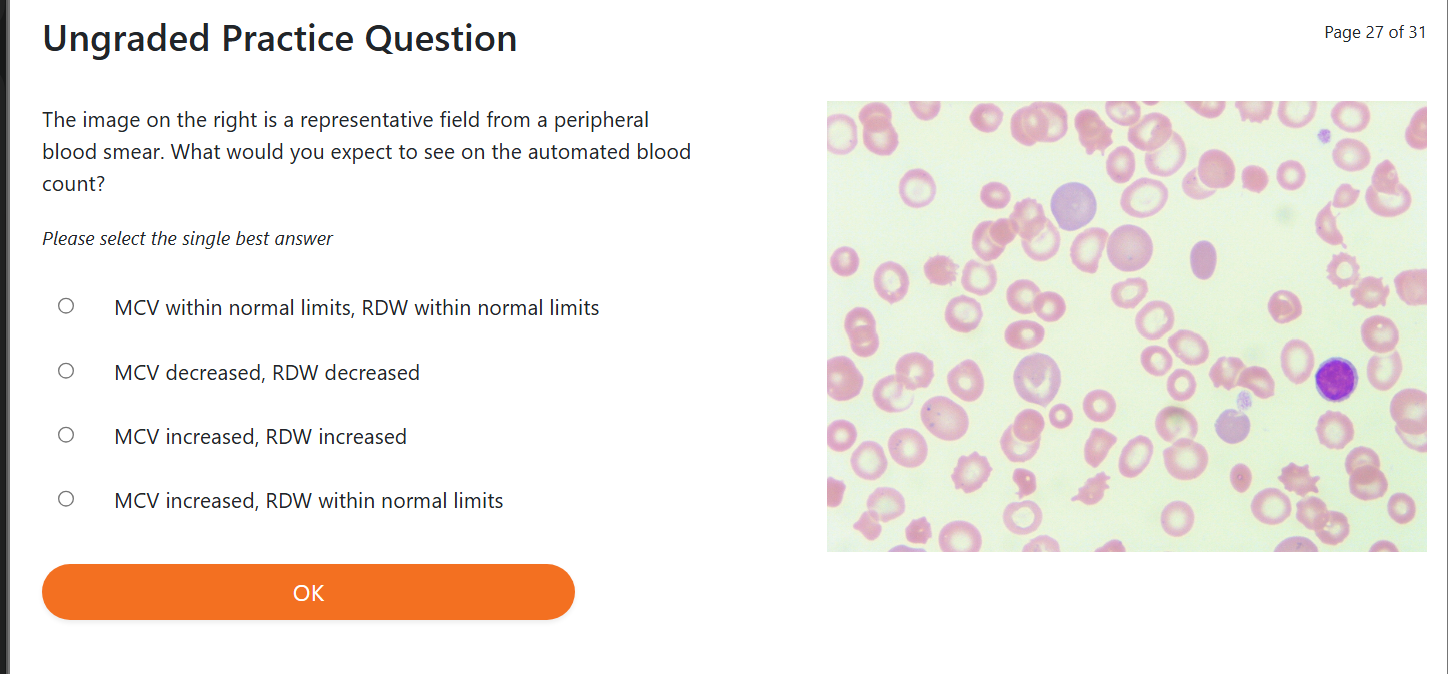
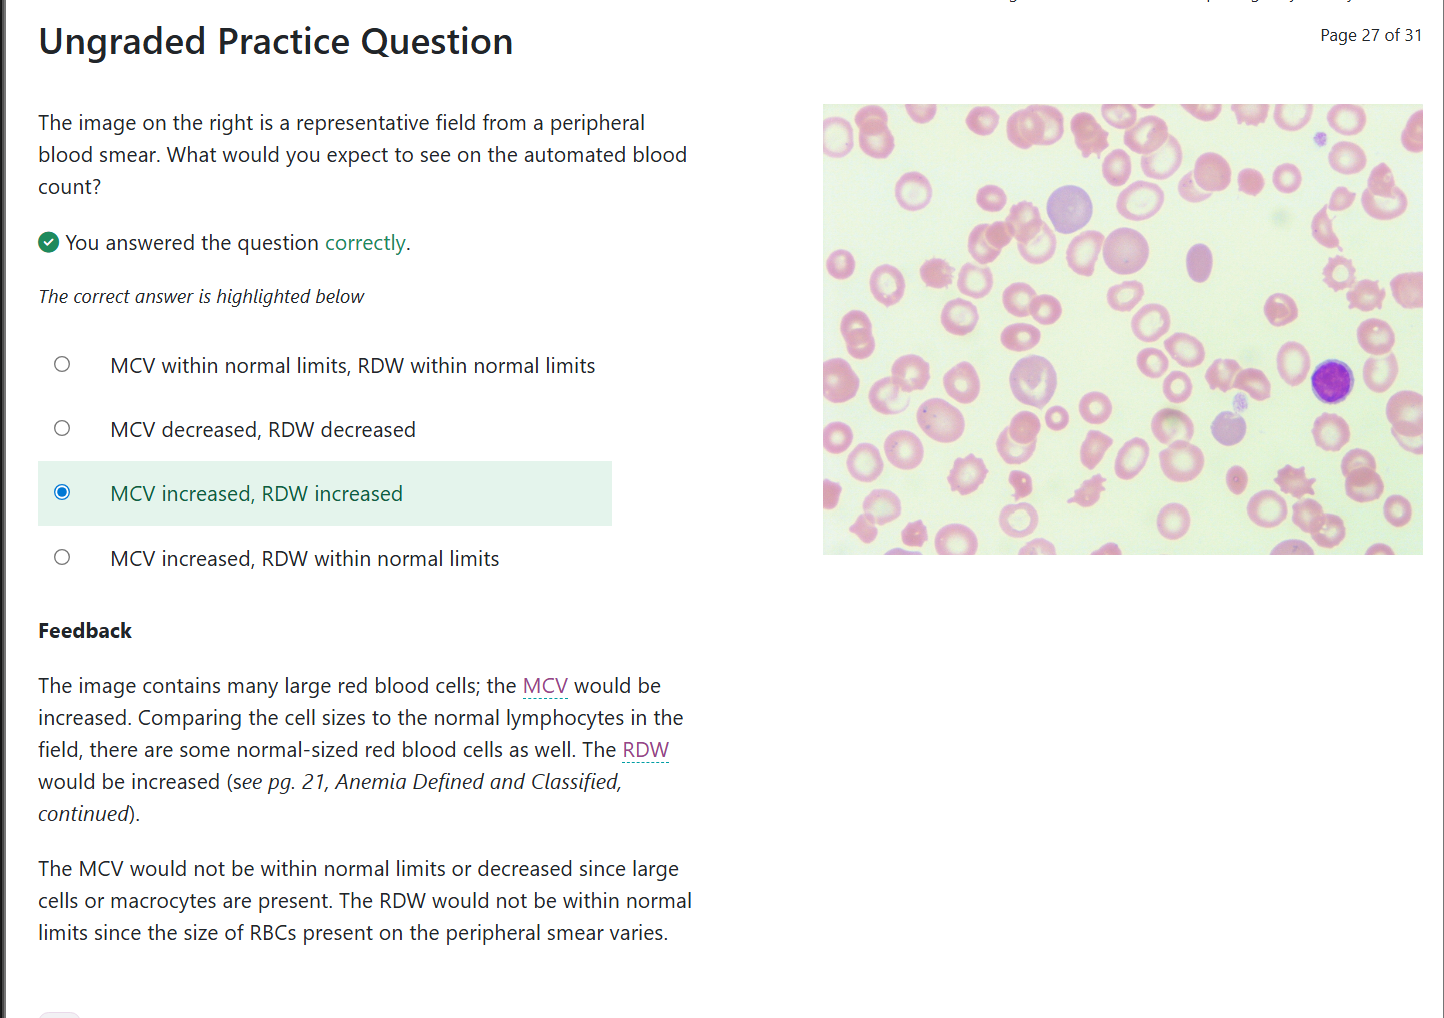
An increase in RDW is observed when the size of RBCs varies within the population.
This is physiologically a mix of different cell sizes, and this condition is called anisocytosis (variation in RBC size).
A wide peak (wide curve) represents an RDW above the reference range which means the RBC population has variable sizes
RDW we are comparing the RBC to a normal RBC and to eachother
Example:
If you have some microcytic cells (small) And some normal‑sized cells
→ The deviation (difference) increases
→ RDW becomes higher
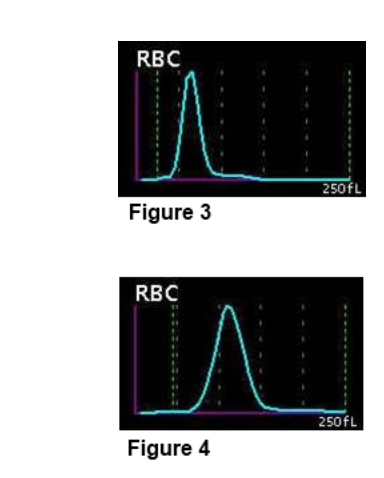
The parameter RDW does NOT tell you if RBCs are normal-sized.. For example:
A cell population may be mostly large or mostly small,
And the RDW can still be normal,
Because the cells are consistent in size (all similar to each other) even if they are not normal-sized.
When you look at a smear, these cells will not be normal size, but they will be uniform (all the same).
How the histogram shifts
A population of RBCs that are all similar in size, but not normal size, will produce a curve that is:
Shifted left if the cells have a low MCV (small cells)
Shifted right if the cells have a high MCV (large cells)
Curve width = RDW
Narrow = similar sizes
Wide = mixed sizes
The shape of the curve tells you about variation (differences),
The position of the curve tells you about average size.
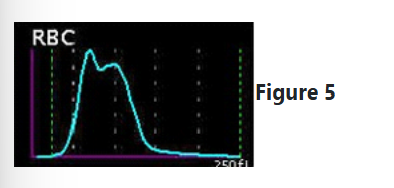
Two distinct RBC populations
When two different RBC populations are present in the same sample:
The RDW increases (because variation increases)
The histogram may show more than one peak (two bumps)
On the smear, you will see two different RBC groups clearly
Two peaks = two RBC populations
→ RDW high, histogram shows two bumps.
This happens in conditions like:
Transfusion
Iron deficiency recovering with treatment
Mixed microcytic + macrocytic states
The hematology laboratory is experiencing instrument downtime. The laboratory has a backup method for hemoglobin and hematocrit testing that is used until the instrument is repaired. The hematologist calls and asks if you can provide any red blood cell indices. Which of the indices, if any, can you provide to the hematologist?
MCV and MCH
MCH and MCHC
MCH only
MCHC only
MCV, MCH and MCHC
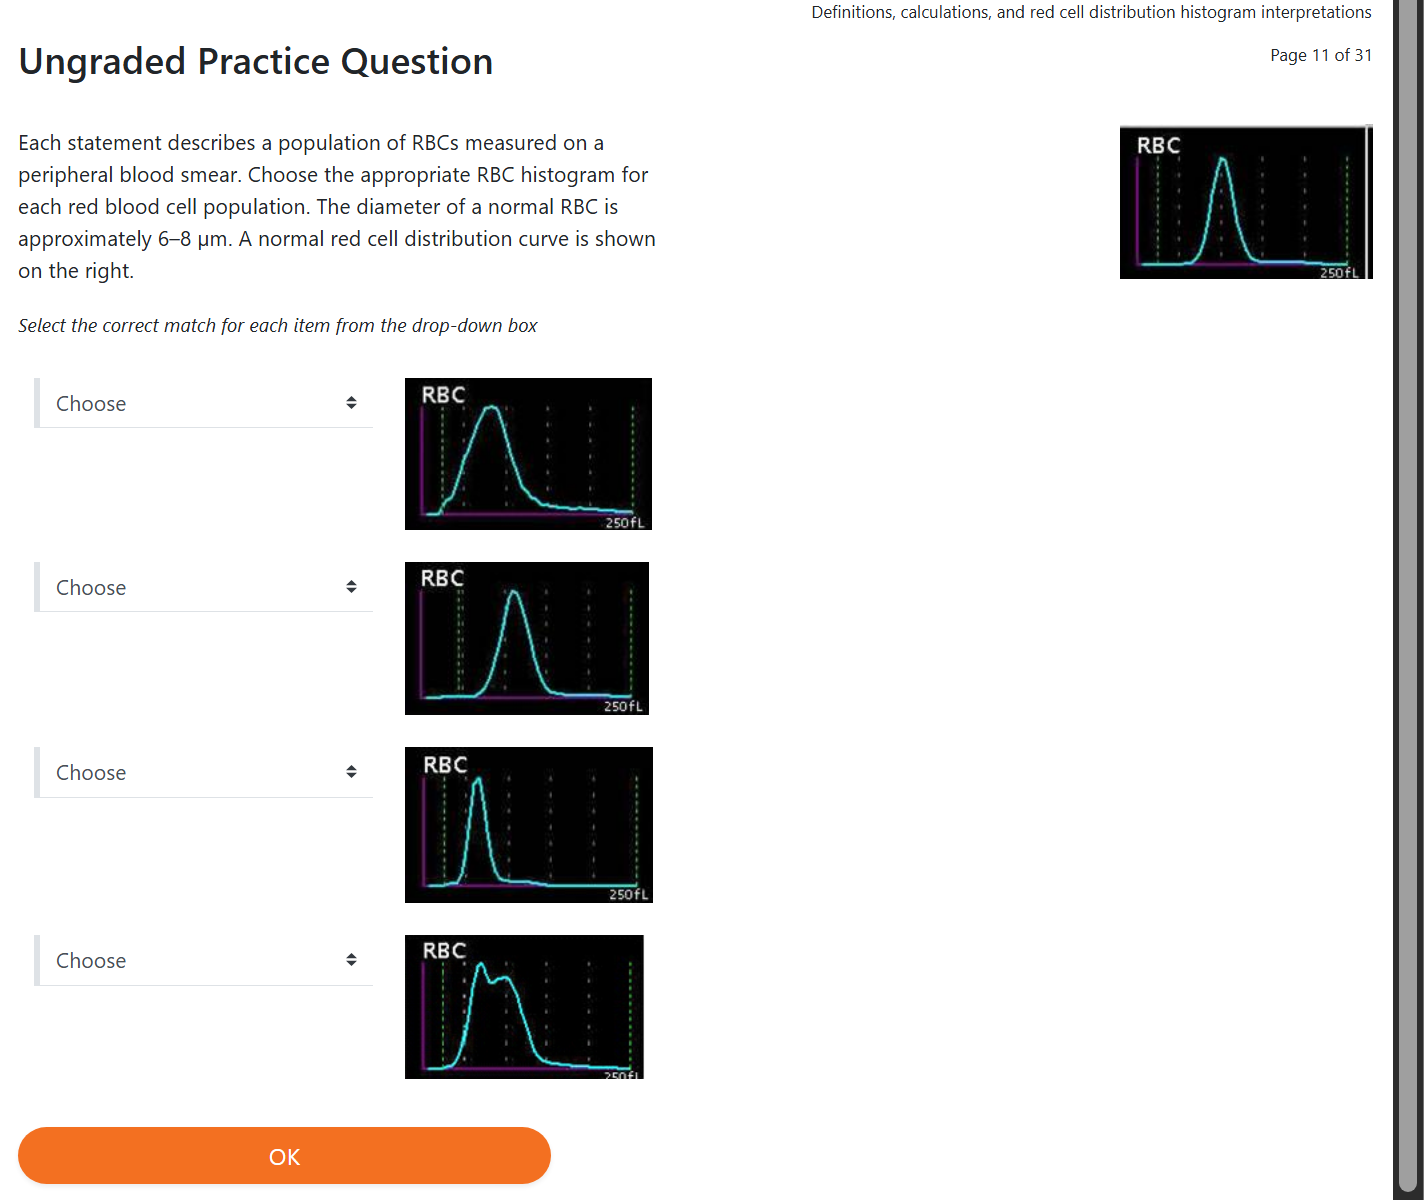
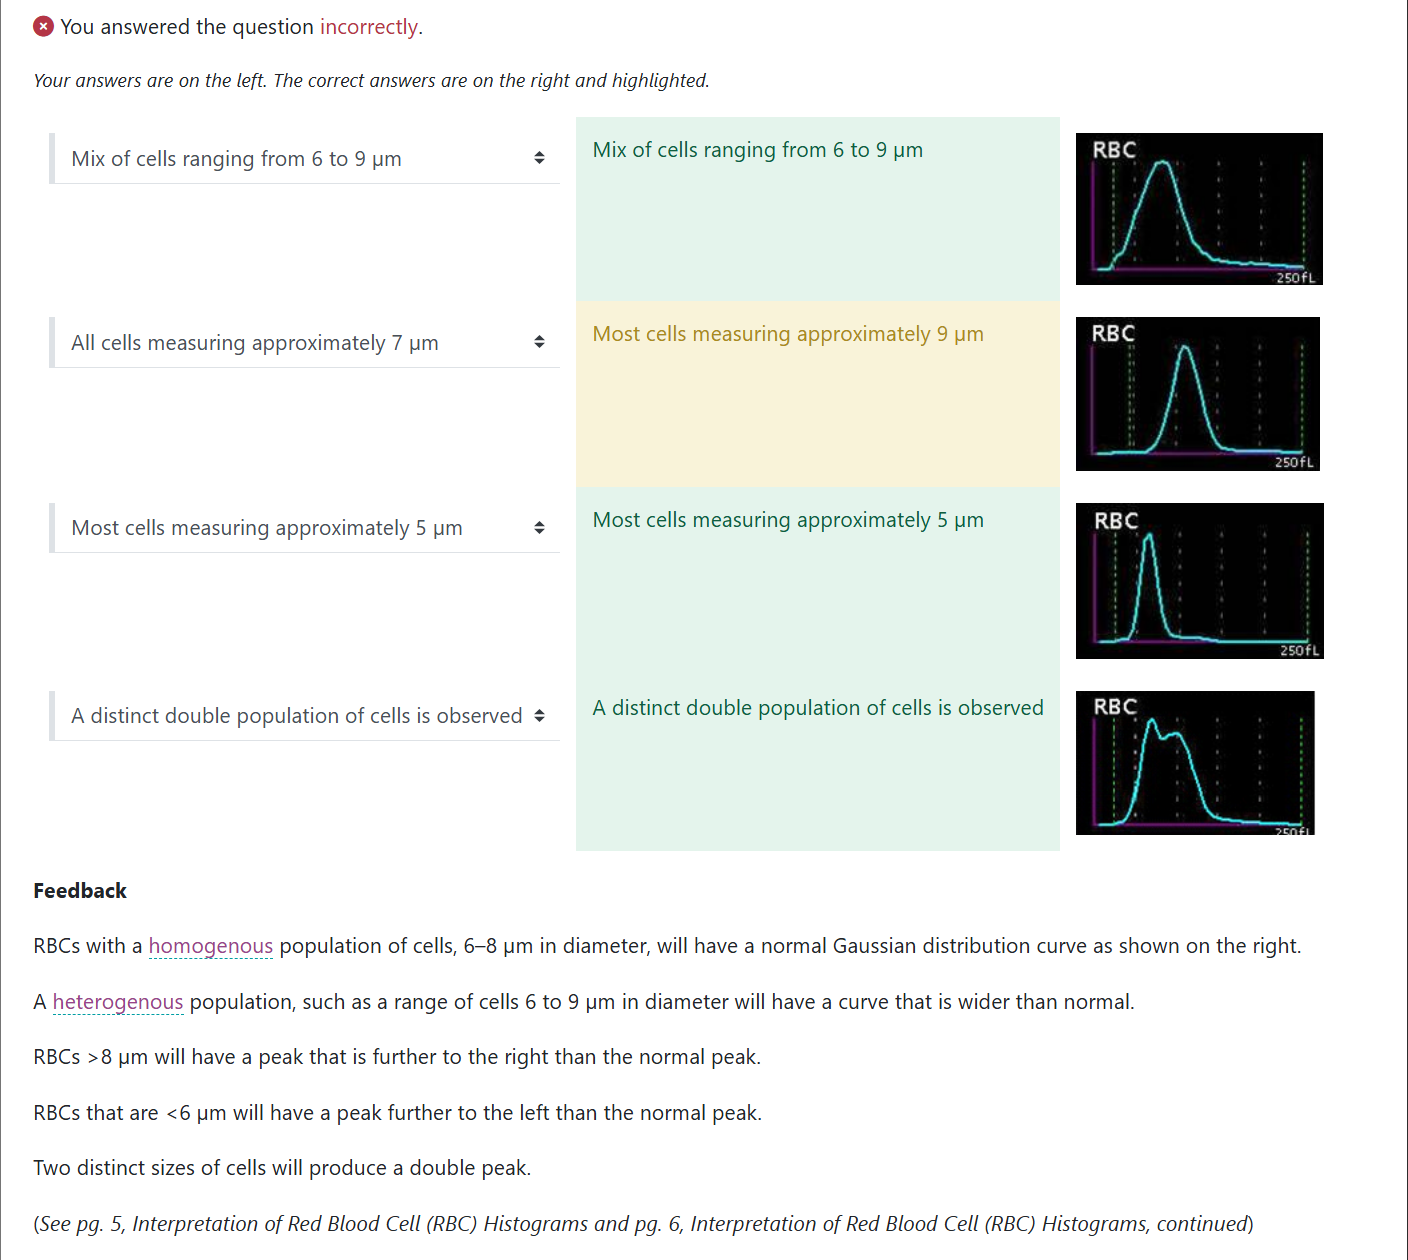
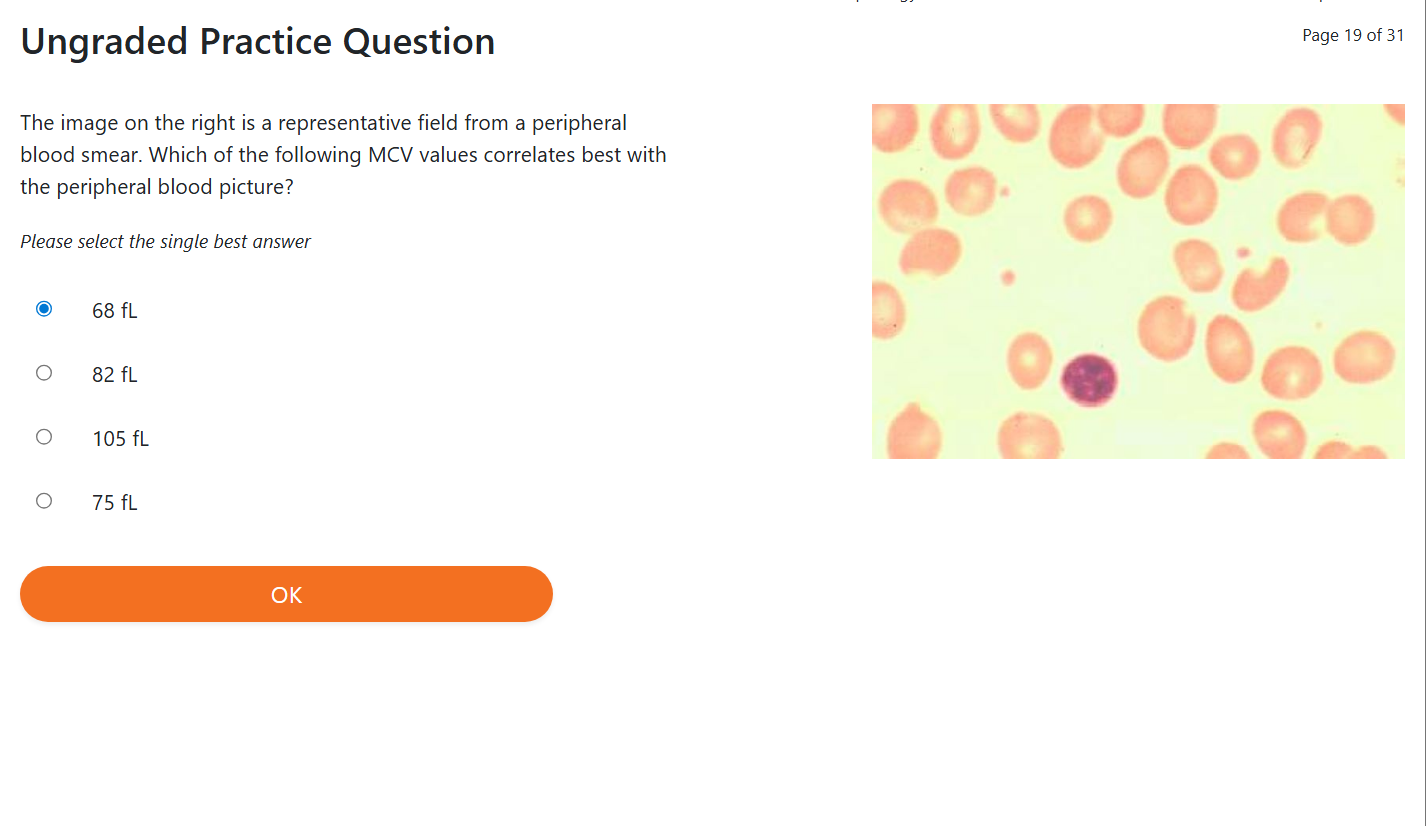
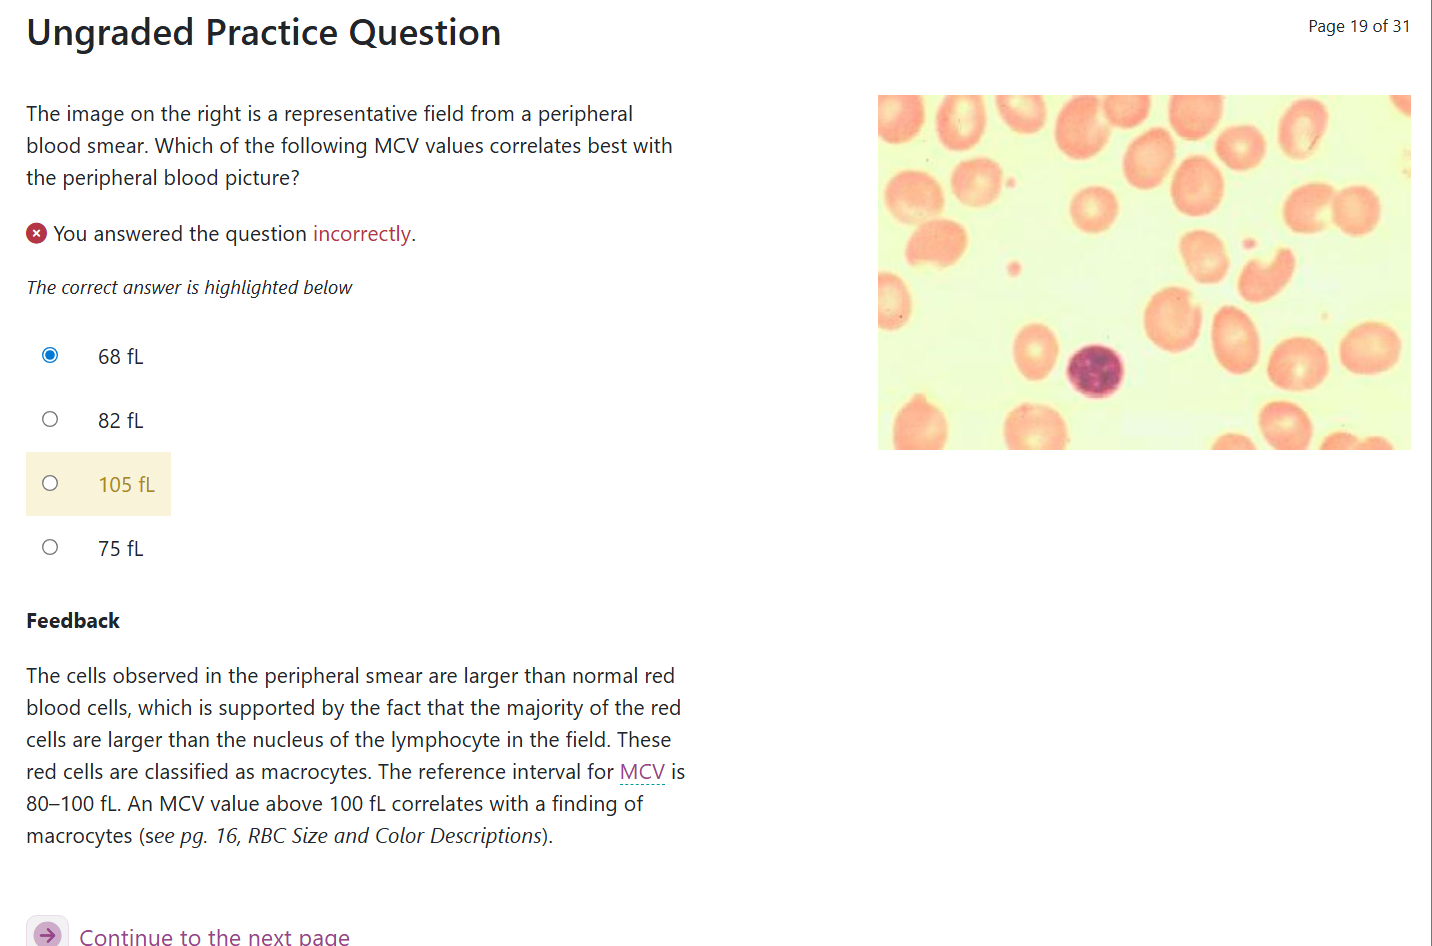
Normal RBCs have a diameter of 6–8 μm.
On a peripheral blood smear, normal RBCs are disc‑shaped (round and flat) with a pale‑staining central area (lighter middle) called the central pallor.
MCV is helpful, but remember:
MCV = average size of all RBCs in the sample
If all RBCs are similar in size (homogeneous):
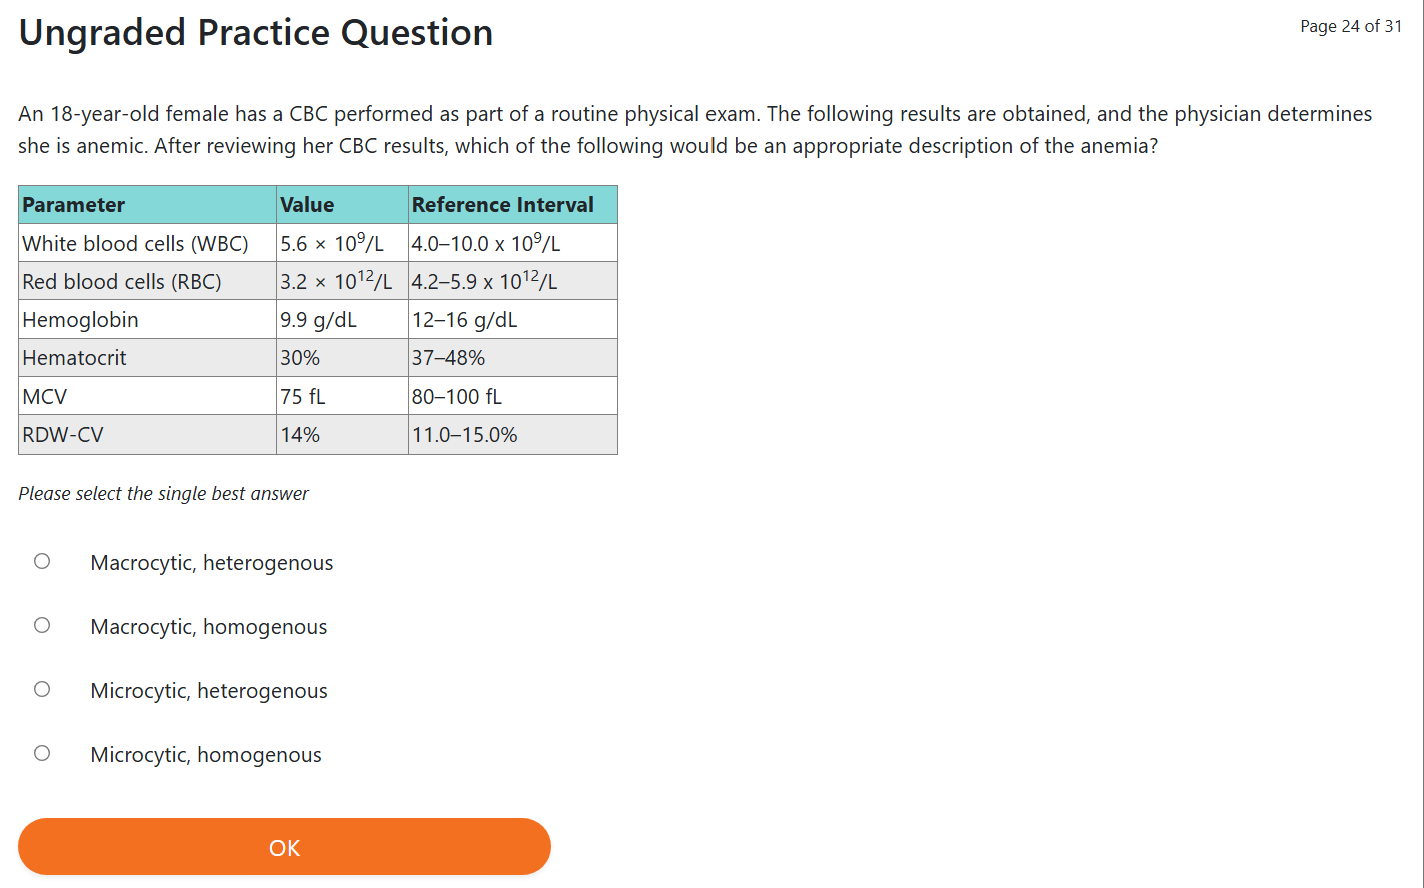
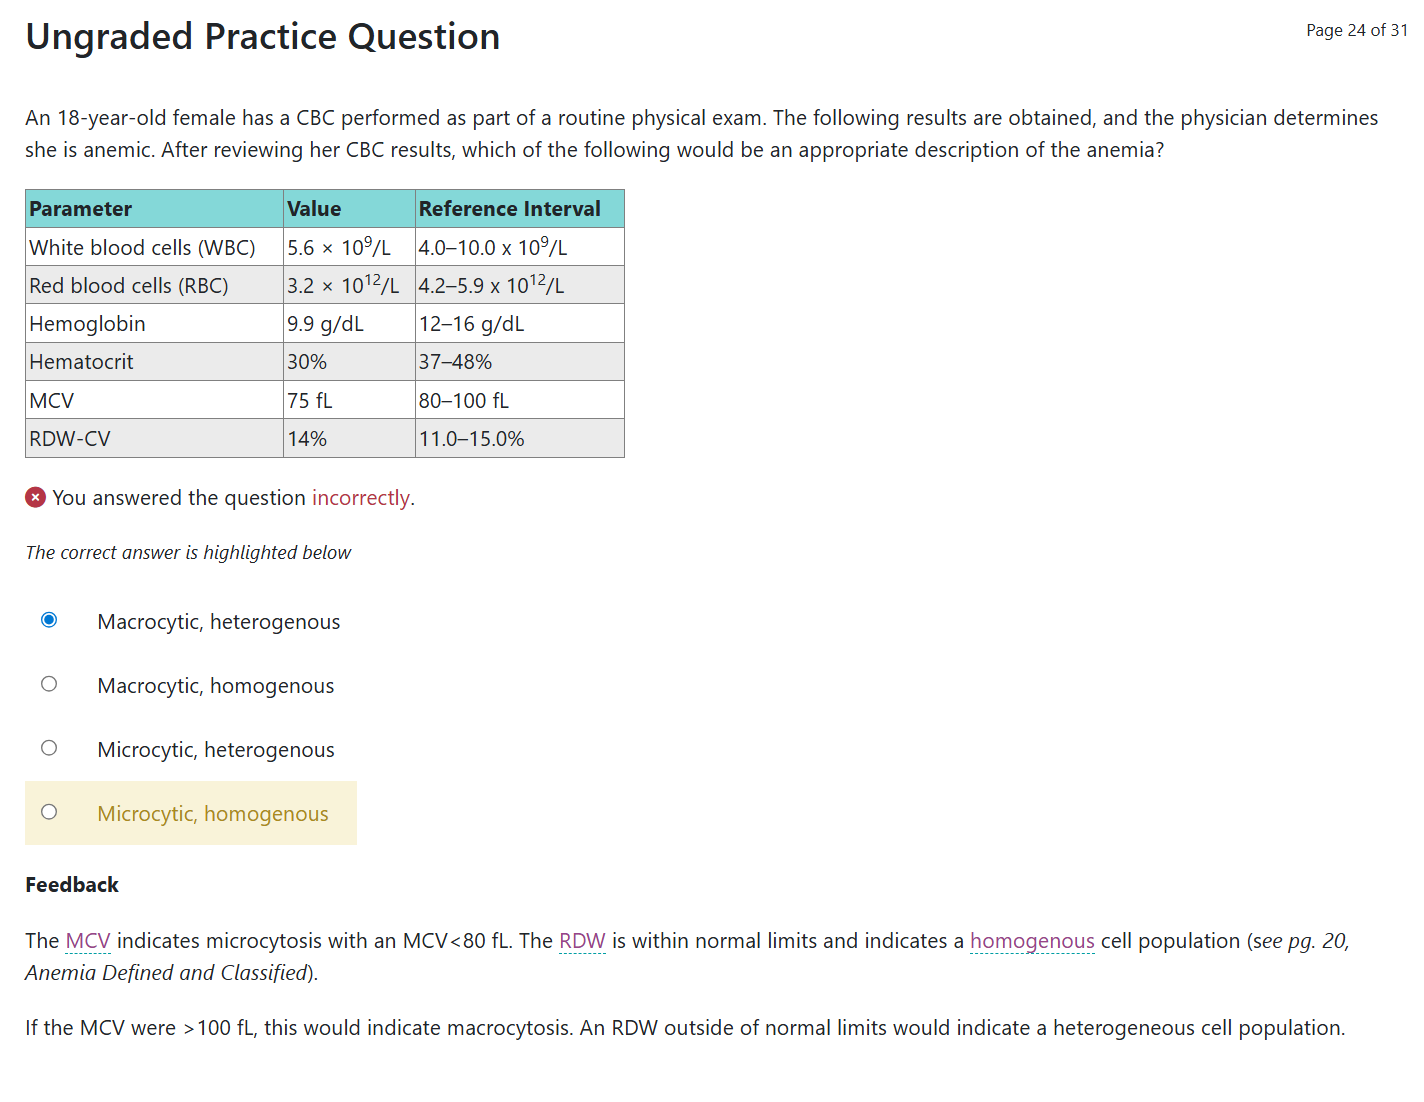
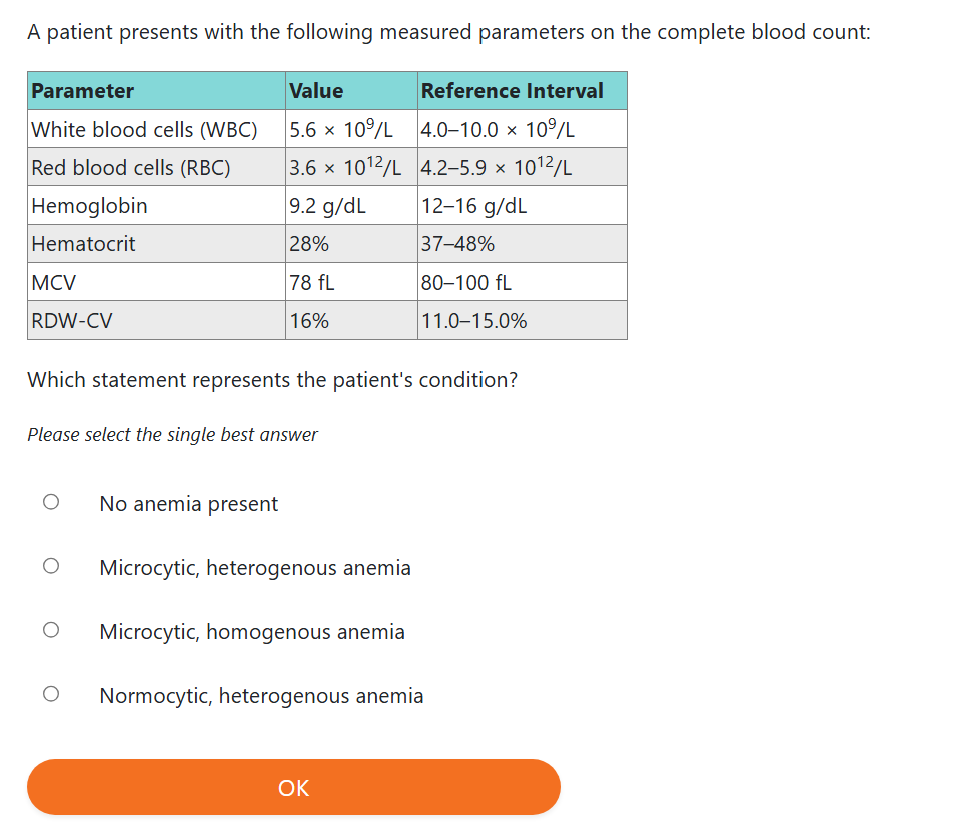
MCV < 80 fL → microcytic (small)
MCV > 100 fL → macrocytic (large)
BUT…
If there is a mixture of small and large RBCs:
The MCV may look normal,
Because the analyzer averages the sizes
This can hide the real problem
In this situation, the RDW becomes very helpful.
High RDW = mixed sizes (anisocytosis)
Normal RDW = sizes are consistent, even if they’re all small or all large
As discussed earlier, RDW shows the variation (differences) in the size of RBCs in a blood sample.
A normal RDW means the RBC population is homogeneous (all similar in size).
This does not mean the cells are normocytic (normal size) — it only means they are consistent.RDW tells you consistency, not normality.
When RDW is increased
An increased RDW means the RBC population is not homogeneous (mixed sizes).
On the smear, you should see:
Variation in RBC sizes aka A heterogeneous population (mixed small + normal + large cells)
RDW with an histogram
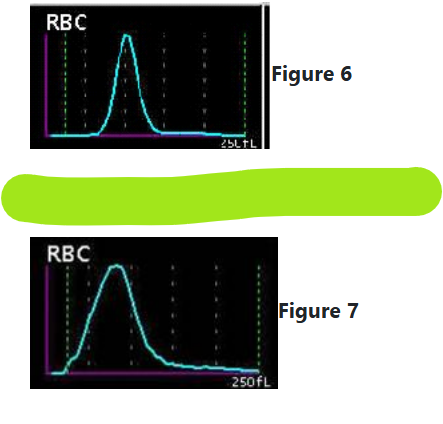
As seen in Figure 6, a narrow distribution curve indicates a homogenous population of red cells.
As shown in Figure 7, the wider the distribution curve, the more heterogeneous the population of red cells.
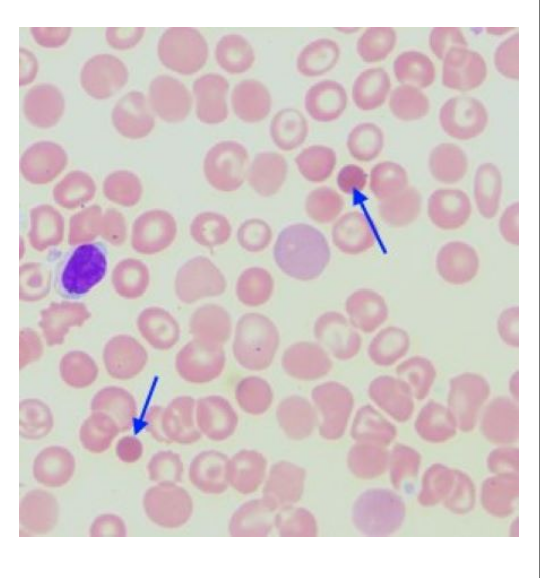
When evaluating RBC morphology on a peripheral smear, the intensity of color (how dark the cell stains) and the size of the central pallor (light center) reflect the amount of hemoglobin inside the RBCs.
Normal RBCs are disc‑shaped and have a central pallor that is about one‑third of the cell’s diameter.
→ These cells contain a normal amount of hemoglobin and are called normochromic (normal color).
Hypochromic RBCs (paler than normal)
RBCs that are disc‑shaped but have a larger‑than‑normal central pallor (bigger pale center) are called hypochromic (less color).
Hypochromic cells can range from:
Slightly increased central pallor
To cells with only a thin ring of hemoglobin around the edge
Important point:
Hypochromia describes the population of RBCs, not just one cell.
It generally parallels MCHC:
As MCHC decreases, hypochromia becomes more likely.
But remember:
MCHC is an average, so it may miss mixed populations (some normal, some hypochromic).
Hypochromia is often associated with microcytosis (small RBCs).
Hyperchromic RBCs (truly darker than normal)
When an RBC has no central pallor because the hemoglobin concentration is increased, the cell becomes:
Dense
Deep‑staining
Round
This is called a spherocyte.
Spherocytes are the only truly hyperchromic cells because they contain more hemoglobin per volume than usual.
Hyperchromia parallels MCHC:
As MCHC increases, spherocytes are more likely.
BUT:
MCHC can be falsely elevated by interfering substances such as:
Lipemia (fat in plasma)
Hemolysis (RBCs breaking apart)
Red cell agglutination (cells clumping)
Also important:
“Hyperchromia” is not a reported descriptive term on a smear.
Instead, we describe the cells as spherocytes.
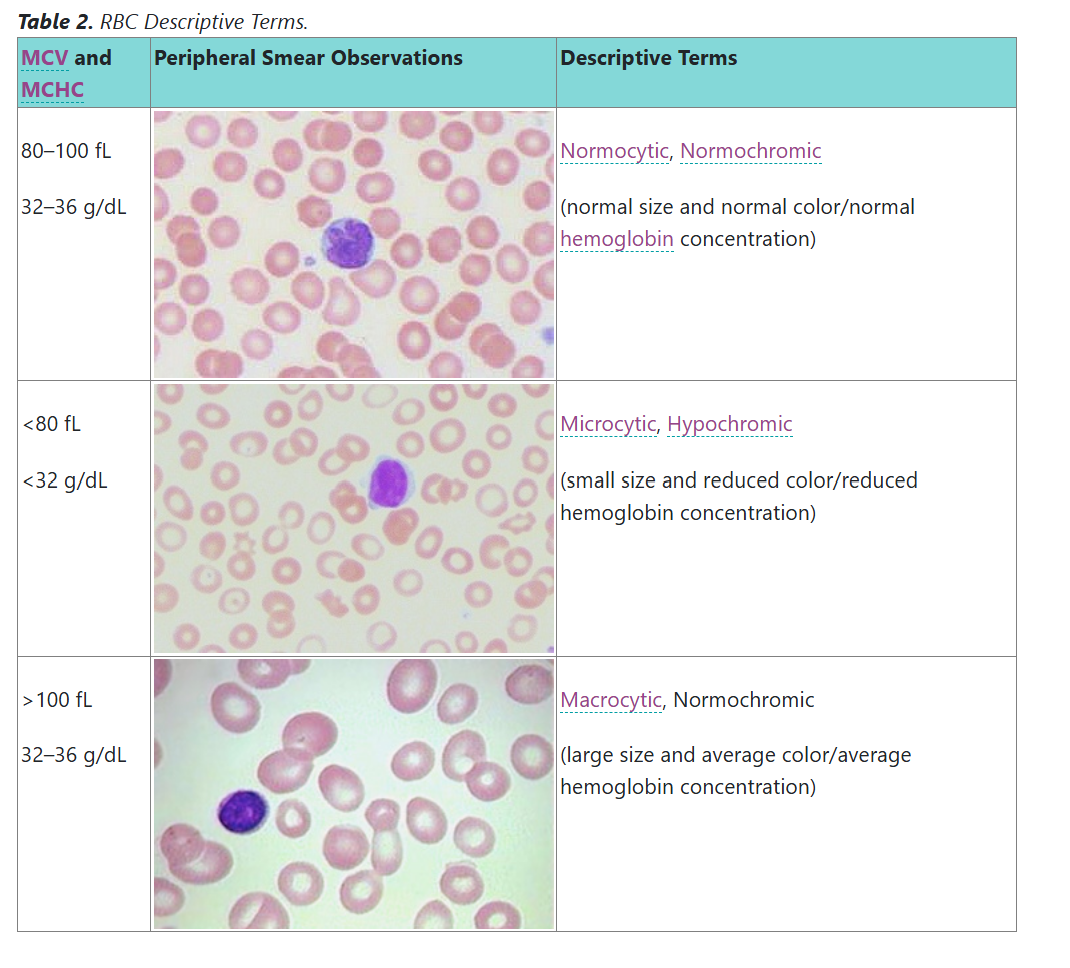
It is essential to correlate (match and compare) what you see on the peripheral smear with the RBC indices from the automated CBC.
The RBC indices and RDW are descriptors (clues) that help diagnose RBC disorders, especially anemias.
Looking at the smear visually is used to confirm what the machine reports.
Step‑by‑Step Procedure for Evaluating RBCs
1. Check Hemoglobin and Hematocrit for Agreement
If RBCs are normochromic (normal color) and normocytic (normal size):
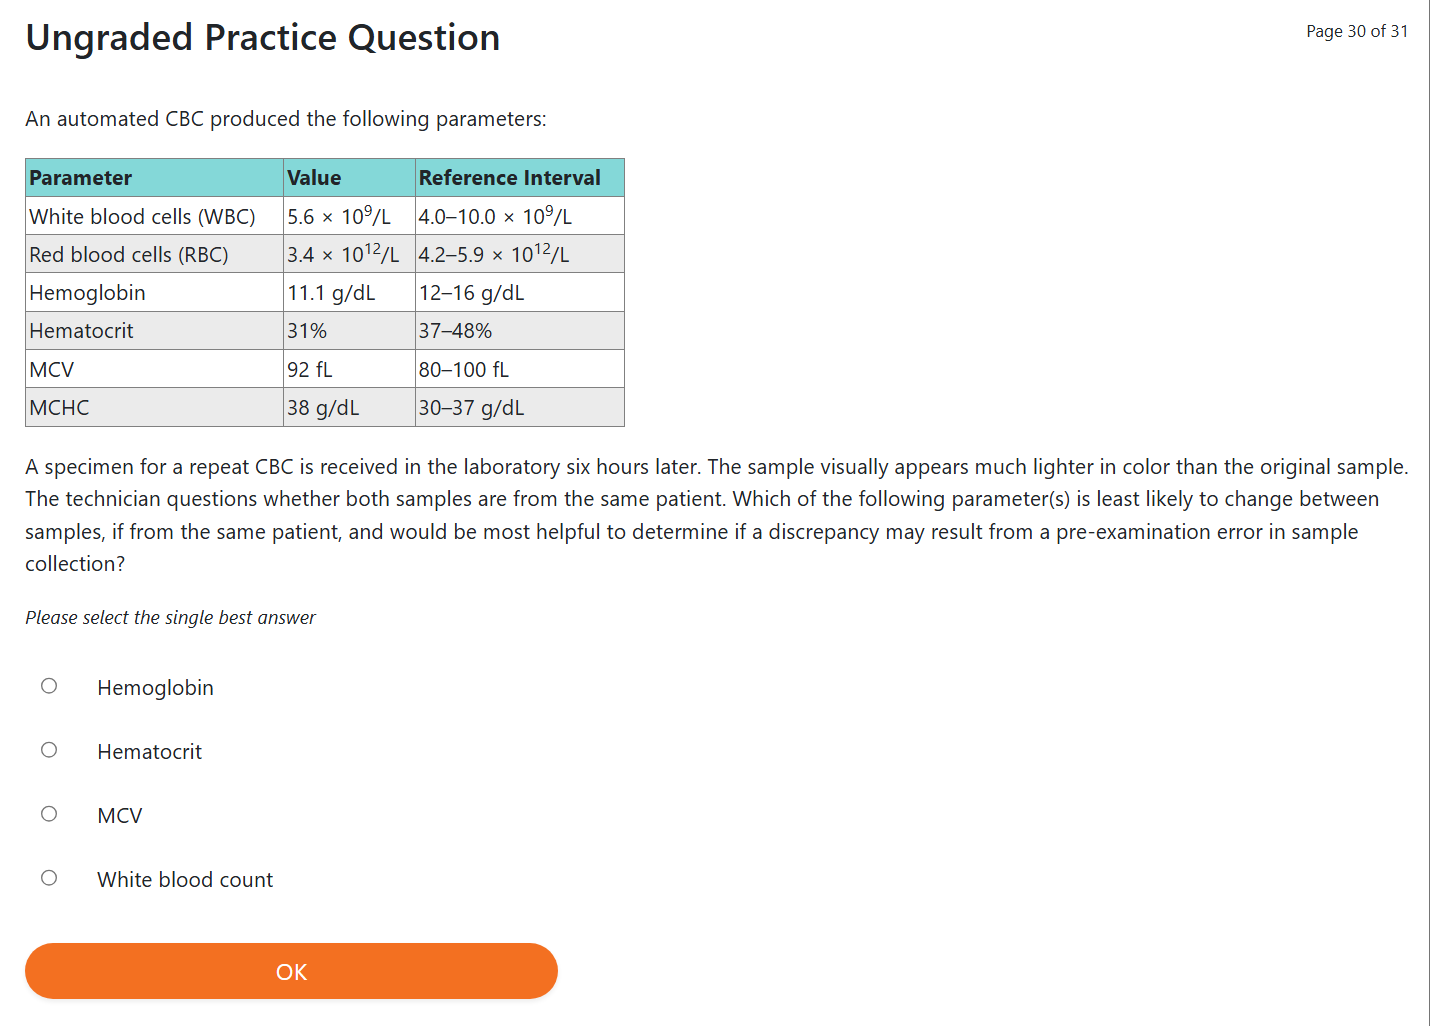
Hemoglobin × 3 ≈ Hematocrit
(This is the Rule of 3.)
2. Evaluate the MCV (average RBC size)
MCV tells you what size RBCs you should expect on the smear:
MCV normal → normocytic (average size)
MCV low → microcytic (small)
MCV high → macrocytic (large)
BUT:
This can be misleading because mixed small + large cells can give a normal MCV (since it’s an average).
3. Evaluate the MCHC (hemoglobin concentration inside RBCs)
MCHC normal → normochromic
Normal hemoglobin amount
Central pallor = 1/3 of cell
MCHC low → hypochromic
Less hemoglobin
Larger central pallor
Often seen with microcytosis
MCHC high → rare
True hyperchromic cells = spherocytes
Spherocytes have no central pallor and more concentrated hemoglobin
BUT MCHC can be falsely high due to:
Lipemia (fat in plasma)
Hemolysis (RBCs breaking)
Agglutination (RBC clumping)
4. Evaluate the RDW (variation in RBC size)
RDW is seen by looking at the width of the RBC histogram curve.
Higher CV or SD → more size variation → wider curve
Normal RDW → cells all similar size → narrow curve
High RDW → mixed sizes → anisocytosis
5. Look at Curve Position (Left or Right Shift)
A curve shifted:
Left → RBCs are smaller than normal (<6 µm)
Right → RBCs are larger than normal (>8 µm)
This shift reflects MCV changes.
Mean Cell Hemoglobin (MCH) Clarification
MCH = hemoglobin amount per RBC
MCHC = hemoglobin concentration inside RBC
MCV and MCHC are the main indices used when evaluating anemia.
But:
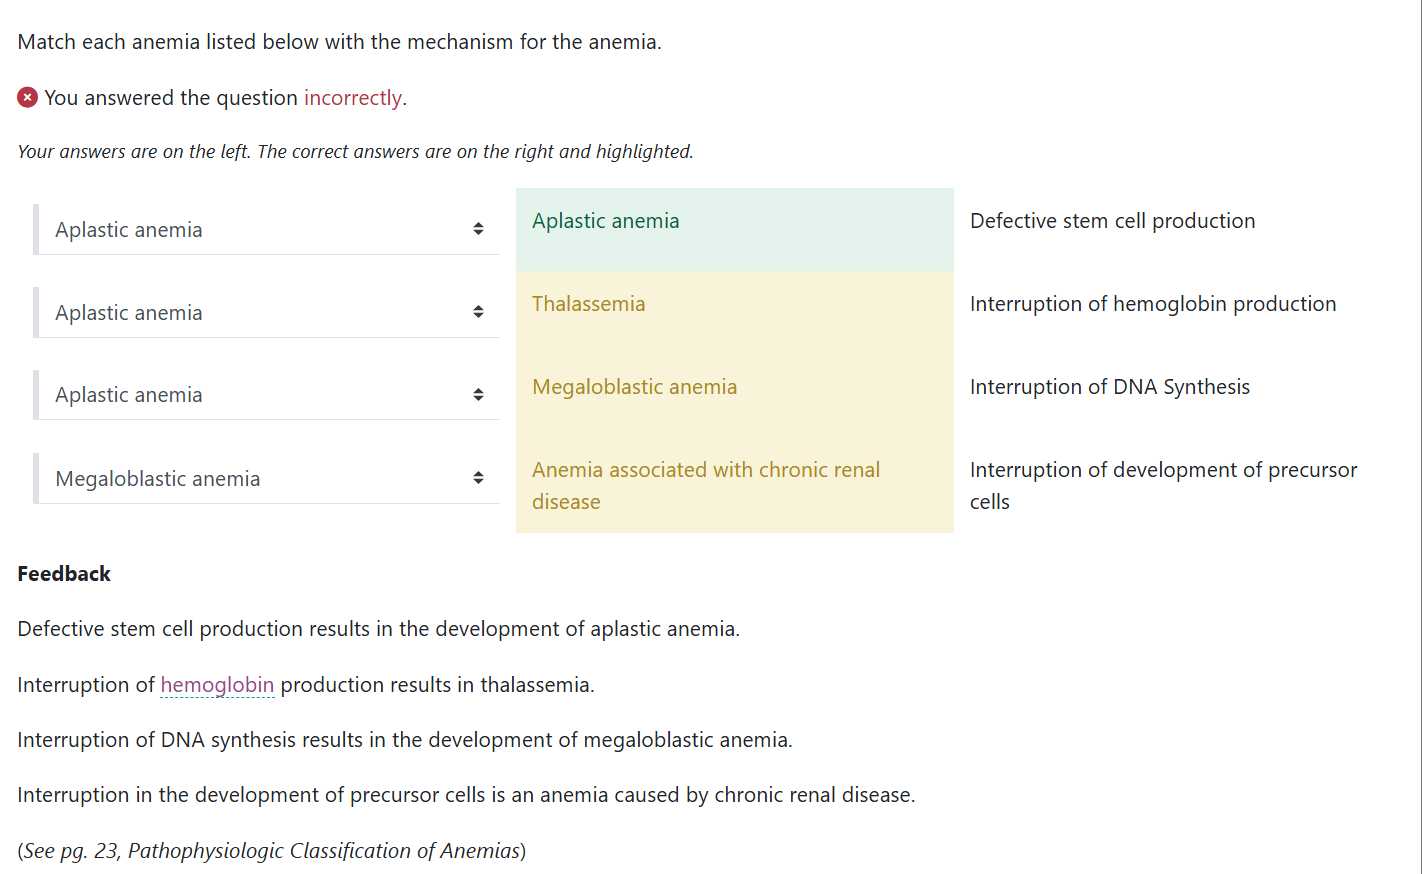
In conditions with low RBC volume (thalassemia, iron deficiency)
Or high hemoglobin loading (hemochromatosis)
→ MCHC becomes less useful because volume changes distort it.
MCH usually stays stable, so when it drops, it can signal:
Thalassemia
Iron deficiency
Hemochromatosis (increased iron → affects hemoglobin loading)
hematocrit
What percentage of red blood cells are there as a percentage of total blood volume.
Lab reference ranges (normal values) may vary depending on patient population.
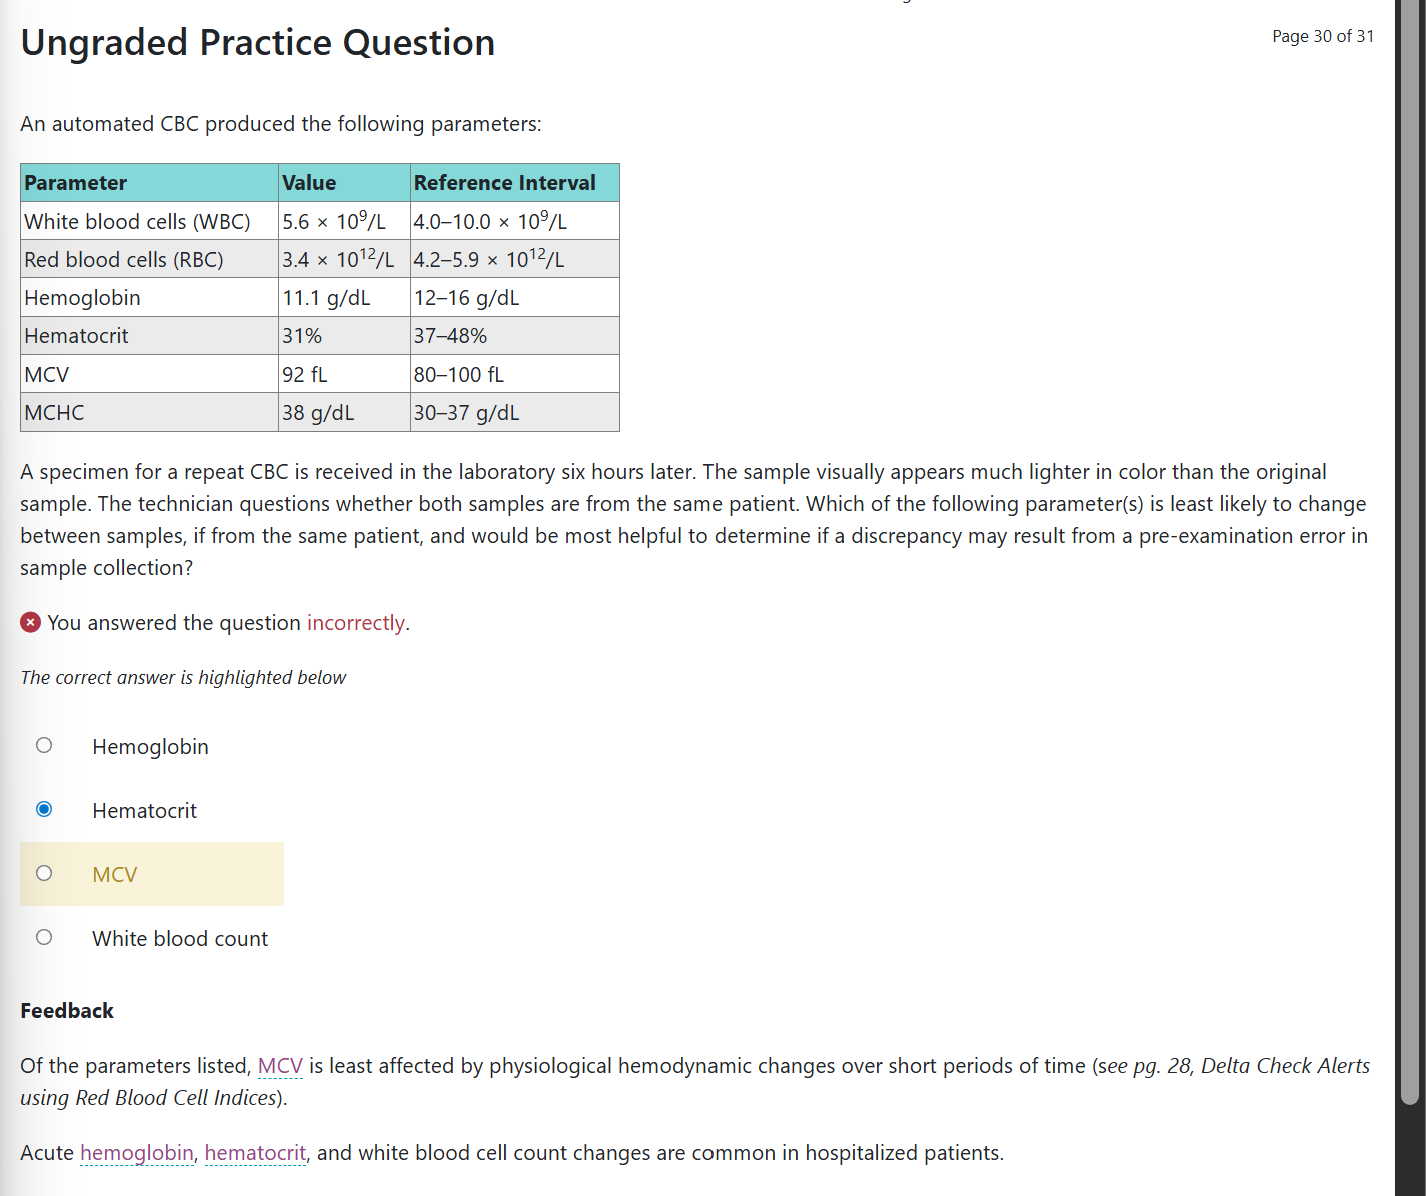
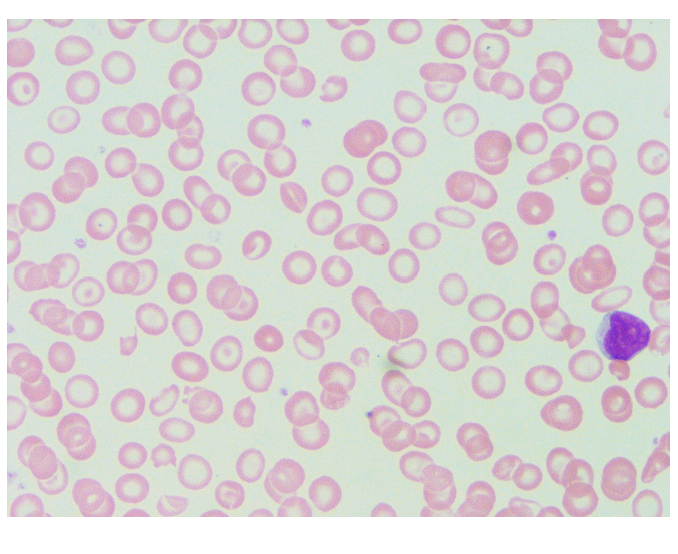
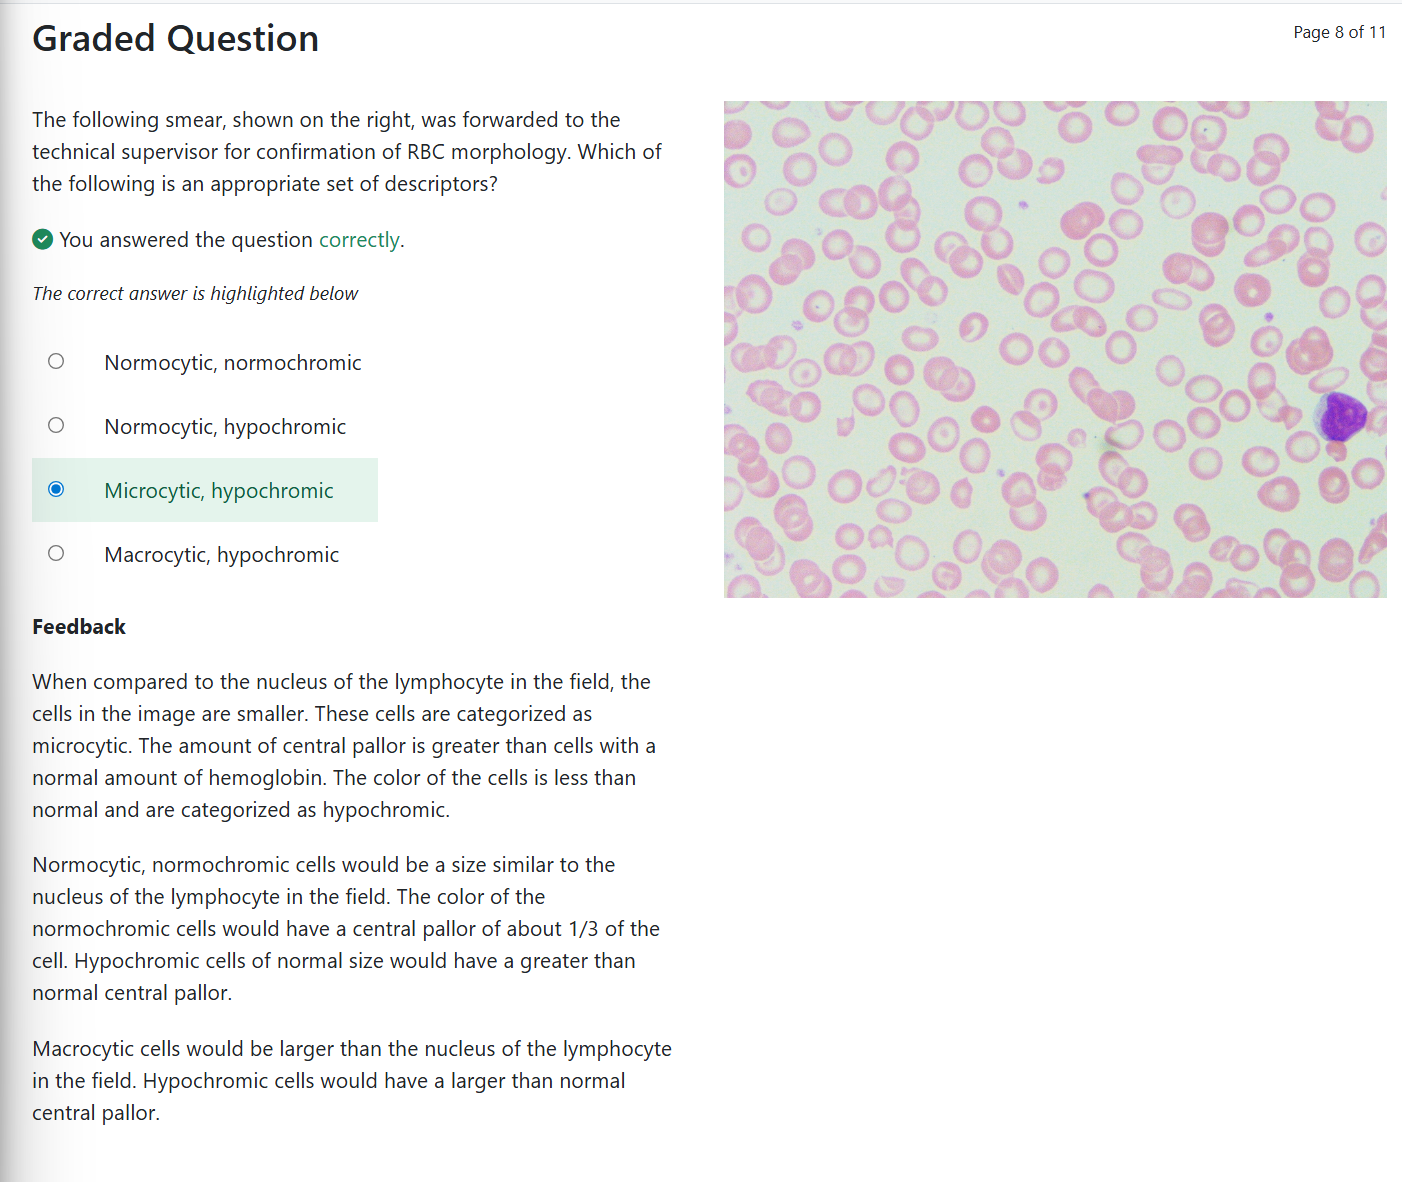
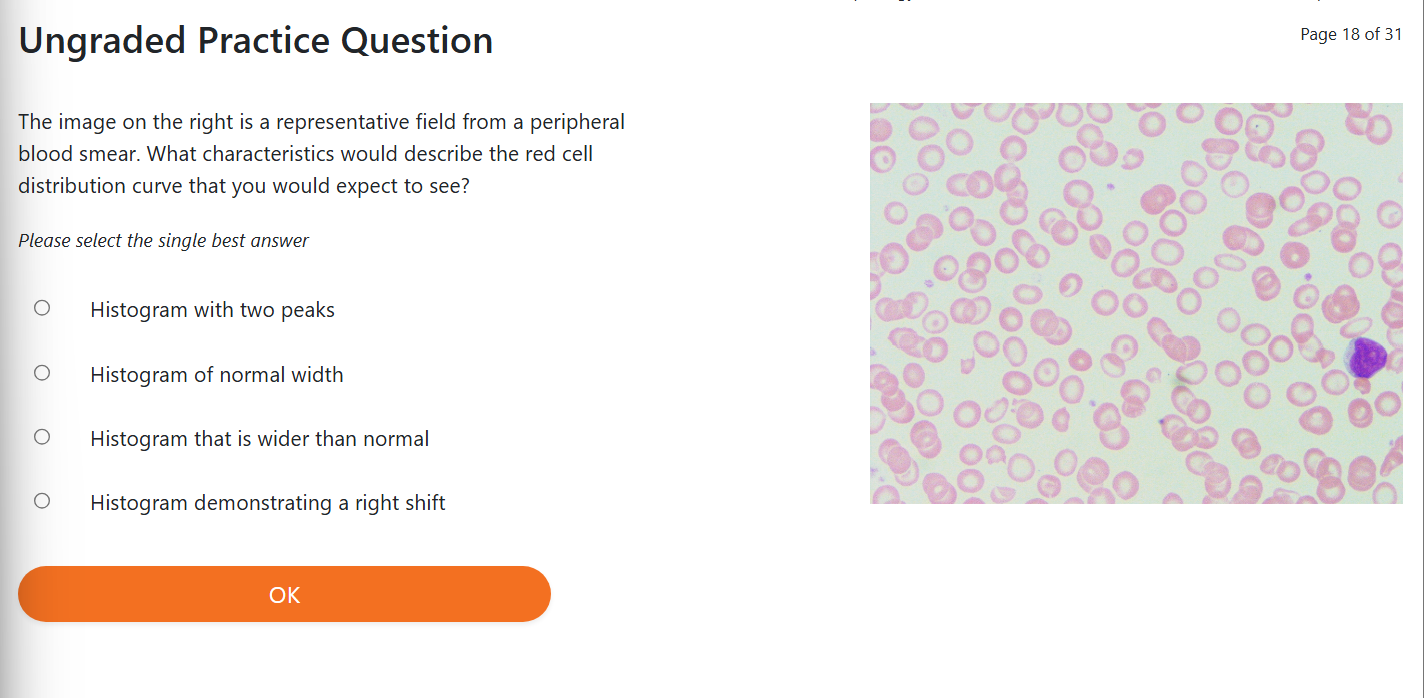
The following smear, shown on the right, was forwarded to the technical supervisor for confirmation of RBC morphology. Which of the following is an appropriate set of descriptors?
A | Normocytic, normochromic |
B | Normocytic, hypochromic |
C | Microcytic, hypochromic |
D | Macrocytic, hypochromic |