Data lit exam 2
 Call Kai
 Learn
 Practice Test
 Spaced Repetition
 Match
 Flashcards
 Knowt Play
1/77

There's no tags or description
Looks like no tags are added yet.
78 Terms
Data Can be
Quantitative (numerical values) or qualitative (categories or verbal descriptions)
It is possible to some extent to switch between these formats, by putting quantitative values into categories or by counting the examples of different types of categories.
Goals of Data Visualization:
Communicate information to an audience
Leave out unnecessary flourishes
Present essential information in a way that is easy to understand
Visualization must…
…convey information to human perceptual systems
To do this well, we need to understand the quirks of human perception
Perception Facts
Perception Fact 1: Perceptions are based on surrounding environment:
Perception Fact 2: Law of similarity: “the mind groups similar elements into collective entities. This similarity might depend on relationships of form, color, size, or brightness.”
Perception Fact 3: Law of proximity: “spatial or temporal proximity of elements may induce the mind to perceive a collective entity.
Perceptual Fact 4: Color perception is subjective: Red-green color blindness is genetically transmitted to offspring via the X chromosomes. It affects 5-8% of males and 0.5-1% of females globally.
Perception Fact 5: People have aesthetic preferences. Beautiful graphs are trusted more.
If we are going to present data visually, we need to make sure people understand how to take meaning from it.
Types of Plots:
Different types of plots use different encoding objects (such as bars, lines, points, etc).
An encoding object needs to have a value-encoding attribute (such as height, length, position, color).
Pie Charts
To show proportions of different categorical and mutually exclusive options.
Proportions need to add up to 1 (percentages need to add up to 100%)
Value encoding attribute: area of wedge
Bar Plots
To compare values associated with separate (usually categorical) variables.
a. Encoding attribute is bar height
b. Can be vertical or horizontal
c. Can quickly become overwhelming if there are too many categories.
Can sometimes show data points: If ar values are an average over several individual numbers, it may be good to plot individual data points as well.
Bar plots showing averages should have error bars: or, the individual variability can be summarized with an error bar. Error bars usually describe standard deviation (how spread out the values are)
Line Graphs-
Lines connect data points.
Only appropriate when x values are quantitative and continuous (i.e. allows for interpolation).
Frequently used for time-series data.
Value encoding attribute position.
Color can be used to compare multiple trends on the same plot
Can involve 2 y-axes (with caution)
This can be used to show the relationship between two separate values over time.
Like bar graphs, line graphs can have error bars/bands when data is averaged cover individual points.
only use lines to connect sequential data. Missing points should not be represented with lines.
Scatter Plots
shows relationship between two quantitative values
encoding attribute: position (can also use size and color)
Shows every data point
Could easily be overwhelming & may require a legend (any plot using a different color, sizes, or symbols to represent different types of data needs a legend.)
A ‘best fit’ line may be plotted to summarize the relationship between the two values. These are frequently used to determine how correlated the two values are
Histograms
bar plots specifically that plot frequency, i.e. the number of times a certain value occurs in the data. Can be represented as a percentage or absolute value.
This visualizes the distribution of the data.
The value encoding attribute is bar height.
Can visualize how distributions change or compare between two groups
Bins (the width of those bars) determine how the quantitative values are divided up. Plot shapes and readability can depend extensively on bin widths.
Heatmaps
use color (encoding attribute) to display a matrix of values. Each combination of row and column is a single value associated with the given row and column label combination.
Choice of color can impact how strongly the trends in the data appear.
The Goal of a plot
to convey a message not just about selecting the right kind of plot, but also keeping it clear ,pleasant, and not misleading
Guidelines: “create the simplest graph that conveys the information you want to convey” “focus on visualizing patterns or on visualizing details, depending on the purpose of the plot.

Some principles for clarity/pleasantness…
Use color wisely- use color consistently (don’t have the same color mean different things and don't have different colors mean the same thing)
People tend to associate certain colors with certain concepts, like red for hot and blue for cold.
Don’t put too much information- can remove unnecessary labels if they cause clutter. Don’t be redundant. Don't add extraneous information.
Don’t put too little information- must add labels. If the font is too small it doesn't count & of the figure is too small it doesn’t count.
Potentially manipulative tactics
It is possible to deceive an audience (intentionally or not) by using a variety of different visualization practices that change the message that a graph portrays (without technically changing the data)
Many of these involve playing with axes value ranges or hiding individual data points
Inconsistent axis value spacing:
Readers may not notice the switch in value spacing and therefore interpret the strength of a temporal trend incorrectly.
Can have a similar effect as varying aspect ratio
Truncating:
Increases the perception of difference between the numbers; using absolute numbers downplays the difference. Either can be misleading.
Truncated axes are not always bad- depends on what size differences are known to matter.
The scientific study of judgment and decision-making:
Prolific and broadly relevant field
Has produced the first Nobel prize for a psychologist (Daniel Kahneman)
Kahneman’s dual-process model:
System 1 (Thinking fast)
Unconscious
Automatic
Based on experiences
heuristic-based , subject to emotions and stereotypes
System 2 (Thinking slow)
Conscious
Controlled
Based on consequences
Logical and systematic
(this model is prominent and has been critiqued)
Human decision-making matters in all domains!
Medicine
Psychopathology (deficits in decision-making)
Policy (for instance, health decisions)
Economic decision making
Traffic psychology
Decision-making in court
Social interactions
What are cognitive biases?
Cognitive biases are systematic deviations from rational/optimal thinking. Includes errors that are not random but specific, consistent, and predictable.
Cognitive biases are believed to result from misapplied strategies, and are not simply mental flaws.
Taxonomy of Cognitive Biases :
Heuristic: results from evolutionary or information processing constraints; mechanisms work well in most circumstances, but are prone to break down in systematic ways.
“Any approach to problem solving that employs a pragmatic method that is not fully optimized, perfected, or rationalized, but nevertheless “good enough” as an approximation or attribute substitution.”
Use of stereotypes
Fundamental attribution “error”
One-reason decision strategies
HBs may come out more under conditions of time pressure, cognitive load, or low energy/motivation (i.e. when subjects are relying on “system 1” thinking)
Error management bias:
selection favored bias toward the less costly error; although error rates are increased, net costs are reduced.
E.g., it makes sense to design mammograms such that they overestimate cancer risk, rather than underestimate.
Artifact
Apparent biases and errors are artifacts of research strategies; they result from the application of inappropriate normative standards or placement of humans in unnatural settings.
Lab settings are very artificial:
How is the question formulated (e.g. frequencies or probabilities)
Possible alternate meanings of words
The importance of content versus abstract logic
Gambler’s fallacy
The erroneous thinking that a certain event is more or less likely, given the previous series of events
Why is this a fallacy? If the events in a series are independent from one another, then by definition, each event cannot influence the next event.
Occurs due to misconstruing independent events to be dependent
If a future event actually depends on the outcome of past events, then it is not a fallacy.
Anchoring
The phenomenon by which we seek a reference point and then make decisions/ estimations based on this (potentially arbitrary) reference point.
Anchoring is why first impressions can be very important (even when incorrect)
Once anchored, it’s can be very hard for one to break away
Decoy Effect (form of Anchoring):
When we are choosing between two alternatives, the addition of a third, less attractive option (the decoy) can influence our perception of the original two choices.
The decoy acts as a type of anchor that sets the expectations for the other options.
Framing Effect
absolute vs relative numbers
ex: Framing 1 (absolute survival): 96% vs 94% alive • 52% of patients responded that the new drug is clearly or somewhat better. • 52% of doctors responded that the new drug is clearly or somewhat better.
The sunk-cost fallacy:
the tendency to follow through on an endeavor if we have already invested time/effort/money into it whether or not the current costs outweigh the benefits.
Availability heuristic:
People assess the frequency of something or the probability of an event by the ease with which it can be brought to mind.
Events that are familiar, more likely to be in the media, more recent, and more memorable are all more “available”
Confirmation Bias:
The tendency to search for, interpret, favor, and recall information in a way that confirms or supports one’s prior beliefs or values. It can feed into many cognitive biases (such as sunk costs or anchoring)
How should we address this? Look for falsifying or disconfirmatory evidence.
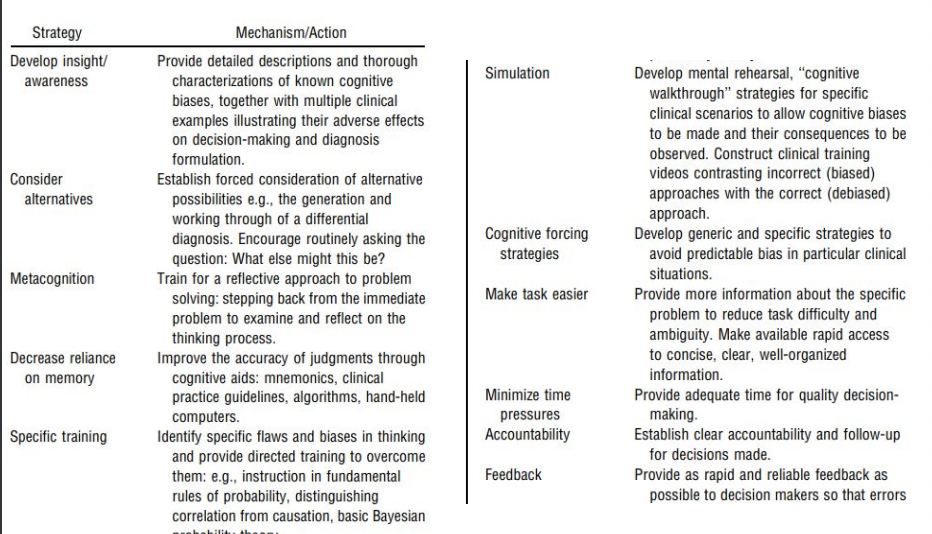
How to reduce biases in people
develop insight/ awareness
consider alternatives
metacognition
decrease reliance on memory
specific training
simulation
cognitive forcing strategies
make tasks easier
minimize time pressures
Accountability
feedback
Being data-literate
includes being aware of cognitive biases in yourself and trying to avoid them.
It also means being aware of cognitive biases in others and communicating in a way that will not activate them.
An important part of data literacy involves
understanding and interpreting probabilities.
Our intuitions are not always helpful here
Everyday inference
probability of a world state given observations:
I arrive on a subway platform. What is the probability distribution over wait time given the number of people waiting?
What is the probability that it is going to rain, given that its cloudy? Etc.
Judgment and production of randomness
Alternation rate: probability the next item in a binary sequence is different from the previous one. (fair coin tosses have an alteration rate of 0.5)
Falk (1981) examined both the judgement and productions of random sequences
People are skewed to think sequences with higher alteration rates are better examples of “randomness” and produce sequences with higher than .5 alteration rates.
Hot-hand Phenomenon:
Streaks stand out! Streaks are evidence of a “hot hand”. Successes breed more successes.
Gilovich, Tversky, Vallone (1985) claimed that the phenomenon is a cognitive bias due to a failure to understand randomness (claim of having a “hot hand” requires knowing what to expect by chance). (Originally postulated in basketball. )
hot hand fallacy
Multiple later studies found that a hot hand can exist, but that the effect is small.
It may not be a fallacy but still too easily claimed.
Not just with numbers: Pareidolia
Tendency to interpret an unclear (or random) visual stimulus as something familiar
“Seeing patterns in noise”
Might not have an evolutionary function
Why data interpretation matters:
If we don’t know what can happen “by chance”, we won’t know when we’re observing something surprising
This can cause us to assign meaning or search for an explanation for something that is in fact just random.
It can also cause us to ignore important signs or evidence by assuming they are just randomness
Coincidences
“Coincidence: a remarkable occurrence of events or circumstances without apparent causeal connection.”
Additionally, coincidences can be defined as an observation of two things co-occurring in a way that is surprising or unexpected to the observer.
“Curated coincidences”
Coincidental events has been selected for some salient property from a large number of events.
Similar to how a museum curator would select paintings for an exhibition.
If we don’t think about the curator, then the salient property seems very unlikely to have arisen by chance.
The curator is an essential element in the causal structure
examples in everyday life:
Hearing a story of when a psychic’s predictions came true
A friend noting the parts if your personality that align with your zodiac sig
Perceptual curated coincidence.
What are the possible reasons for experiencing a ‘coincidence’?
Random event, no special cause, follows the expected probability (you were surprised because you just had a bad intuition about the probability)
Random event, but does violate expected probabilities because it was cherry-picked to b shown to you” (“curated” coincidence)
Not a random event, violates expected probabilities because it was designed to do so (“staged” coincidence)
Staged Coincidences:
could be used to make people believe things that are unlikely to be true.
E.g., you run into your crush at a restaurant you like and think maybe they went there on purpose to see you. Turns out, your friend invited them to try to stage a run-in with you.
In all cases, coincidences depend on what we already expect or believe. They can possibly be hints that we need to update our beliefs.
Coincidence and correlation in science:
A single coincidence is insufficient to be used as evidence in a scientific setting. However, if we collect enough data, we can calculate a correlation coefficient.
Correlations don’t immediately imply causation:
The natural tendency to believe that correlation implies causation gives rise to “false-cause” fallacies (believing something is a cause just because it is associate with another thing)
Specific version:
Post hoc, ergo propter hoc fallacy (after this, therefore because of this)
Data Literate Approach to coincidence:
Consider if you know what randomness would look like
Ask yourself if there may be a curator or stager behind this
Gather more data to see if the coincidence actually represents a large correlation
Consider if this correlation points to likely causal relationship
Determine the extent to which you should update your theory of how the world works based on this new information.
Basic Probability Facts:
Possible values for probabilities range from 0 to 1
0= impossible event
1= certain event
The sum of all the probabilities for all possible outcomes is equal to 1.
Note the connection to the complement rule.
Addition rule- the probability that one or both events occur
Mutually exclusive events: P(A or B) = P(A) + P(B)
Not mutually exclusive events: P(A or B) = P(A) + P(B)- P(A and B)
Multiplication rule- the probability that both events occur together
Independent events: P(A and N) = P(A) * P(B)
P(A and B) = P(A) * P(B|A)
Conditional probability:
Probability of one event given another
Probability that you are in a good mood given that it is raining outside
Notation: p(you are in a good mood| it is raining outside)M
P(A|B) ≠ P(B|A)
EX: P(card is red|card is diamond) > p(card is diamond|card is red)
This asymmetry is frequently due to the different base rates: The overall prevalence of each of the events is not the same. Base rate neglect is a known cognitive bias.

Bayes’ Rule:
Tells us how to combine prior information with current evidence to update our beliefs.
Mathematical rule to convert a conditional probability into the “reverse” conditional probability.
Prior (prior probability / prior distribution): your initial belief or probability about a parameter or hypothesis before you see any new data. Base rates?
Likelihood: the probability or plausibility of observing your actual data, given that a specific hypothesis or parameter value is true.
Posterior (posterior probability / posterior distribution): your update belief after you combine your prior belief with the observed likelihood using Bayes’ Rule. (See brightspace for COVID example) It is the conclusion (posterior) is the result of combining current evidence (likelihood) with existing knowledge of the world (prior).

Base Rate Fallacy:
Focusing on the event-specific information: someone is infected, what is the probability that they are vaccinated?
And ignoring the overall prevalence (i.e. base rates): how many people are vaccinated overall?
Also called base rate neglect
Survey
Method of gathering information using relevant questions from a sample of people with the aim of understanding populations as a whole.
Opinion Poll
Type of quick survey asking people for their opinion, e.g., about a policy or about a candidate for public office.
Why Surveys & Polls:
Understand what people think about various issues, what problems they face, which issues they care about…
For politicians to understand the people they serve
For universities/profs to understand their students
To survey opinions on urgent social problems
To test marketing and product ideas
To understand human thinking and decision making
The results of polls offer a snapshot of human belief at a specific point in time, which can be helpful for reporting, policy making, and longer term analysis.
Fundamental Goal of Surveys and Polls:
To make statements about a population
This class, NYU, NYC, The US, The world could all be populations of interest
But you often can;t survey entire populations.
Possible for this class. Perhaps possible, but very difficult for NYU.
Impossible food NYC, The US, The World
So, we survey a sample, which is a subset of the population, and then make inferences about the population
Sample size is the number of people in the sample
Fundamentals of Surveys and Polls:
Sample: a set of people who will answer the questions
Ideally large & representative of the population we want to generalize to
Questionnaire. A set of questions to capture what we want to learn
Typically multiple-choice or Likert/rating scale
Mode of interview, How we ask the questions:
In-person, mail, phone, online…
All of the above can affect the accuracy of survey/poll results!
From Sample to Population:
EXQ: Imagine that 10 of you were asked to complete the mid-semester feedback form. The mean approval rating was 4. Can I assume that the mean of the entire class (180 students) is exactly 4?
EQA: No, because of inevitable sampling errors that cannot be avoided. Those 10 people may be, by chance, more or less happy with the course than the average. There will always be some error when going from a sample to a population.
EX2: If I sample 3 of you and get a mean rating. And then sample a different 3 and calculate their mean. And then another 3 and another 3… the average rating I get from each sample will differ.
That is, if we sample 3 random students repeatedly, there will be high variability in the mean.
How much variability should we expect in the outcome, if this survey were conducted over and over?
If a survey were conducted repeatedly under identical conditions, the estimates would bounce around a central value due to sampling variability (random chance in who happens to be selected
Larger sample size : the outcome varies less around the mean (tighter clustering in histograms)
At larger sample sizes, observed percentages cluster more tightly around the theoretical percentage. The 95% CIs are narrower. And therefore so is the margin of error.
95% Confidence Interval:
The range within which 95% of the simulations/ samples’ outcomes fall
Margin of error:
half the 95% confidence interval
As sample size increases, the margin of error decreases
For different sample sizes and outcomes:
In election polling the amount of error depends on the true level of support (i.e. the full population mean) as well.
This is because of floor and ceiling effects (support can’t go below 0% or above 100%)
Law of Large Numbers
as the sample size of a random experiment increases, the average value of the outcomes will converge to the expected value, or true probability (i.e. the population mean).
Larger sample = lower sampling/statistical error or lower margin of error
There can still be systematic errors
Systematic errors are due to biased samples or other flawed design that cannot be addressed by large samples.
EX: 1936 elections
BUT
Larger samples are not more representative:
Common misconception: that larger samples are more representative & more externally valid (ie., we can generalize the findings to more populations)
Think Buzzfeed polls.
Likely contains a high proportion of young, online people. This is a convenience sample.
Systematic error occurs for many reasons:
Some people are easier to reach or are more willing to participate (e.g., people with stronger opinions)
The source (e.g., Fox news vs CNN) or topic (e.g., vaccines) may affect who participates
People lie in surveys, even for harmless reasons (e.g., to make themselves look or feel good)
Misleading question wording
Statistical versus Systematic Error:
Statistical error: due to limited sample size. Results from randomness in sample choice. Larger samples can minimize this error.
Systematic error: due to biases in selecting your sample and other design problems. Larger samples cannot minimize this error.
To avoid this we need representative samples
When there is systematic error, larger sample sizes will simply reduce variability (creating a façade of precision), but they will converge around the wrong mean.
Methods used to collect representative samples:
Random selection: Randomly contact respondents to avoid selection bias.
but not everyone who is contacted participates
some groups (e.g., more educated, higher income) are more likely to participate
Weighting: mathematically boosting (or providing a higher weight to) the voices of people who belong to groups that are less likely to participate in polls
Oversampling: the researcher intentionally overrepresents one or more groups for which they expect lower representation.
Crafting a questionnaire: Content of question
Demographic - Identity information (e.g. gender, age, etc).
Important for representative sampling
Can break down data according to demographics
Opinion - understanding a population’s subjective views on topics
Knowledge - determine how much a population knows about something (i.e. testing objective facts)
Crafting a questionnaire: Format of the question -multiple choice
Be clear about whether the survey taker should choose one ("pick only one”) or several ("select all that apply").
Think carefully about the options you provide, since these will shape your results
Data.
The phrase "of the following can be helpful for setting expectations.
For example, if you ask What is your favorite meal" and provide the options "hamburger and fries", "spaghetti and meatballs", there's a good chance your respondent's true favorite won't be included. If you add of the following the question makes more sense.
Crafting a questionnaire: Format of the question- Likert Scales
are commonly used in market research when dealing with single topic surveys. They're simple and most reliable when combatting survey bias.
For each question or statement, subjects choose from a range of possible responses. The responses, for example, typically include:
+ Strongly agree
+ Agree
+ Neutral
+ Disagree
+ Strongly disagree
Crafting a questionnaire: Format of the question-Open field Questions
This format allows survey-takers to answer in their own words by typing into the comments box.
When writing a text entry question...
Use open-ended question structures like How do you feel about.. If you said x,
why? or What makes a good x?"
Open-ended questions take more effort to answer, so use these types of questions
sparingly.
Be as clear and specific as possible in how you frame the question. Give them as much context as you can to help make answering easier. For example, rather than "How is our customer service?", write "Thinking about your experience with us today. in what areas could we do better
How Formatting matters:
The way questions are framed, the context in which they appear, and the choices that accompany them can all influence how a subject responds.
When these formatting choices consistently influence responses in a certain direction, it can heavily skew the results of a poll.
Pollsters need to try to prevent these effects when wording and formatting their questions. To do so, they need to understand human psychology
How question wording matters: Double-barreled questions:
Ask respondents to evaluate more than one concept in a single question. This is confusing. Better to ask two separate questions.
How question wording matters: Avoiding reactance:
Consider whether certain words may produce bias, be viewed as biased or offensive, or trigger an emotional reaction.
Example: Support for expanding “assistance to the poor” vs Support for expanding “welfare”
How question choices matter:
Choosing from a set of options versus allowing open text entry can return very different results
Forced-choice questions tend to yield more accurate responses than select-all-that-apply questions, especially for sensitive questions.
How question framing matters:
Acquiescence bias: Respondents have a greater tendency to agree with statements on surveys, especially respondents lower education levels
Even more pronounced when there’s an interviewer present
How question order matters:
Order effects: Questions early in a questionnaire can have unintended effects on how respondents answer subsequent questions
Polls can be illegitimate:
AAPOR joins the Research Industry Coalition and the National Council on Public Polls in condemning certain misleading practices sometimes performed in the name of research, In no case are the following practices deemed legitimate or acceptable elements of professionally conducted research:
1. Requiring a monetary payment or soliciting monetary contributions from members of the public as part of a research process.
This set of practices amounts to fundraising under the guise of research (frugging). In some cases, unwary members of the public are enticed to contribute money as a condition of gaining some future benefit from their participation. it takes unfair advantage of the cooperative attitude that a majority of the public manifests when asked to take part in a legitimate information-gathering process.
2. Offering products or services for sale, or using participant contacts as a means of generating sales leads.
A common practice is to gain entry or acceptance in order to make a sales pitch by initially defining the contact as being made for "research purposes. This trades on the prestige of science, and it exploits the willingness of the public to reveal information about themselves in the public interest. In some cases, questions establish respondents' susceptibility to sales pressure or their interest in some product or service. Follow-up contacts are then made to those so identified, all under the guise ofạresearch (sugging).
3. Revealing the identity of individual respondents to a survey or participants in a research process without their permission.
It is normal research practice to pledge anonymity or confidentiality to the public in order to secure their cooperation and frankness in responding to questions.
Revealing the identity of individuals, for whatever purpose, is a violation of that pledge unless a respondent's prior informed consent has been obtained.
4. Representing the results of a self-selected poll as if they were the outcome of legitimate research.
Write-in, call-in, and interactive polls have become increasingly common. These "polls" report the opinions of only those people who called in, and not those of the general public. AAPOR believes that any publicizing or promotion of such activities not only damages legitimate market and survey research but can be very misleading when used to influence public policy or simply to disseminate information about the general public.
Polls can be misused/manipulated:
By using misleading question wording, choice wording, etc
By collecting biased samples
By simply making up results
Knowledge of public opinion can sway public opinion, which provides an incentive to make fake polls
Two prominent uses of polls/surveys
1. Psychology Research
2. Election forecasting
WEIRD
W- western
E- educated
I- Industrialized
R-rich
D- Democratic
Claims of Henrich et al.:
1. The behavioral sciences database is narrow, e.g. American undergraduates are 4000 times more likely to be included as a participant than a randomly selected person outside the West.
2. Researchers jump to conclusions about the generality (external validity) of their findings.
3. In many cases, non-WEIRD samples are different from WEIRD samples. In some cases, WEIRD samples are on an extreme end.
People from different cultures can display different cognitive and, even different perceptual, tendencies
What Henrich et al. do not claim:
People don’t have any/many commonalities: “We expect humans from all societies to share, and probably share substantially, basic aspects of cognition, motivation, and behavior .”
It is never justified to only use a WEIRD sample: “Exclusive use of WEIRD samples is justified when seeking existential proofs.”
It is never justified to generalize from a WEIRD sample to a population:
“If one had good empirical reasons to believe that little variability existed across diverse populations in a particular domain”
“As long as one’s samples were drawn from near the center of the human distribution”
Lessons from WEIRD sampling:
WEIRD samples can still be useful
But researchers need to understand that they will not always be representative
Shouldn’t make general statements about human psychology if only found in a WEIRD sample
Results of cultural comparisons can be interesting!
What is prediction/forecasting?
In electoral prediction, the goal is to predict who will win an election, or the probability for each candidate winning
What goes into the FiveThirtyEight forecast:
National polls State polls
Bayesian aspects:
Sample sizes of polls
Historical accuracy of polls
Large number of simulations ○ For a given state, factor in the polling information from "similar states"
Economic data (growth, inflation, unemployment)
Challenges of prediction/forecasting
Unanticipated sampling biases (in addition to usual/anticipated sampling biases):
Supporters of one candidate are more willing to participate
Requires predicting not just people’s opinions but also who will vote
Requires understanding how much each voter can actually influence the outcome given not everyone has equal influence (gerrymandering, swing states, etc)
Requires accounting for changes in people’s opinions in the days leading up to the election, especially for undecided voters
Exit Polls
Traditionally, exit polls are conducted via in-person interviews with voters outside of polling centers after they've cast their ballot. Pollsters are posted outside of voting centers ahead of and on Election Day.
Pollsters also conduct phone and text surveys to reach voters who mailed in their ballots.
These polls are anonymous. When surveyed outside of polling centers, voters write their answers on a piece of paper. When pollsters reach out to mail-in voters by phone or text, personal information isn't retained.
These surveys typically take about five minutes to complete.