growth and development
 Call Kai
 Learn
 Practice Test
 Spaced Repetition
 Match
 Flashcards
 Knowt Play
1/53

There's no tags or description
Looks like no tags are added yet.
54 Terms
how to tell if countries are converging in growth
plot growth (Y) against initial income (X) , for a cross-section of countries
if poor countries converge to the income levels of richer countries we should see a negative slope
as initially poorer countries must grow more quickly than initially richer countries for convergence to take place

what is a good measure for growth?
life expectancy
GDP per capita
unemployment
quality of life
productivity
happiness
infant mortality
what GDP tells us about growth?
gdp reflects value added (each process generating value added will generate income)
that income will either be paid to workers (in wages) or owners of capital (company owners/ shareholders)
Y=wL+rK
hence the process of raising GDP is also the process of raising income, as real wages rise in line with GDP per capita over long spans of time
growth
growth in GDP or productivity
→this growth can occur without devevelopment
development
improvements in alternative indicators - health, education, rights
this development can occur without growth
calculating nominal GDP
the total of P x Q

calculating real GDP
example: using 2015 as the base year for calculating real GDP in 2016 → then use prices from the base year
real gdp is nominal gdp adjusted for prices
→ using the base year shows how much the volume of a country’s production has changed since the base year

calculating the GDP deflator
nominal gdp / real gdp
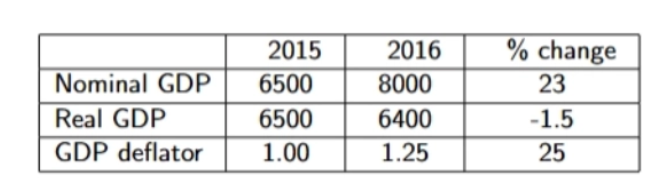
nominal growth rate
≈ the real growth rate + inflation rate
purchasing power parity framework
PPP in exchange rate rate = nominal gdp / pp gdp
so, US PPP gdp shows the nominal gdp that the country would’ve generated if the prices of each good were the same as the UK
measures the relative size of two economies

at the PPP exchange rate:
one pound and the equivalent amount of dollar have the same purchasing power
would only be equivalent when E = P’/P
the big mac index
in the long run, exchange rates should move towards the rate that would equalise the prices of an identical basket of goods and services in two countries
example: average price of a big mac in 2016
america ($5.04) , china ($2.79 at market exchange rates)
→ so the Yuan was undervalued by 45% at the time
production function, graph
expresses the relationship between factors of production and the quantity of output produced
y=f(n), δf/δn>0, δ²f/δn²<0
this may differ between two countries with separate production function lines Ya and Yb due to:
productivity
factors of production (labour, capital, ect.) / factor accumulation

what assumptions does the Solow model impose?
countries produce and consume only a single homogeneous good
convenient to think of its output as units of a country’s GDP
implication: no international trade in the model
technology is exogenous (external cause/origin)
difference between exogenous and endogenous ?
exogenous is originating from an external cause by other variables outside the model, outside the system
endogenous is originating within the system, influenced by internal variables
Solow growth model - production function
Y=A F(K, L)
often take A as given as technology is exogenous
subject to:
diminishing returns
constant returns to scale (when powers of K and L add to 1)

diminishing returns assumption in Solow model:
returns to capital and labour are diminishing
if we hold other inputs fixed and increase (eg. capital) this adds less and less to output , the more capital we already have
providing workers with extra machinery makes them more productive, but at a decreasing rate
constant returns to scale (CRS) meaning
multiplying all units by a constant will multiply output by the same number
if we assume this at the aggregate level, it amounts to saying that countries with small or large populations can achieve the same living standards

constant returns to scale in the production function, with y
for 0<a<1
so the first-order condition is positive, and the second order condition is negative → convave
f’(k)>0 , f’’(k)<0

equation for labour efficiency in the production function
where Y=F(K,AL)
k^~=K/AL for capital per efficient unit of labour
so output per capita (y), depends on A and also on capital intensity k^~, yet this isn’t independent from the size of the labour force
investments (savings) rule in solow model
I=sY
in per capita terms : i=sy
population growth in the solow model
the population is assumed to grow at an exogenous rate n
we assume full employment
after taking log and differentiating w.r.t:
L^. / L = gL = n
as the growth rate of the population (L) is n

capital accumulation in the solow model
aggregate capital accumulation can be written as:
change in capital = new investment - depreciation of capital
K^. = δK/δt
sY; workers save a combined fraction of their income
Y=wL+rK
the economy is closed: saving = investment
δK : a constant fraction of capital depreciates (eg. old computers)

capital accumulation per worker equation:
as k=K/L logk=logK-logL k^./k = K^./K - L^./L
so K^./K = k^./k + L^./L = s Y/K -δ
replace L^./L = n
turn Y/K into y/k by dividing by L on both numerator and denominator
k^./k = s y/k -δ -n
k^. = sy -(n+δ)k

causes in changes of capital per worker
investment per worker increases k
depreciation per worker reduces k
population growth reduces k
aggregate resource constraint in the solow model
all labour is used in production (labour market clears so, demand=supply, of labour)
all output is either invested or consumed:
Y=C+I
in per capita terms:
y=c+i
overview of solow model in per capita terms

capital accumulation equation in the steady state
in the steady state : per capita investment exactly offsets the reduction in the per-capita capital stock because of depreciation and population growth

what determines long-run output and capital?
sy=sk^α concave as y is concave, and 0<α<1
capital has positive but diminishing returns (sy becomes concave)
after k* capital per worker will be overtaken due to population and depreciation rate
capital can grow in short run due to factor (capital in this case) accumulation but faces diminishing returns in the long run → needs technological growth !
in steady k (capital per worker) and y (output per worker) = 0

where is consumption on the steady state long run capital and output graph?
the difference between y* and sy*
comparative statics - effect on an increase in the population growth rate
(n+δ)k changes gradient and gets steeper
k* decreases to k**
sy remains unchanged

comparative statics - effect on an increase in the investment rate
s increases
sy increases and the gradient increases, so it shifts up to s’y

alternative graph for comparative statics
shows that the growth rate of the economy (k^. / k) diminishes over time

properties of the steady state
changes in s and δ don’t change the growth rate in steady state as y=0
at steady state, k^. =0, denote steady-state value by k*
substituting the production function into the capital accumulation equation:
sk*^α - (n+δ)k* = 0
therefore: image
substitute this into the production function:
y*= [s / (n+δ) ] ^α /(1-α)
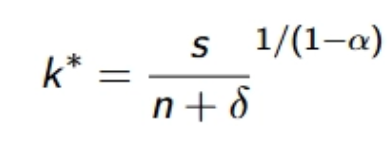
what does the (y*= [s / (n+δ) ] ^α /(1-α)) equation predict
higher population growth means lower income in the steady-state
a higher savings rate means higher income in the steady state

golden rule levels of capital and consumption

is the golden rule optimal from a welfare perspective?
golden rule applies only to steady state, economy may not be there initially
not clear what the welfare criterion is: should consumption today and consumption tomorrow recieve equal weight?
not clear if optimal investment should be a fixed fraction of output
convergence and the Solow model: how it works
convergence is about whether or not countries are moving towards one another, or further apart, over time
the solow model predicts countries will converge to their own steady-state growth paths
but if countries start out at similar income levels, this might lead to divergence
and divergence can also arise if the steady-state growth paths move further apart
eg. if saving rates rise in rich countries and fall in poor countries, this may lead to divergence
growth rate of technological progress (A)
technological progress is exogenous so growing at a constant rate
implication: technology available to firms is unaffected by actions of firms (R&D)
new growth theory relaxes this assumption

steady state per-capita technology variables are denoted as:
eg. y^~ for y^~=Y/AL
at the steady state the growth rates of y and k are:
gy = gk = g
balanced growth path
situation in which capital, output, consumption and population are growing at a constant rate
technological progress
source of sustained per capita growth
output and capital per worker both grow at the sane rate of technological progress
→ this explains the long-run increase in GDP per capita
→ without technological progress
gy = gk = g = 0
effect on an increase in the investment on growth of y
more capital provides growth yet this diminishes over time
growth rate in steady states converges back to g

effect of an increase in investment rate on income per person y
dlny/dt = y^. / y = g
the level effect is the higher growth yet this diminishes and converges to the slope of g over time

steady state value of k^~ , k*^~

subbing the value of k*^~ into the production function

wages in the steady state
wages rise in the steady-state for two reasons
capital accumulation
technological progress
positive technological progress induces extra capital accumulation, and this together with the technological progress will raise wages
→ if there were no technological progress, (g=o), capital accumulation would eventually cease, as would growth in output per capita and wages