error in epidemiological studies II: bias, confounding and interaction
 Call Kai
 Learn
Learn Practice Test
 Spaced Repetition
 Match
Match Flashcards
 Knowt Play
1/14

There's no tags or description
Looks like no tags are added yet.
Name | Mastery | Learn | Test | Matching | Spaced | Call with Kai | Chat |
|---|
No analytics yet
Send a link to your students to track their progress
15 Terms
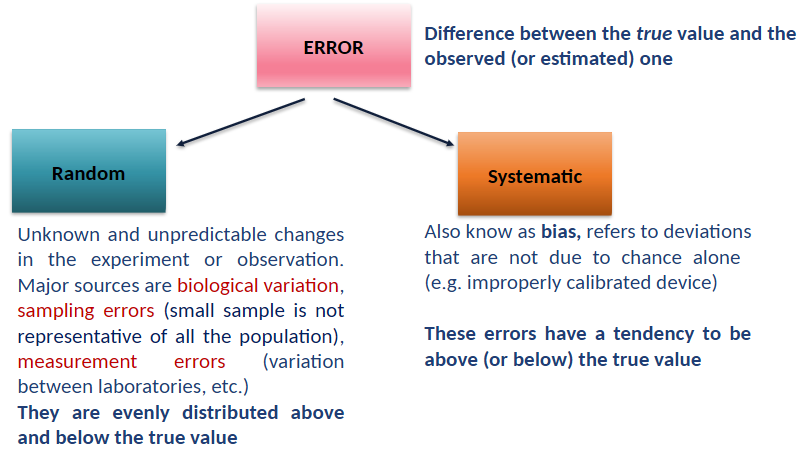
error in epidemiological studies
Note 1
Random error has no preferred direction, so net result approach zero when
averaging over a large number of observations. The estimate may be imprecise,
but not inaccurate
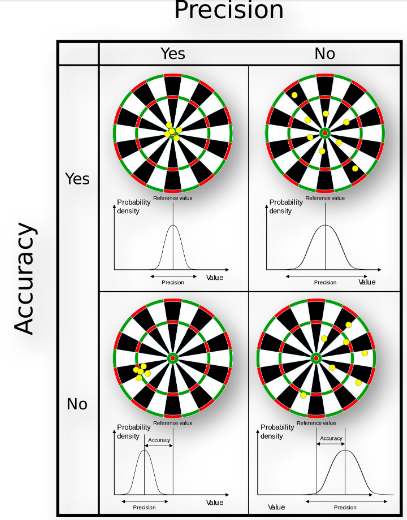
precision vs accuracy
Precision refers to how well repeated observations agree with one another
Accuracy refers to how well observed values agree with the true value

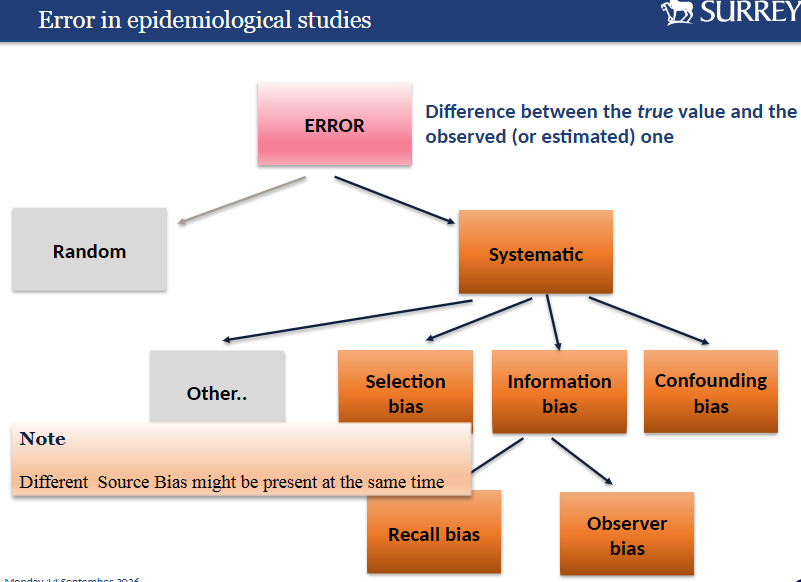
bias
a systematic deviation of results or inferences from the truth or processes
leading to such systematic deviation; any systematic tendency in the collection,
analysis, interpretation, publication, or review of data that can lead to
conclusions that are systematically different from the truth. In epidemiology,
does not imply intentional deviation
selection bias
systematic difference in the enrolment of participants in a study that leads to an incorrect result (e.g., risk ratio or odds ratio) or inference.
• The animal in the study are not representative of the population of
interest
• In case-control studies, controls are not drawn from the same
population as the cases
• In studies of occupational exposures when the general population is
used as the comparison group, as those who are not healthy are less
likely to be employed (Healthy Worker Effect)
information bias
systematic difference in the collection of data regarding the
participants in a study (e.g., about exposures in a case-control study, or about
health outcomes in a cohort study) that leads to an incorrect result (e.g., risk
ratio or odds ratio) or inference. In particular, measurements errors are referred
to as misclassification (e.g. imperfect testing).
• Incomplete medical records
• Misinterpretation of records
• Patients completing questionnaires incorrectly (perhaps because they
don’t remember or misunderstand the question)
• Differential recall of information by cases and controls: recall bias
• Bias in the information collected by the investigator (e.g. because
prior knowledge of the hypothesis under investigation): observer bias
examples of bias
Selection bias
Postal survey on the extent and impact on Schmallenberg virus: those who suffered the disease might be more/less likely to participate
Observer bias
Welfare assessment via visual inspection on farms. Minor non-compliances in good-welfare farms are more likely to be overseen than in poor-welfare ones
Recall bias
Case-control study of Johne’s disease (Paratuberculosis) in cattle. Farmers are
asked about movements of animals months to several years ago. Those affected
might make more effort in remembering animal movement
Selection bias
Age or weight of foetuses submitted to diagnostic laboratories younger/ older
heavier/ lighter than foetuses that aborted in the general population.

confounding bias
the distortion of the association between an exposure and a health outcome by a third variable that is related to both
Relationship between coffee drinking (exposure), heart disease (outcome), and a third variable (tobacco use). Advantages and disadvantages of different observational study designs

confounding
A confounding variable is an “extra” variable that you didn’t account for.
To be a confounder:
• The factor must be independently associated with the disease
• The factor must be also associated with the exposure being
investigated
• It should not lie on the causal pathway between exposure and disease
Effects of confounding:
• Confounding factors can lead to bias in the estimate of the impact of the exposure being studied.

how to deal with confounding?
At design stage (preferably!):
• Restriction: only select units similar in relation to the confounder
• Randomisation: clinical trials. Similar distribution of confounders in
both groups
• Pair matching - selecting for each case one or more controls with
similar characteristics (e.g. same age and habits)
• Frequency matching - ensuring that as a group the cases have similar
characteristics to the controls
At analytical stage:
• Stratification: estimate measures of association separately within
different levels of the confounding factor
• Statistical modelling: multivariate analyses can control for confounding
Detecting the presence of confounding
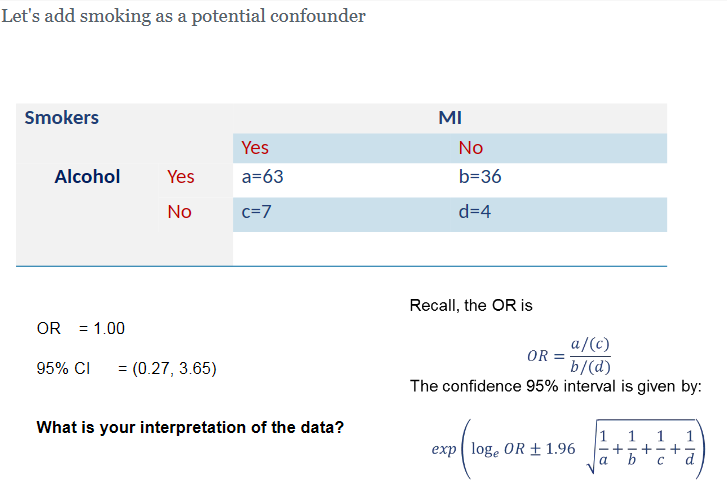
• Explore the degree of discrepancy between the crude and stratum-
specific estimates. example in image

cont
dont need to memorise formula
As rule of thumb, if the stratified estimates of association differ from the unadjusted estimate by 10% or more, then there is evidence of confounding.
The true odds ratio, accounting for the effect of smoking, is 1.0 (Maentel Hanzel OR , which is a weighted average of the stratum-specific ORs).
When confounding is present, as in this example, the adjusted odds ratio should be reported
Note
Smoking was a confounding factor and there appears (with this over simplified analysis) to be no association (odds ratio= 1.0) between alcohol and MI


interaction or effect modification
Two independent factors interact if the effect on disease of one of the variables differs depending on the level of the other variable.
Provides clues on biological mechanisms or pathways of action
Note I
The combined effect of Drink and Pill is not simply additive
Note II
A finding to be reported! It can provides clues on biological mechanisms or pathways of action.
• If there is only confounding: the stratum-specific measures of association
will be similar to one another, but they will be different from the overall crude
estimate by 10% or more


confounding vs interaction
If there is neither confounding nor effect modification: The crude estimate of association and the stratum-specific estimates will be similar. They don't have to be identical, just similar.


• If there is only effect modification: The stratum-specific estimates will differ
from one another significantly

Confounding vs Interaction
Confounding:
• Remove or account for the effect of the confounder in order to get
nearer to the truth (actual measurement of effect).
• Effect of the exposure is the same for all categories of the
confounding factor
Interaction
• Interaction is an important property of the association between two
factors (detect and describe)
• The factor modifies the effect of other: effect varies across category of
the other factor
summary-pathways of action
Bias:
• Systematic error.
• Consider always when you design your study
• Can not be evaluated / corrected at analytical stage, leading to incorrect/ spurious results
• Different types of bias
• Selection, information, misclassification
Confounding:
• Alternative explanations.
• Consider potential confounders, collect data for them
• Adjust our measures of effect by confounders
Interaction
• The effect of a risk factor varies according to the different categories of another factor.
• Analytical stage consider interaction
• If necessary report measures of effect separately