ENGRD 2700 - Prelim 1
 Call Kai
 Learn
 Practice Test
 Spaced Repetition
 Match
 Flashcards
 Knowt Play
1/232

There's no tags or description
Looks like no tags are added yet.
233 Terms
What is Probability & Statistics?
Its the study of models and data to help you understand a system better/ make decisions better.
Probability
Builds random models of phenomena
A phenomena is a random outcome if
its outcome can’t be predicted in advance:
flipping a coin
tomorrow’s stock price
the result of an upcoming election
Statistics
(1) organizing & summarizing data and (2) using the data to draw conclusions, e.g.
based on the outcomes of some tosses, is the coin fair?
based on the stock’s price in the past, will it go up tomorrow
based on survey data, who will win the election?
Population
a well-defined set of items you’re interested
Sample
a well-defined subset of a population (often use to study that population)
Observation
an individual measurement from a sample
What are some examples of population vs sample?
All students taking ENGRD 2700 (population), vs. all
sophomores taking ENGRD 2700 (sample)
All U.S. universities (population), vs. all Ivy League
universities (sample)
All voters in the U.S. (population), vs. all college-educated
voters (sample)
Simple random sample of size n
Each subset of size n of the population is equally likely to be chosen
Stratified random sample
Collect random samples from sub-populations of the population
e.g. sample 700 Cornell undergrads by sampling 100 undergrads from each college
Real-valued data
Numerical measurements that are expressed as real numbers (they can be both whole integers and fractions or decimals)
e.g. pollution concentration
Integer-valued data
Numerical measurements that are expressed as only integers
e.g. defect counts
Categorical data
Data that is defined as categories
e.g. makes of cars
What is Exploratory Data Analysis (EDA)
Summarize main characteristics of the data (via plots, summary statistics such as mean, median, variance).
What can EDA be used for?
To get a better (qualitative) understanding of the data, and to formulate questions about the data.
Formal Inference
Draw scientific inferences about the population from the data (formally test hypothesis)
Clinical trials
The hypothesis might come from EDA
How do you read stem & leaf plots?
stems from leading digits, and leaves from trailing digit
advantage: gives a sense of the distribution of the data values at a glance
disadvantage: only useful for small datasets
Why are scatter plots useful?
They are useful for understanding relationships between two variables
What is a warning for scatter plots?
Correlation does not imply causation!
Time Series Plots
Given data x1, . . . , xT for times 1,…,T, its time series plot is the plot of the points (1, x1),…,(T, xT)
Dotplots
Draw a number line and place a dot for each data point, stacking if they’re repeats. They are used sometimes for small data sets.
example: birth years of 160 individuals
Bar Charts
Bar Charts are used for qualitative data. Some examples are:
Clicker responses
Numbers of people who use R, Python, Haskell, Scala, Java
What Trump supporters like about him
Histograms
Histograms are used for quantitative data.
What is the procedure for drawing out histograms?
Find the smallest x1 and largest xn value that the data takes
Partition the interval [x1, xn] into disjoint intervals
For each interval Ij, find the # of data points nj that fall into Ij
For each interval Ij, compute the relative frequency (fj = nj/n where nj is the count of data values in a specific bin and n is the total # in dataset)
For each interval Ij, draw a rectangle centered at Ij ‘s midpoint whose area is proportional fj
What are the two properties of relative frequencies?
0 ≤ fj ≤ 1
f1 + f2 + … + fk-1 + fk = 1
Suppose the width of each bin is 1: If the height of each rectangle is relative frequency, wha't’s the total area of the histogram’s rectangles
1
Suppose the width of each bin is 1: If the height of each rectangle is frequency, what’s the total area of the histogram’s rectangles?
n = number of data points
What are measures of location?
Measures of location are measures that indicate where the data tends to be situated.
Sample Mean
The average of the observations, or the center of mass (physical interpretation).
What are the two caveats of sample mean?
it doesn’t say much about how the data is distributed
It’s sensitive to extreme values
Sample Median
A measure of location that’s less sensitive to extremes than the sample mean (its more robust)
about ½ of the observations are above the sample median, and 1/3 are below it
Sample Mode
The measure that is the most frequently occurring value(s) in a sample (might not be unique)
Negative / Left skew
There is more data on the right
Positive / Right Skew
There is more data on the left
What are measures of variability?
they are measures that inidicate how spread out the data is
Sample Range
Largest observation - smallest observation
Sample Range Caveats
Crude measure of spread (only uses extremes)
Often increases without bound as the sample size n grows - not that useful as a general measure of variability
Sample Variance (σ2)
Draw it out

Sample standard deviation (σ)
square root of standard variance
Scaling property of SV
if you scale the dataset by a number c, the variance is multiplied by c2
Scaling property of SD
if you scale the dataset by a number c, the standard deviation is multiplied by |c|
q-quantile
A q-quantile of the data x1,…,xn is the smallest number greater than or equal to 100q percent of the values in the data
Example: For the salary data {45, 51, 54, 57, 58, 58, 75}
The 0.5 quantile - the 50th percentile is 57
p-percentile
A p-percentile is the smallest # that’s greater than or equal to p percent of the values in the data (i.e. p-percentile = (p/100) - quantile)
Example: For the salary data {45, 51, 54, 57, 58, 58, 75}
The 0.5 quantile - the 50th percentile is 57
For the smallest value of x(i) of the data, let
qi = (i - 0.5) / no
The q-quantile is defined as follows:
If there’s an i where q = qi, then the q-quantile is x(i)
If q is between qi and qi+1 the q-quantile is ((x(i) + x(i+1) ) /2)
If q ≤ q1 the q-quantile is x(1)

Interquartile Range (IQR)
IQR = (0.75-quantile) - (0.25-quantile)
Much less sensitive to extreme values than the range and SV & SD
What is a probability?
It is a number between 0 and 1 that measurs how likely it is that something (an event) will occur
Event
a collection of outcomes you’re interested in, or subsets of the sample space
When all outcomes are equally likely, what is the probability that a given event occurs?
P (Event) = # of outcomes belonging to the event / # of possible outcomes
Example:
a fair coin, P(getting heads) = ½
a fair die, P(rolling 1) = 1/6

Multiplication Rule
If you have K types of things, and for type i = 1, 2 . . . ,K there’re Ni items, then there’re N1 × N2 · · · × Nk ways to select one item of each type
You’re packing for a trip, and have 5 different shirts. How many ways can you select shirts to pack? (You might pack none, or all 5 shirts.)
Number of ways = Number of subsets of shirts = 25
What’s the probability that a randomly-generated plate contains four repeating digits (e.g., RWX-3333)?
(263 × 10)/(263 × 104 )
If you draw a sample of size k with replacement from a set of n distinct items, how many ordered samples are possible?
nk
Ordered sampling without replacement
ordered sampling of k items without replacement from a set of n distinct items = a permutation (a re-ordering) of a list of k out of n possible items.
Pk, n = n! / (n-k)!
What matters for permutations?
Order
Combinations
the # of ways to select a set of k items from a set of n distinct items (th # of unordered samples without replacement) is:
Ck,n = n! / k!(n − k)! (n choose k)
What is the probability of getting a royal flush? (# of ways to get 10, J, Q, J, A of the same suit)
4 / (52 choose 5) = 0.0000015
what are two useful identities of combinations?
(n choose k) = (n choose n-k)
(n choose k) = (n-1 choose k-1) + (n-1 choose k)

Hypergeometric Probabilties
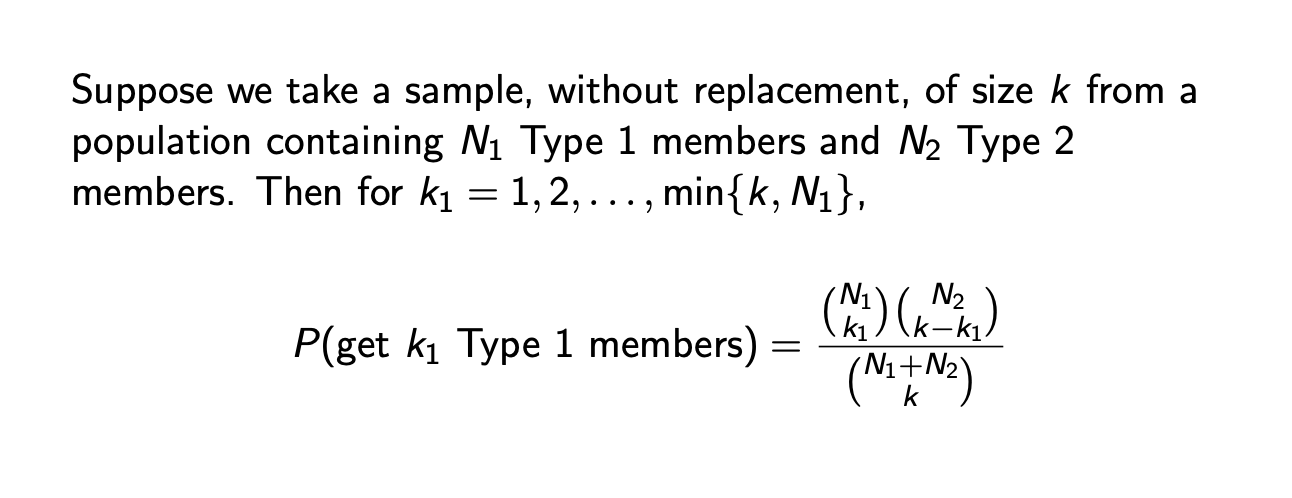
Suppose we take a sample, without replacement, of size k from a population containing N1 Type 1 members and N2 Type 2 members. Then for k1 = 1, 2, …, min {k, N1},
P(get k1 Type 1 members) = ((N1 choose k1) (N2 choose k-k1)) / (N1 + N2 choose k)
Hypergeometric distribution
Given N1, N2, and k, the probabilities that this assigns to the numbers k1 is called the hypergeometric distribution
With replacement, and order matters:
nk
Without replacement, and order matters:
Pk, n
Without replacement, and order doesn’t matter:
Ck,n = (n choose k)
What are the 3 elements that probability models are defined by?
sample space: contains all the possible outcomes
set of events: subsets of sample space
probability function P: assigns probabilities (numbers between 0 and 1) to events
Example: flipping a fair coin
sample space = {heads, tails}
events = {∅, {heads}, {tails}, S}
probability function P:
P(∅) = 0
P({heads}) = 0.5
P({tails}) = 0.5
P(S) = 1
A and B occur
A ∩ B = set of all outcomes that are in both A and B
A or B occurs
A ∪ B = set of all outcomes that are in A or B
A doesn’t occur
Ac = set of all outcomes that are not in A
set of all outcomes in A1 and A2 and…
draw it out

set of all outcomes in A1 or A2 or…
draw it out

De morgan’s law
For a sequence of A1, A2 … of events: draw in terms of set notation as well
— (A and B) = — A or — B
— (A or B) = — A and — B

Probability Function
a function P(-) which assigns a number betwen 0 and 1 to every event, that satisfies the axioms of probability.
What are the axioms of probability?
P(A) ≥ 0 for every event A.
If the events A1, A2, . . . are mutually exclusive then, all of the probabilities together are added up (draw this out)
P(S) = 1

what is always the probability of the empty set?
P(∅) = 0
For finitely many mutually exclusive events A1, . . . , An,
P(A1 ∪ · · · ∪ An) = P(A1) + · · · + P(An)
For any event A,
P(A) ≤ 1
P(Ac ) = 1 − P(A)
For any two events A and B
P(A) ≤ P(B) if A is a subset of B
What is the inclusion-exclusion formula?
P(A ∪ B) = P(A) + P(B) − P(A ∩ B)
what makes a sample space discrete?
when it is finite or countably infinite
In a discrete sample space, what are the two conditions the numbers p_s must satisfy to define a valid probability function?
p_s ≥ 0 for every outcome s
the sum of all ps over s in S equals 1 - total probability is 100%

Once each outcome has a probability ps, how is the probability of an event A defined?
P(A) = Σ ps summed over all outcomes s in A - add up the probabilities of the outcomes inside A for each event

When the sample space is the set of all real numbers, what density functions f(x). do we consider?
f (x) ≥ 0 for all x ∈ R,
∫ f(x) dx = 1 with bounds [−∞, ∞] (total area under the curve should be one)
How is P([a,b]) defined for a continuous RV with density f(x)?
P([a, b]) = ∫ f(x) dx with upper bound = b, lower bound = a
Conditional Probability
Let A and B be events, and suppose P(B) > 0. The conditional probability that A occurs, given that B occurs is P(A|B) = P(A ∩ B) / P(B)

Multiplication rule for conditional probabilities
P(A ∩ B) = P(A)*P(B|A) = P(B)*P(A|B)
Multiplication rule for conditional probabilities extended:
P(A ∩ B ∩ C) = P(A)*P(B|A)*P(C|A ∩ B)
The events A1,…, An form a partition of the sample space S if:
they’re mutually exclusive (i.e., Ai ∩ Aj = ∅ for all i, j);
All of the events combined make up the sample space (draw out the set notation)

Law of Total Probability
If B is an event, and A1, . . . , An is a partition of S, then P(B) = ∑n i=1 P(B ∩ Ai) = ∑n i=1 P(B|Ai)P(Ai).
Bayes’ Rule
Let A1, . . . , An be a partition of S, and let B be an event where P(B) > 0. If P(Aj) > 0 for all j, then:
P(Ai |B) = P(Ai ∩ B) / P(B) = P(B|Ai)P(Ai) / ∑ni=1 P(B|Aj)P(Aj)
Draw it out!

What is Bayes’ Rule useful for?
updating probabilities based on new information
Events A and B are independent if:
P(A ∩ B) = P(A) P(B)
What is P(A|B) equal to if A and B are independent and P(B) > 0?
P(A ∩ B) / P(B) = P(A)P(B) / P(B) = P(A)

What is P(A|B) equal to if A and B are independent and P(A) > 0?
P(B ∩ A) / P(A) = P(A)P(B) / P(A) = P(B)
If A and B are mutually exclusive, must they be independent?
No, say A ∩ B = ∅, P(A) > 0, P(B) > 0. Then P(B|A) = P(A ∩ B) / P(A) = 0
0 is not equal to P(B).
If A and B are independent, must they be mutually exclusive?
No, toss 2 fair coins, Ai = {ith coin is heads}. Then A1 and A2 are independent, but A1 ∩ A2 are not equal to ∅
The events A1,…An are independent if:
for every subset J of {1,…,n} they are independent too.

For A1, A2, A3 to be independent, we need:
P(A1 ∩ A2 ∩ A3) = P(A1)P(A2)P(A3)
P(A1 ∩ A2) = P(A1)P(A2)
P(A1 ∩ A3) = P(A1)P(A3)
P(A2 ∩ A3) = P(A2)P(A3)
Random Variable (Engineer)
A number whose value is unknown
Random Variable (Mathmetician)
A random variable is a function from the sample space S to R (real numbers)
How are random variables denoted?
upper-case letters (e.g., X)
How are particular values that random variables can take denoted?
lower-case letters (e.g., x)