Clinical Biochem - Spectrophotometry
 Call Kai
 Learn
 Practice Test
 Spaced Repetition
 Match
 Flashcards
 Knowt Play
1/45

There's no tags or description
Looks like no tags are added yet.
46 Terms
What is wavelength?
The linear distance between two consecutive peaks (or troughs) of a wave, commonly measured in nanometers (nm) for spectrophotometry
Crest to crest/trough to trough (nm)
What is amplitude?
The height of a wave measured from its baseline to its peak, which dictates the light's intensity or brightness
The distance between the center line of a wave and the top of a crest or the bottom of a trough
What is frequency?
The number of complete wave cycles that pass a fixed point per unit of time, expressed in Hertz (Hz) or cycles per second.
Cycles of waves per second, Hz
What is the relationship between energy and photons?
Energy (E) is directly proportional to frequency (E = hv). Light travels in discrete packets of energy called photons; higher-frequency photons carry greater energy.
What is the relationship between frequency and wavelength?
Inversely proportional (c =λν, where c is the speed of light). As wavelength increases, frequency decreases.
What is the relationship between energy and wavelength?
Inversely proportional (E = hc/λ). Shorter wavelengths (e.g., ultraviolet) carry higher energy than longer wavelengths (e.g., infrared).
Explain E = hv = hc/λ
E = energy
h = Plank constant
v = frequency
c = speed of light
λ = wavelength
Long wavelength = ?, short wavelength = ?
Long wavelength = low frequency, low energy
Short wavelength = high frequency, high energy
What is the ultraviolet (UV) spectrum?
180-390 nm (high-energy short waves requiring quartz or silica optics).

What is the visible spectrum?
390-780 nm (light visible to the human eye).
What is the infrared (IR) spectrum?
780-2000 nm (lower-energy long waves)
What is Beer’s Law?
The concentration of a substance is directly proportional to the amount of light energy absorbed by that substance.
A = abc
A = Absorbance (unitless)
a = absorptivity constant (L/mol • cm)
b = Light path length through the cuvette (cm) (constant)
c = Concentration of the absorbing substance (mol/L or M)

List the different light sources available for a spectrophotometer
Tungsten-Halogen (Incandescent): Standard light source for the visible and near-infrared regions (320-2,100 nm).
Deuterium / Hydrogen Discharge Lamps: Standard source providing continuous output in the ultraviolet region (160-375 nm).
Xenon Arc Lamp: Emits continuous radiation across both UV and visible regions (200-1,000), often used in high-performance or fast-scanning instruments.
Laser / Light-Emitting Diodes (LEDs): Provide narrow-band monochromatic light for dedicated wavelength measurements.
Describe the Tungsten-Halogen (Incandescent) light source
Standard light source for the visible and near-infrared regions (320-2,100 nm).
Describe the Deuterium / Hydrogen Discharge Lamps light source
Standard source providing continuous output in the ultraviolet region (160-375 nm).
Describe the Xenon Arc Lamp light source
Emits continuous radiation across both UV and visible regions (200-1,000), often used in high-performance or fast-scanning instruments.
Describe the Laser / Light-Emitting Diodes (LEDs) light source
Provide narrow-band monochromatic light for dedicated wavelength measurements.
List the different light sources available for a spectrophotometer (PPT version)
Tungsten (Halogen) Lamps: Visible spectrum
Good for solutions with significant color change/concentration
Hydrogen/Deuterium Lamps: UV spectrum
Deuterium are more stable, longer life
Mercury lamp
Calibrate the displayed wavelength values
Hollow cathode lamp – atomic absorption spectroscopy
Xenon lamp – high brightness
Light-emitting diodes (LEDs)– Point of Care Instruments
Lasers – monochromatic, no wavelength selector needed.
Describe the components of a spectrophotometer: light source,
monochromator, photodetector.
Light Source: Supplies polychromatic light energy across the desired spectral region.
Monochromator: Isolates a specific narrow band of wavelengths from the polychromatic source using entrance slits, dispersion elements (prisms or diffraction gratings), exit slits, and optical mirrors.
Narrower bandpass than filters
Prism: rotates to determine wavelength
Diffraction grating: most common, BP~5nm
Photodetector: Converts light energy transmitted through the sample into a proportional electrical signal.
What is bandpass and its impact on spectrophotometer quality?
The range of selected wavelengths that passes through the exit slit of a wavelength selector/the range of wavelengths transmitted through the exit slit at half the maximum peak height (Full Width at Half Maximum, FWHM).
Effective BP is ½ of peak %T
Impact on Quality: A smaller (narrower) bandpass improves spectral resolution, light purity, and adherence to Beer's Law. High-quality clinical analyzers typically maintain a bandpass of ≤ 2 nm
What are the four quality checks performed on a spectrophotometer?
Wavelength accuracy
Stray light
Linearity
Accuracy
Describe quality control checks: wavelength accuracy
Verifies that the wavelength displayed on the instrument dial matches the true wavelength emitted. Measured using holmium oxide/didymium filters or narrow-emission lamps (e.g., mercury vapor).
Test the integrity of a wavelength selector
Method 1: use a light source with strong emission lines at well defined wavelengths.
Ex: Mercury vapor lamp: strong emission at constant, well-reproducible wavelengths 313, 365, 405, 436nm
Method 2: Rare earth glass filters to block certain wavelengths
Ex: Holmium oxide: strong absorption lines at 241, 279, 287, 333nm etc
Describe quality control checks: stray light
Detects light hitting the detector outside the designated bandpass (caused by dust, scratches, or internal reflections). Measured using sharp cutoff liquid filters (e.g., sodium iodide, sodium nitrite) that should block 100% of light at specific wavelengths.
The light that has no selected wavelengths
Cause negative deviations from Beer’s law
Checked by a filter that has 0%T.
Requirement: stray light %T < 1%
Corrections:
Changing the light source
Verifying wavelength calibration
Sealing light leaks
Realigning instrument components
Cleaning optical surfaces

Describe quality control checks: linearity
Verifies that absorbance readings remain directly proportional to analyte concentration over a defined analytical measurement range (AMR). Measured using serial dilutions of a known absorbing dye or standard solution (e.g., potassium dichromate).
Deviations from the linearity
High concentrations
Incident light energy is not monochromatic
Defective detector
Stray light (most common reason?)
Wide exit slit
The sides of the sample container are not parallel
Two or more analytes are absorbing the incident light
The solvent absorption is significant compared with the solute
absorbance -- Blank sample
Describe quality control checks: photometric accuracy
Ensures correct absorbance readings against recognized physical standards. Evaluated using certified neutral-density glass filters or standard solutions with precisely known absorptivities.
Test how accurately a spectrophotometer measures the
absorbanceThe National Institute of Standards and Technology
(NIST) provides standards:Standard glass filters
Standard solutions
Linearity of measurements

What is the principle of atomic absorption spectrophotometer (AAS)?
Ground-state free atoms absorb resonance light energy at specific element-characteristic wavelengths emitted by a hollow cathode lamp. The degree of absorption is proportional to element concentration.
Describe the features of atomic absorption (AAS)
Atoms (and ions) can absorb light at a specific
wavelength.Follow Beers’ law.
Amount of light absorbed = concentration of analyte (atoms)
Advantage
~10 times more sensitive than traditional spectrometer
Very specific
Disadvantage
Not fully automated
Many interferences
Instrumentation
Light source: Hollow cathode lamp
Light in the ultraviolet-visible range
Atomizer/nebulizer
Flame or carbon support tube
Sample: solid or liquid
Vaporized into atoms
Monochromator and detector

What is the principle of atomic emission (AES/Flame Photometry)?
Thermal energy excites ground-state atoms to a higher energy level. As excited electrons decay back to ground state, they emit light at characteristic wavelengths proportional to concentration.
List and describe each component in an atomic absorption
spectrophotometer.
Hollow Cathode Lamp (HCL): Element-specific light source coated with the metal of interest, emitting precise spectral lines for that element.
Atomizer (Flame or Electrothermal/Graphite Furnace): Converts liquid sample ions into ground-state gas-phase free atoms.
Monochromator: Isolates the specific resonance line emitted by the HCL from background burner emissions.
Photomultiplier Tube (PMT) Detector: Measures remaining resonance light energy after absorption by the atomic vapor cloud.
Readout / Signal Processing: Uses a mechanical chopper or pulsed current source to distinguish HCL light from continuous flame emission.
List and describe each component in an atomic absorption
spectrophotometer (PPT version)
Light source
Wavelength selector (filter or monochromator)
Sample cell (cuvette)
Detector and readout device
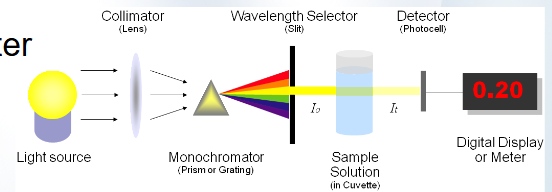
Describe the different types of wavelength selectors (PPT version)
Filters
Based on selective transmission characteristics
Inexpensive
Transmit one wavelength, absorbs or reflect the rest
Monochromator: narrower bandpass than filters
Prism
rotates to determine wavelength
Diffraction Grating
most common
BP~5nm

Describe sample cell (cuvette)
Holds sample of interest
Many different shapes
Many different materials
Glass – visible
Quartz – visible, UV
Plastic – visible, most commonly used
Describe the detector (PPT version)
Convert transmitted radiant energy into equivalent electrical energy
Photomultiplier tubes (PMT)
An electron tube that can amplify a current
Photocathods
Dynodes
Most sensitive to low levels of light
Only scan though one wavelength at a time.
Photodiodes
Photomultiplier tube (PMT)
Photodiodes
Semiconductors that change their charged voltage
(usually 5 V) upon being struck by lightPhotodiode array
Each diode responds to a specific wavelength
Produce a spectral absorbance curve simultaneously

Describe the read-out device
Converts electrical signal into readable format
Can be directly related to the concentration of the sample
Describe the different types of wavelength selectors (detailed version)
Glass/Gelatin Filters: Wide bandpass (~ 30-50 nm); low cost, static wavelength selection
Interference Filters: Constructive/destructive optical wave interference (~ 5-15 nm bandpass).
Prisms: Refracts light based on wavelength (non-linear dispersion).
Diffraction Gratings: Parallel grooves reflect/diffract light linearly; most widely used in modern clinical analyzers.
Describe the different types of detectors (detailed version)
Photocell (Barrier-Layer): Generates electron flow via light striking a semiconductor; simple, no external power needed.
Phototube: Emits electrons from a photoemissive cathode to an anode in a vacuum tube.
Photomultiplier Tube (PMT): Cascades photoelectrons through dynodes; extremely sensitive for low light levels.
Photodiode Array (PDA): Multi-channel semiconductor array; allows simultaneous, instantaneous full-spectrum measurement.
Describe Single-Beam vs. Double-Beam Spectrophotometers
Single-Beam: Contains one light path. The blank and sample are measured sequentially in the same optical path. Sensitive to light source intensity fluctuations and instrument drift.
Double-Beam in Space: Uses a beam splitter to pass light through both a reference (blank) cuvette and sample cuvette simultaneously onto two dedicated photodetectors.
Double-Beam in Time: Uses a rotating chopper mirror to direct light alternately through the reference cuvette and sample cuvette sequentially onto a single photodetector. Corrects for light source fluctuations and instrument drift automatically.

How do you calculate bandpass
Calculated from the spectral response profile (transmittance vs. wavelength curve) produced when scanning a monochromatic line
Bandpass = λupper - λlower
λupper and λlower are the wavelengths corresponding to 50% of maximum peak transmittance (FWHM).

Describe molecular absorption (UV/Vis) vs atomic absorption
Analyte State: Molecules in solution
Light Source: Continuous polychromatic (Tungsten, Deuterium)
Sample Prep: Liquid chemical reaction with chromogens
Spectrum Type: Broad molecular absorption bands
Primary Clinical Use: Routine chemistry panels (glucose, enzymes, urea)
Describe atomic absorption (AAS) vs molecular absorption
Analyte State: Free ground-state gas atoms
Light Source: Element-specific line source (Hollow Cathode Lamp)
Sample Prep: Atomization (breakdown of matrix by heat/flame)
Spectrum Type: Extremely narrow atomic resonance line spectrum
Primary Clinical Use: Trace metals and minerals (lead, zinc, copper)
What are the limitations of absorption spectrophotometry?
High Concentration Non-linearity: At high concentrations, average inter-molecular distances decrease, affecting charge distributions and altering absorptivity (a).
Chemical Deviations: Changes in pH, dissociation, complexation, or solvent interactions alter the absorbing chemical species.
Instrumental Deviations: Polychromatic radiation (wide bandpass), stray light, or mechanical misalignments cause non-linear standard curves.
Particulate Interferences: Turbidity, lipemia, hemolysis, or icy/dirty cuvette surfaces scatter light, erroneously inflating absorbance readings.
What are the clinical applications of absorption spectrophotometry?
Substrate Quantitation: Enzymatic or endpoint reactions measuring analyte concentrations (e.g., Glucose, Cholesterol, Creatinine, Bilirubin, Total Protein).
Enzyme Activity Measurement: Kinetic tracking of NADH/NAD+ conversion at 340 nm (e.g., AST, ALT, LDH, CK).
Therapeutic Drug Monitoring & Toxicology: Spectrophotometric identification and quantitation of toxic agents or therapeutic compounds.
How do you calculate absorbance values given % transmittance values?
2 - lg(%T)
Inverse relationship between absorbance and transmittance

How do you calculate transmittance?
T = I/I0
%T = I/I0 × 100%
I0: incident light energy
I: transmitted light energy

How do you calculate the concentration of an analyte in a specimen using Beer’s Law?
As/Cs = Au/Cu
As: absorbance of standard sample
Au: absorbance of unknown sample
Cs: concentration of standard sample
Cu: unknown concentration of testing sample
As or Au = A - Ablank or A - Areference
How do you evaluate a filter schematic for efficiency?
[Light Source] ➔ [Entrance Slit] ➔ [Dispersive Element/Filter] ➔ [Exit Slit] ➔ [Cuvette/Sample] ➔ [Detector] ➔ [Readout]
Spectral Matching: Light source spectral output aligns with target wavelength (e.g., Deuterium for UV < 350 nm, Tungsten for Visible > 350 nm).
Order of Optics: Wavelength selection must occur before the photodetector to avoid saturating the detector with stray polychromatic light.
Bandpass Compatibility: Exit slit width must be sufficiently narrow to match the natural absorption bandwidth of the target analyte (minimizing deviation from Beer's Law).
Cuvette Material Alignment: Cuvette composition must pass light at target wavelengths (glass or plastic for visible spectrum; quartz/silica for UV spectrum).