Biostats
 Call Kai
 Learn
 Practice Test
 Spaced Repetition
 Match
 Flashcards
 Knowt Play
1/11

There's no tags or description
Looks like no tags are added yet.
12 Terms
Important Abbreviations
ARR: absolute risk reduction
EER: experimental event rate
CER: control event rate
HR: hazard ratio
NNH: number needed to harm
NNT: number needed to treat
OR: odds ratio
RR: relative risk (sometimes risk ratio)
RRR: relative risk reduction
Risk in EBP
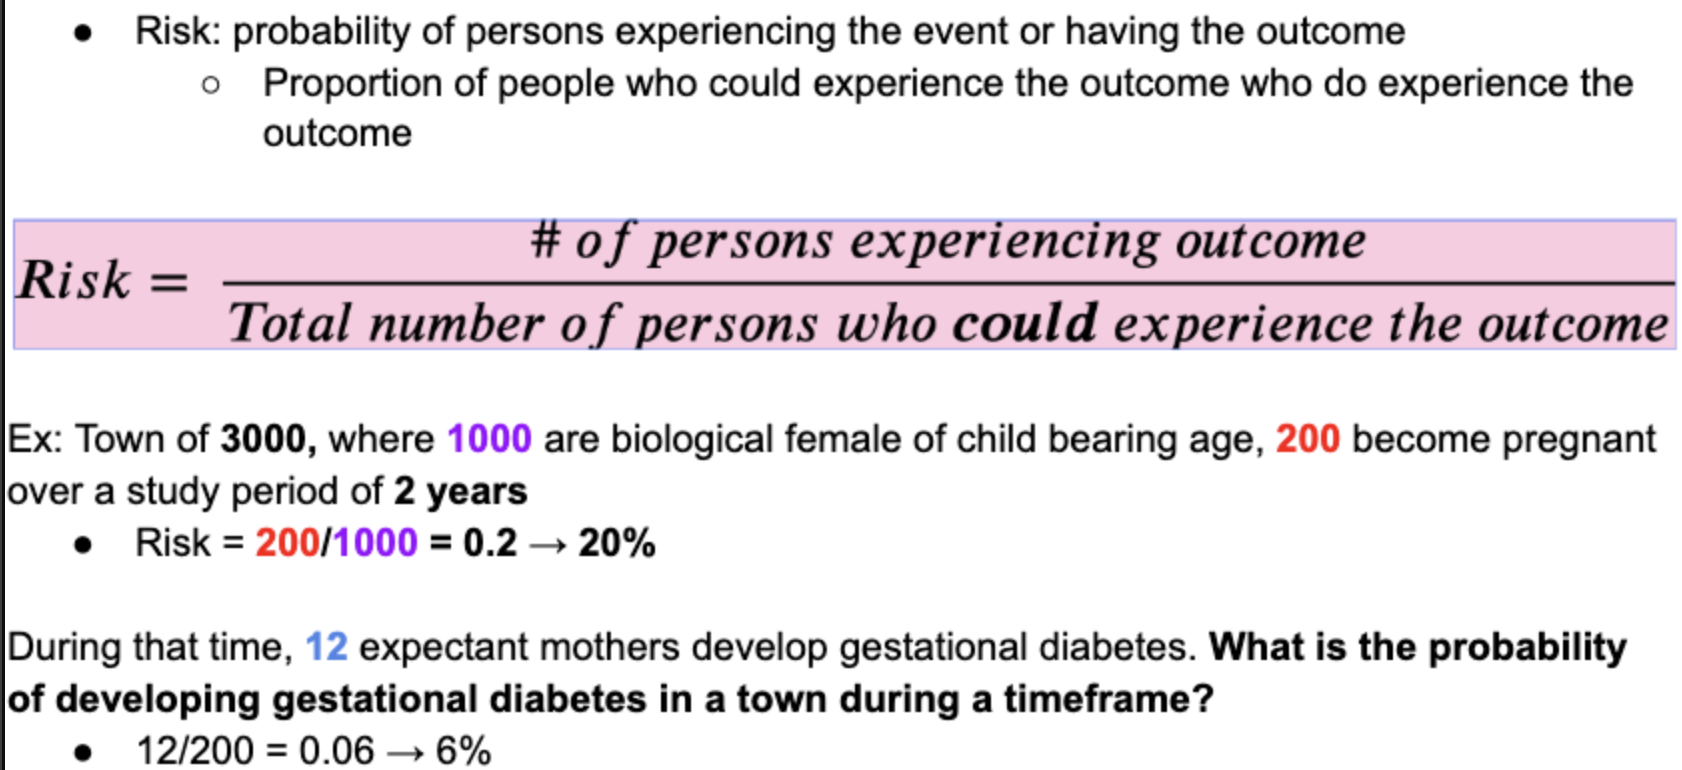
Calculating risk in study groups
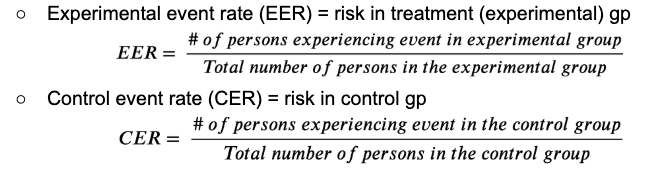
Risk of event happening can occur in both experimental and control/comparator gp
Two rates to compare risk with each gp
Probability (risk) vs Odds)
Probability: number of events of interest in relation to the total number of possible events
Odds: number of events of interest that did happen in relation to the number of events that didn't happen
Events happening /events not happening
When to use Risk vs Odds
Retrospective studies (case control)
Use odds because the total number of possible at risk individuals is unknown
Ex: liver cancer study looks back to assess drinking habits
Prospective studies (Cohort)
Use of risk or odds because the exposed population is known


Absolute Risk Reduction (ARR)
Definition: actual decrease in risk between control and experimental groups, which account for the likelihood of the event happening in the general population, not just the study group
ARR = | Control Event Rate (CER) – Experimental Event Rate (EER) |
EX: If 7% of treatment groups developed DVT vs 36% in the control:
ARR = 35% - 7%= 29%
ARR used to put results into realistic perspective
Relative risk (RR)
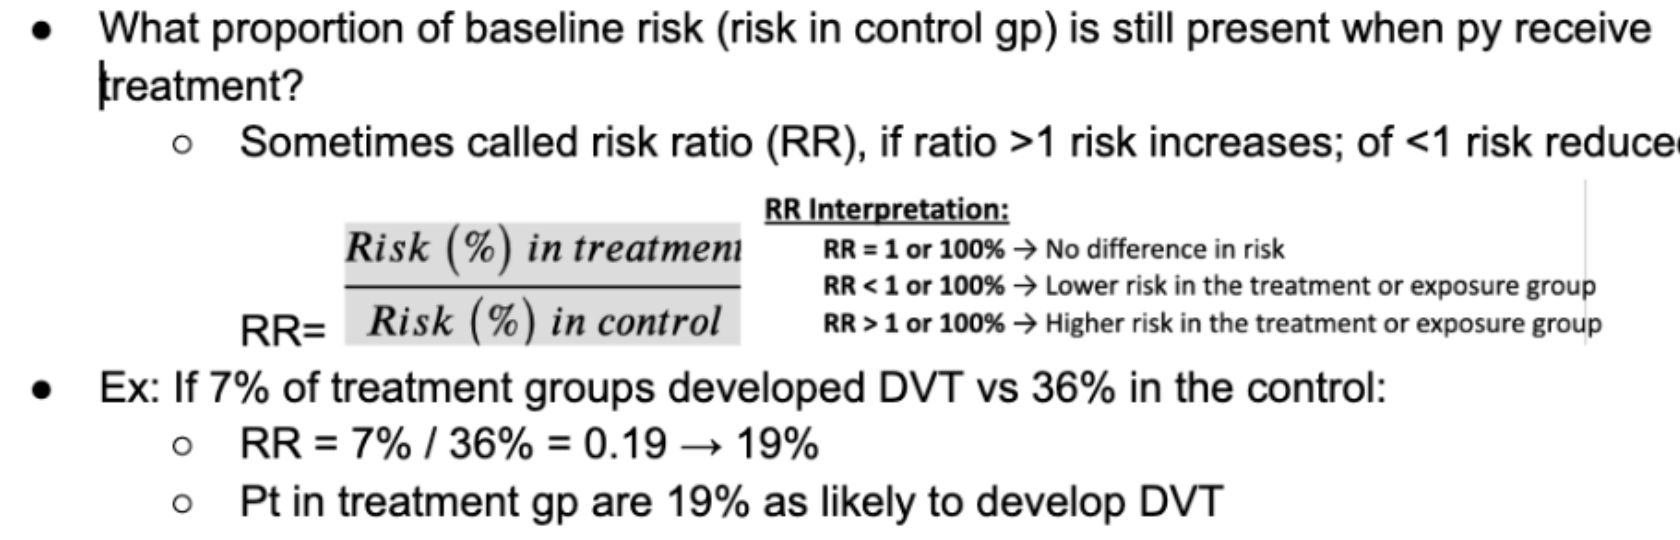
Relative Risk Reduction (RR)
What proportion of baseline risk (risk in control gp) is removed by the treatment? → how much risk changes proportionally btwn 2 gps

Caution: RRR can be used to overstate the "perceived effects” of the treatment effect (ARR) and only applies to the study population
Ex: if baseline risk is 0.02 and treatment reduces risk to 0.01, RRR is 50% but the treatment only reduced risk by 0.01
Ex: If 7% of treatment groups developed DVT vs 36% in the control:
If ARR = 35% -7% = 29%, then RRR = 29% / 36% = 80.5% or 81%
Treatment reduced risk of DVT by 81% compared to control
Odds Ratio (OR)
Similar to relative risk, but uses odds of outcome instead of risk of outcome
Odds/odds ratios can estimate risk/risk ratio (but are not equal)
Used when risk cannot be calculated (case-control studies)
Also, OR is the output from certain statistical tests (e.g. logistic regression)

Caution: OR can overestimate the effect of treatment compared to risk ratio because denominator is smaller with odds than for risk - prefer RR over OR
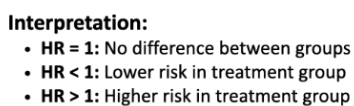
Hazard Ratio (HR)
Definition: compares the rate of negative events between 2 groups over time
Similar OR and RR in that an HR = 1 means no diff in event rates
Ratio is an effect size measure for time-to-event date. USe hazard ratios to estimate treatment effect in clinical trials when you want to assess time-to-events
Ex: Cancer treatment survival study, rate of death over 1 week in treatment group is 3% or 0.03 and control is 4% or 0.04
HR = 0.03 / 0.04 = 0.75 → Meaning treatment reduces death risk by 25%


NNT and NNH
Number needed to Treat (NTT): Efficacy
Number Needed to Treat (NNT) is the number of patients you need to treat to prevent one additional bad outcome (death, stroke, etc.).
For example, if a drug has an NNT of 5, it means you have to treat 5 people with the drug to prevent one additional bad outcome.
To calculate the NNT, you need to know the Absolute Risk Reduction (ARR); the NNT is the inverse of the ARR:
NNT = 1/ARR
NNTs are always rounded up to the nearest whole number (be conservative)
Number needed to harm (NNH)
average number of people who would need to be exposed to the risk factor (treatment) in order for the outcome (harm) to occur in an average of one person, who would not have otherwise experienced the outcome.
NNH= 1/ARR
NNHs are always rounded down to the nearest whole number (be conservative)
Higher NNH means the treatment is more safe
IMPORTANT: Like ARR, you should calculate NNT/H for all studies
2x2 contingency table
Where
a is the number of patients with the exposure who did experience the outcome
b is the number of patients with the exposure who did not experience the outcome
c is the number of patients without the exposure who did experience the outcome
d is the number of patients without the exposure who did not experience the outcome
