Ecology and Evolution Midterm 3
 Call Kai
 Learn
 Practice Test
 Spaced Repetition
 Match
 Flashcards
 Knowt Play
1/114

There's no tags or description
Looks like no tags are added yet.
115 Terms
Ecology
The study of the relationships between organisms and their eviroment
selective pressures on organisms
Ernst Haeckel
the investigation of the total relations of the animal both to its inorganic and to its organic enviorment
Suitable habitat
a variety of enviromental factors must be in the range of tolerance for individauls to live there
Geographical range
the measure of the total area covered by a population
what is a niche? what does it’s graph loo like?
is a n-dimensional hypervolume measumrent of the range of conditions that an organism can tolerate in which an organism can persist indefinitely.
the range of antibiotic and biotic conditions that an organisms can tolerate

what is n-dimensional hypervolume
total range of environmental conditions and resources in which a species can survive, grow, and reproduce.
habitat
the place, or physical setting, in which an organism lives
what determines the distrobution and abundacne of a species
Biotic and abiotic factors limit distrobution and abundance
Why are some species endemic and other speces are cosmopolitan?
Dispersal limitation: the absense of a populartion from a suitable habitat because of the barriers to dispersal
Endemic species
speciess that live in a single often isolated, location
Cosmipolitan
species iwth very large geographical ranges that can span several continents
How does human activity affect population distrobutions?
spead of invasice species
climate change
habitat fragmentation: breaking up arger habitats into a number of small habitats
Metapopulation
population of populations connected by migration
habitat Corridor
a strip of favorable habitat located between two larger patches of habitat that fasciliates dispersal
How do scientists study ecology
Manipulative experiments: tested by altering a factor hypothesized to cause a phenomenon
Natural Enviroment: testing that relies on natural variation in the enviroment
Mathematical model: a system with a set of equations that correspond to hypothesized relationships amon the systems components
Ecological systems
indivdiaul
population
community
ecosystems
landscapes
biosphere
Indivdidual
A living being
an indivduals morphology, physicologym and behvaior enable it to survive in its enviroment
Population
individuals of same species living in a particular area
variation over time and space in the number, the desnity, and the composition of individuals
Community
all populations of psecies living togther in a particualr area
the divserity and relative abundance of different kinds of ogranisms living togther in the same place
Ecosystem
one or more communities of living organisms interacting with their nonliving physical and chemical enviroments
the storage and transfer of energy and matter inclduing the various chemical elements essential to life
Landscapes
multiple ecosystems thata re connected by the movement of individuals, populations, matter, energy
the movement of energy, matterm and individuals between different ecosystems
Biosphere
all ecosystems earth
the movements of air and water and the energy and chemical elements
Weather
Population size and population growth rate
number of individuals = N
the change in size over time = dN/dt
Exponential population growth
population can grow rapidly under ideal conditions
dN/dt = rN
r= (b-d) = per capita population growth rate
dN/dt: change in N over time
Exponential growth model how can we make it better?
essential resources are unlimited (space, food…)
the enviroment constant
As density of population increases
decrease in fecundity
increase in mortality
logistical model of populatopn growth
dN/dt= (rN(K-N))/K or dN/dt= rN(1-N/K)
K= carrying capacity
when N is low compared to K, population growth is exponential
when N apporaches K, the term (1-N/K) approaches 0, slowing pop growth
carrying capacity
the maximum population size that can be supported by the enviroment
Density independent
factors limiting population size regardless of the population’s density
Weather
specific short term atmospheric conditions of tempature, precipitation, sunlight, and wind over periods of hours and days
Climate
the typical atomspheric conditions that occur throughout the year, measured over many years
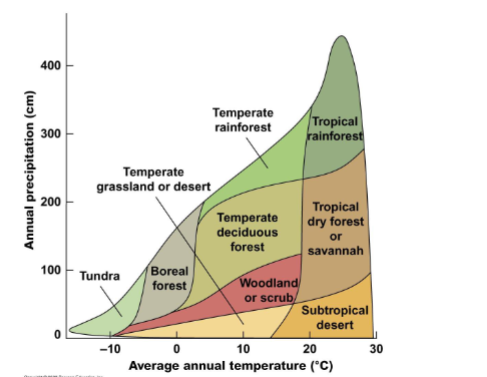
How does productivity relate to biomes?
Productivity of world biomes depends on climate
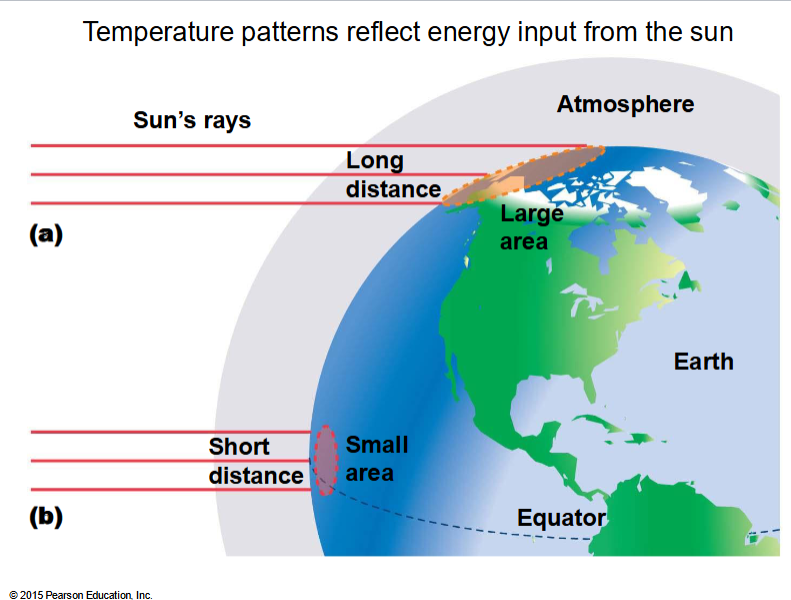
tempature patterns refelct energy inpur from the sun
Overal rules of circulation patters
hot air rises
cold air holds less water
earth turns west to east
the circulation of air in hadley cells
1, the sun heats the most tropical air causing it to rise
the air rising cools, causes water vapor, then rain
the cool dry air goes back to earth
the cool air warms and dries and flows towards the equator

label the ferrel and hadley cells and how they circulate
What happens when solor radiation falls directly on tropic of cancer or tropic of capricorn?
increases the input and day length in
tropic of cancer - northern hemisphere
tropic of capricorn - sourther hemisphere
InterTropical convergence zone
where two hadley cells converge and cause large amounts of precipitation
shifts cause seasonality preciciptation: rainy seasons and dry seasons
How does ITCZ shift seasonally
due to uneven heating (tilt/rotation)
leads to seasonality of precipitation in many places (wet and dry season)
two rainy seasons near equato
Tundra and boral forests
plant productivity is energy limited (light and tempature)
Tundra: show saturated herbaceous plants, shrubs
Boreal: evergreen and deciduous forest, regularely burns
tropical rainforest and savanna
rainforests: highly productive, very high biodiveristy
savanna: seasonally dry
Coriolis effect
the defelction of an objects path due to the rotation of the earth
Ocean circulation
driven by atomspheric cireculation and the coriolis effect causing ocean currents to be clockwise in north and counterclockwise in south
ocean currents in part, are due to surface winds
gyre: large scale water circulation pattern between continents
Thermophaline ciculation
a global pattern of surface- and deep- water currents that flow as a result of variations in temperature and salinity that change the density of water
What are the effects of climate change on the water cycle?
rising temps change when, where, and how much precipitationa nd evaporation
some areas have increase soil moisture in the frtue, but others will have drier soil - dryers with reduce primary production and increase risk of rife
precicpation is more variable
Causes of global warming
The balance between incoming (sun) and outgoing energy (greenhouse gases)
Input: no change in solar energy reachoing earth
solar activity
earth- sun geometry
land- use ( how much light is reflected)
Output: less thermal radtion emitted by earth to space
greenhouse gasses
volcanic acitivity
green house gasses
water vapor
methane
nitrous oxide
carbon dioxide
H2O - water vapor
natural - part of hydrologic cycle, including plant transpiration
• capped! – cannot increase beyond saturation (rain
CO2
natural – produced by respiration, fire, consumed by photosynthesis
• anthropogenic – created by burning fossil fuels
Evidence: air bubbles trapped in ice cores can be used to determine CO2 levels as well as tempature back thousands of years
CH4
natural - produced and consumed by microbes
• anthropogenic - natural gas extraction, agricultural wetland crops (such as rice)
N2O
natural - part of the microbial nitrogen cycle
• anthropogenic – N cycle greatly changed by human agriculture (fertilizer use), also industrial uses
CFCs - chlorofluorocarbons, halocarbons
anthropogenic - used for refrigerants, industrial uses
fluxnet
worldwide network of meterological towers measuring fluxes of CO2 and other gases
The global carbon cycle
burned fossil fuels moves carbon from inactive geological reservoir to forms of petroleum or coal active resevoir in atmosphere
burn gasoline releasing C atoms that have been inactive for hundreds of millions of years
intensive agrictuture and deforestation adds large amounts of CO2 in atmosphere
Climate Finger printing
satelite tempature data show the atmosphere tempature fingprint predicted
Costs and befifics of regulation
cost- energetically expensive
benefit: maintain a constant and optimal internal enviroment
optimized internal functions
increased activity and growth rate
extended range of enviromental conditions
Conformers benefits
less energectically costly
requires less food
wider thermal tolerance niche
Phenotypic plasticity
the ability of a single genotype to produce multiple phenotypes in different enviorments
How do organisms respond to a variable environment?
regulate
depends on scale of environmental variability over time and space relative to the organism’s or tissue’s lifetime
Types of repsonses to enviromental variation
Homeostasis
acclimation
developmental plasticity
resistance or avoicande of adverse enviorments
Homeostasis
Quick, short term reversable responses
maintnance of nearly ocnstant internal enviroment in the midst of a varying external enviroment
behavorial: shade, sunlight
physiological: sweating, shivering
microhabitat
microhabitat
a specific location within a habitat that typically differs in enviromental conditiosn from other parts of the habitat
Acclimation
long-term reversible repsonses
reversible phenotpyic change in an individual organism in repsonse to chnaging evriomental conditions
Seasonal changes
Developmental Plasticity
slow and irreversible
differences in a phenotypic traits for a given genotype under different enviromental conditions
Resistacne of avoidance of adverse enviroments
can be relativelu quick or slow, reversable or perminant
migration - seaosnal movement from one region to another
dormacy- organisms dramatically reduce metabolic processes storage
Torpor
a breif period of dormacy that cocurs in birds and mammals in which individauls reduce their activity and their body tempature
Behavior
action or repsonse to a stimulis
Behavioral ecology
behavorial adaptations that evolved in response to ecological selection pressures
Proximate
Cause: mechanisms - how does it work?
Development: Ontogeny: how does it develop
Ultimate
cause: adaptive significance: what is its function
development: phylogeny of trait: what is its evolutionary history
Optimality modeling
predicts that an animal should behave in a way that maximizes the difference between the benifit of a behavior and its cost
What are all organisms constrained by?
time
energy
risk of injury
Cost- benefit analysis
determines whether the cost of an activity is less than teh benefit that can be expected from the activity
Assumptions of optimality models
animals are well adapted to their enviorment
they have some advantage to them to behave inc ertain ways
natual selection has molded animals to their enviroment
Living in groups costs and benifits
benefits
increased foraging efficiency
reduced predation
increased access to mates
help from kin
costs:
competition for food
increased risk of disease or parasites
attraction of predators
loss of paternity
brood parasitism
loss of individaul repoduction
increase competition
Dilution effect
the reduced or diluted probability of predation to a single animal when it is in a group
Overshoot
When a population grows beyond carrying capacity
Die-offs
a susbatntial decline in density that typically goes well below the carrying capacity
Interactions among species
consumption: +/-
competition: -/-
mutualism: +/+
commensalism: +/0
Mensalism: -/0
Neutralism: 0/0
Predation
+/-
heterotopic organusms whcih consume tissue as a soruce of energy and carbon
feed on living organisms
Intraspecific competition
comeptition among individuals of the same species
Interspecific competition
competition among individauls of different species
Renewable and nonrenewable resources
renewable: resources that are cinstantly regernated
nonrenewable resources: resources that are not regernated
Exploitative competition
competition is the result of indirect
interactions, individuals use
resources, reducing the amount
available for other individuals
Interfernece competition
competition is the result of
direct interactions, individuals
use resources, and prevent
other individuals from accessing
those resource
Competition model
species 1: dN(1)/dt=r(1)N(1)(1 - N()1/K(1))
Add species 2: dN(1)/dt=r(1)N(1) (1 - (N(1)+alphaN(2))/K(1))
species 1 is not reaching carrying capacity if species 2 is present
alpha: competition coefficent

Competition coefficents
variables that convert between the number of individauls of one species and the number of indivdiauls of the other species
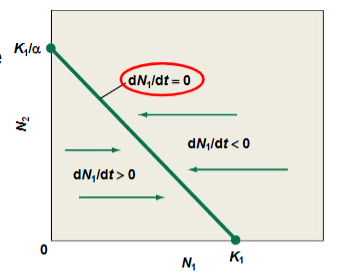
Compeition zero-groth rate species 1
set equation = to 0
K(1)=N(1)+alphaN(2)
set N(2)=0, solve N(1)
set N(1)=0, solve (N2),
solve for carrying capacity
on the lines species 1 population is not growing
below line species one can grow
above line specis one will decline
Comeptition growth rate Species 2
chnages alphaN2 to betaN1
K2=N(2)+betaN(1)
K(2)=N(2)
N1=K(2)/beta
on line species 2 is not growing
below line species 2 can grow
above line species 2 will decline


a. species 1 wins
b. species 2 wins
c. coexistence
d. could go either way
Questions concerning the role of predation in ecology and evolution?
Do predators limit prey populations below their carrying capacity?
To what extent do predators stabalize or cause fluctuations in teh prey population size?
Do predators over-eat their prey?
Do rpedators influence the evolution of prey characteristcs and vice versa?
Lotka and Volterra prey? what does it’s stabe graph look like?
prey: dN/dt = rN-cNP
c: predators ability to capture prey
rN: preys births
cNP: the decrease in prey population due to predators (#eaten)

Lokta and Volterra model predator
dP/dt= a(cNP)-mP
a(cNP): predator births
mP: predator deaths
a: efficiency of catching and converting prey in predators

What is Lotka-Volterra equations when prey and predator populations are stable?
Set dN/dt and Dp/dt = 0
solve an get
prey: P=r/c
predator: N=m/ac
Zero growth isocline
the population size of one species that acauses the population of another species to be stable
descibe the predator prey graph and each quadrant?
24
31
2: both prey and predator are decreasing
1: both predator and prey and increasing
4: predator pop. is increasing and prey pop. is decreasing
predator population is decreasing, prey population is increasing

Objections to lokta-volttera model
no tendency for populations to return to a stable equilibrium: extinction of populations more likely
there are no density-dependent restrictions to population growth
Rozenweigh and MacArthur graphs
Adds density dependence
at high prey densities, prey populations ahve limited resources, reaches carrying capacity (K), no predators necessary
at low prey densities, prey isocline will bend down because due to low prey productivity

Efficient predator
iscoline moves left
icreasing oscillations until extinction of predator and/or prey
Unstable
Inefficient preadtor
isocline moves right
decreasing oscillations converging on stable equilibrium
stable equilibirum