Chapter 8 stats
 Call Kai
 Learn
 Practice Test
 Spaced Repetition
 Match
 Flashcards
 Knowt Play
1/95

There's no tags or description
Looks like no tags are added yet.
96 Terms
What is the ANOVA method used for?
To determine to reject the null hypothesis, or not.
To determine the relationship between three (or more) variables.
To find out if three (or more) population variances are equal.
To find out if three (or more) population means are equal.
To find out if three (or more) population means are equal.
In the ANOVA table, how many hypothesis tests are there / what approach is used to make conclusion(s)?
One hypothesis test / The p-value approach.
A hypothesis test for each population / The p-value approach.
One hypothesis test / The critical value approach.
No hypothesis test(s) / No approach is used.
One hypothesis test / The p-value approach.
In the ANOVA table, what is the null hypothesis / the alternative hypothesis?
Populations means are equal / Population means are not equal.
Populations means are zero / Population means are not zero.
Populations variances are equal / Population variances are not equal.
Populations means are not equal / Population means are equal.
Populations means are equal / Population means are not equal.
In the ANOVA method, what is the main reason why several independent two-sample t-tests are not used to answer the question about the population means?
Because independent two-sample t-tests cannot answer this question.
Because of a loss of control over the Type-I error rate (α).
Because the F-test was invented before the t-test.
Because this approach involves a lot more work.
Because of a loss of control over the Type-I error rate (α).
Why does the ANOVA table take the approach to analyze variances to get information about population means?
Equal variances imply equal population means.
This approach requires only one hypothesis test, thus controlling α.
Standardized variances are easier to use in a t-test.
This approach is simpler requiring only the variances and n
(
s
2
/
n
)
, and not the averages.
This approach requires only one hypothesis test, thus controlling α.
The ANOVA Fraction is the basis of the ANOVA table. What is the basis for the ANOVA Fraction?
The sampling distribution of the sample average.
The relationship between the sample variance and the population variance.
The sampling distribution of the sample variance.
The relationship between the standard deviation and the variance.
The sampling distribution of the sample average.
In the ANOVA table, how is the Theoretical Variance calculated?
Using an F-transformation to convert the sample variance (s2) into the Theoretical Variance (s2p/n).
Pooling the sample variances and dividing by the count (s2p/n).
Calculating the sample variance of the three (or more) sample averages (s2¯x).
Calculating the sum-of-squares and dividing by the degrees of freedom
(sos p/n−1).
Pooling the sample variances and dividing by the count (s2p/n).
In the ANOVA table, how is the Actual Variance calculated?
Pooling the sample variances and dividing by the count (s2p/n).
Calculating the sum-of-squares and dividing by the degrees of freedom
(sosp/n−1).
Calculating the sample variance of the three (or more) sample averages (s2¯x).
Using an F-transformation to convert the sample variance (s2) into the Theoretical Variance (s2p/n).
Calculating the sample variance of the three (or more) sample averages (𝑠2𝑥¯)
In the ANOVA table, what is the result when the values of all three (or more) population means are not equal?
The Actual Variance has the same mathematical sign as the Theoretical Variance.
The Actual Variance is larger than the Theoretical Variance.
The Actual Variance is exactly equal to the Theoretical variance.
The Actual Variance is close in size to the Theoretical Variance.
The Actual Variance is larger than the Theoretical Variance.
In the ANOVA Table, what concept of testing does it follow for analyzing population means?
Comparing the confidence intervals for each population mean.
Several specific hypothesis tests of all pairs of population means.
Calculating one confidence interval for all populations and see if it contains all sample averages.
An overall hypothesis test of all population means.
An overall hypothesis test of all population means.
Please select two choices that are the components of the ANOVA method?
Tukey Table
Levene's Table.
ANOVA Table.
Sum-of-Squares Table.
The ANOVA table.
The Tukey table
In an ANOVA dataset, how are the data values arranged in the wide view / in the long view?
By order of the variables / By order of the data values.
By variables / By populations.
By populations / By variables.
By importance of the variables / By rank of the variables.
By populations / By variables.
In the long view of an ANOVA dataset, what information is in the Response Variable / in the Factor Variable?
A measured response / A controlled stimulus.
The values of the response variable / The values of the predictor variable.
The measured data values / The names of the populations.
The measured data values / The appropriate multiplier.
The measured data values / The names of the populations.
In an ANOVA data set, how many levels are there in the Factor Variable?
Up to three.
No levels.
One for each population.
Less than the number of data values.
One for each population.
In the ANOVA method, select each choice that is an assumption of this method?
The population variances are equal.
Each individual is selected randomly.
The data values in each population have the normal shape.
All individuals are independent of each other.
Each individual is selected randomly.
All individuals are independent of each other.
The data values in each population have the normal shape.
The population variances are equal. (ALL)
What information does the ANOVA table NOT give when the null hypothesis is rejected?
That all the population means are equal.
That none of the population means are equal.
How the population means are not equal.
Which population means are equal.
How the population means are not equal.
In the Tukey Table, what concept of testing does it follow for analyzing population means?
Several hypothesis tests for all pairs of population means.
Comparing the confidence intervals for each population mean.
Calculating one confidence interval for all populations and see if it contains all sample averages.
An overall hypothesis test of all population means.
Several hypothesis tests for all pairs of population means.
In the ANOVA table, what is the result when the value of all three (or more) population means are equal?
The Actual Variance is close in size to the Theoretical Variance.
The Actual Variance is exactly equal to the Theoretical variance.
The Actual Variance is larger than the Theoretical Variance.
The Actual Variance has the same mathematical sign as the Theoretical Variance.
The Actual Variance is close in size to the Theoretical Variance.
In the ANOVA table, what information does the Theoretical Variance give?
The expected spread of the sample variances coming from one population.
The expected spread of the sample averages coming from one population.
Two of these other answers.
The calculated spread of the sample averages coming from one population.
The expected spread of the sample averages coming from one population.
In the ANOVA table, what information does the Actual Variance give?
The calculated spread of the data values.
The calculated spread of the population means.
The calculated spread of the sample averages.
The calculated spread of the sample variances.
The calculated spread of the sample averages.
In the ANOVA table, how are these two special variances actually analyzed?
By subtracting to see if the resulting value is close to zero.
By dividing to see if the resulting value is close to one.
By converting into F-values and comparing.
By multiplying to see if the resulting value is positive.
By dividing to see if the resulting value is close to one.
In the long view of an ANOVA dataset, what type of data is in the factor variable / in the response variable?
Continuous data / Continuous data.
Discrete data / Qualitative data.
Qualitative data / Continuous data.
Continuous data / Qualitative data.
Qualitative data / Continuous data.
In an ANOVA dataset, how many levels are in the factor variable if it contains four values: freshman, sophomore, junior, and senior?
One level for a one-way ANOVA.
One level for each population.
Four levels.
Two of these other answers.
Two of these other answers.
How many factor variables are in a One-Way ANOVA?
Two of these other answers.
One factor variable for a one-way ANOVA.
One factor variable for each categorical variable in the dataset.
One factor variable for each population.
One factor variable for a one-way ANOVA.
In the ANOVA table, there are four assumptions to be met. What is the focus of the first two assumptions / the last two assumptions?
Concerns random selection / Concerns normality.
Concerns the data values / Concerns the populations.
Concerns the Theoretical variance / Concerns the Actual variance
Concerns proper data values / Concerns a proper dataset.
Concerns the data values / Concerns the populations.
In the ANOVA table, what does the assumption of Normality mean?
The shape of the response variable is normal.
The shape of each population is normal.
The shape of each data value is normal.
The shape of the factor variable is normal.
The shape of each population is normal.
In the ANOVA table, what does the assumption of Equal Variance mean?
All populations have the same variance.
The mathematical sign in the alternative hypothesis is not equal
(≠).
All data values have the same variance.
The response variable and the factor variable have the same variance
All populations have the same variance.
In the ANOVA table, what is the ANOVA fraction?
Fraction = response var./ factor var.
Fraction = actual var. / theoretical var.
Fraction =response var./levels var.
Fraction = theoretical var./actual var.
Fraction=Actual Variance/Theoretical Variance
Lesson 8.2
The ANOVA table is a hypothesis test based on the ANOVA fraction. What is the ANOVA fraction?
Fraction = response var./ factor var.
Fraction = actual var. / theoretical var.
Fraction =response var./levels var.
Fraction = theoretical var./actual var.
Fraction=Actual Variance/Theoretical Variance
In the ANOVA table, what is the value of the ANOVA fraction for one population mean / more than one population mean?
Fraction = 0 / Fraction = 1.
Fraction < 1 / Fraction > 1.
None of these other answers.
Fraction = 1 / Fraction > 1.
Fraction = 1 / Fraction > 1.
In the ANOVA table, what is the proper interpretation of the value of the ANOVA fraction shown below?
Actual Variance/Theoretical Variance=
4.56
The spread of the sample averages is wide enough to come from more than one population mean.
The Actual Variance is 4.56 times the Theoretical Variance.
This high a value significantly indicates that the population means are equal.
This ANOVA is not valid as the Actual Variance cannot be larger than the Theoretical Variance.
The spread of the sample averages is wide enough to come from more than one population mean.
In the ANOVA calculations, how is the value of the Actual Variance found?
Summing the three (or more) sample variances and dividing the degrees of freedom.
Pooling the three (or more) sample variances together.
Using the sum-of-squares table on the three (or more) sample averages.
Using the sum-of-squares table on the data values.
Using the sum-of-squares table on the three (or more) sample averages.
In the ANOVA calculations, what is the statistical importance of pooling the three (or more) sample variances?
To combine three statistics into one statistic with more information.
Pooling sample averages is equivalent to binning continuous data.
To reduce the calculations later in the method.
To get an average sample variance to use in the equations.
To combine three statistics into one statistic with more information.
Flip
S2p= 21.33
In the ANOVA calculations, use the information in the table below to calculate the pooled sample variance?
S2p= 20.33
S2p= 20.00
S2p= 18.48
S2p= 21.33
F0 = 2.41 / Reject the null hypothesis.
In the ANOVA table, using the information shown below, calculate the ANOVA fraction test statistic / state the conclusion to the hypothesis test?
F0 = 0.41 / Do not reject the null hypothesis.
F0 = 1.55 / Reject the null hypothesis.
F0 = 2.41 / Reject the null hypothesis.
F0 = 2.41 / Do not reject the null hypothesis.
F0 = 0.88 / Do not reject the null hypothesis.
In the ANOVA table, using the information shown below, calculate the ANOVA fraction test statistic / state the conclusion to the hypothesis test?
F0 = 211.00 / Reject the null hypothesis.
F0 = 1.97 / Reject the null hypothesis.
F0 = 0.88 / Do not reject the null hypothesis.
F0 = 1.14 / Do not reject the null hypothesis.
S2p= 11.0, using the equation for pooling.
In the ANOVA table, use the information below to find the value of the Pooled variance?
S2p = 9.78, using the equation for pooling.
S2p= 7.00, using the sum-of-squares table.
S2p= 11.0, using the equation for pooling.
S2P= 11.0, using the equation for averaging.
S2 actual = 100
In the ANOVA table, use the information below to find the value of the Actual variance?
S2 actual=21
S2 actual=100
S2 actual= 200
S2 actual= 66
F0 = 2.46 / Reject the null hypothesis.
In the ANOVA table, use the information below to find the value of the ANOVA fraction / conclusion to the hypothesis test (use CV = 1.87)?
F0 = 15.7 / Reject the null hypothesis.
F0 = 0.41 / Do not reject the null hypothesis.
F0 = 9.85 / Reject the null hypothesis.
F0 = 2.46 / Reject the null hypothesis.
S2 actual= 1,193
In the ANOVA table, use the information below to find the value of the Actual variance for the number of calories in three types of hot dogs?
S2 actual= 1,193
S2 actual= 795
S2 actual= 1,541
S2 actual= 396
S2 theoretical=32.9
In the ANOVA table, use the information below to find the value of the Theoretical variance for the number of calories in three types of hot
dogs?
S2 theoretical= 104.0
S2 theoretical=32.9
S2 theoretical=109.6
S2 theoretical= 29.9
F0 = 36.26 / The types of hot dogs have different calories.
In the ANOVA table, use the information below for the number of calories in three types of hot dogs to find the value of the ANOVA fraction / interpretation of the ANOVA fraction (use CV = 3.14)?
F0 = 20.9 / The types of hot dogs have different calories.
F0 = 36.26 / The types of hot dogs have different calories.
F0 = 108.8 / The types of hot dogs have different calories.
F0 = 0.03 / The types of hot dogs have the same calories
S2 actual = 155.8.
In the ANOVA table, use the information below to find the value of the Actual variance for the amount of sodium in three types of hot dogs?
S2 actual= 103.9
S2 actual= 316.7
S2 actual= 155.9
S2 actual= 45.0
S2theoretical = 559.7.
In the ANOVA table, use the information below to find the value of the Theoretical variance for the amount of sodium in three types of hot dogs?
S2theoretical = 1,886.0
S2theoretical = 621.9.0
S2theoretical = 559.7.
S2theoretical = 1,770.0
F0 = 0.28 / The types of hot dogs have the same amount of sodium.
In the ANOVA table, use the information below for the amount of sodium in three types of hot dogs to find the value of the ANOVA fraction / interpretation of the ANOVA fraction (use CV = 1.97)?
F0 = 0.88 / The types of hot dogs have the same amount of sodium.
F0 = 0.28 / The types of hot dogs have the same amount of sodium.
F0 = 2.78 / The types of hot dogs have different amounts of sodium.
F0 = 3.59 / The types of hot dogs have different amounts of sodium.
Flip
In the ANOVA table, select the choice below that is NOT a property of the F-distribution.
Population mean = 0.0.
Range = (0, +∞).
Shape = Unimodal and skewed right.
Area under the curve = 1.0.
Population mean = 0.0.
In the ANOVA table, use the information below to find the value of the Actual Variance?
Brand n x s2
A 9. 5. 9.
B 9. 10. 10.
C 9. 15. 11.
Actual Variance = 16.
Actual Variance = 10.
Actual Variance = 25.
Actual Variance = 50.
Actual Variance = 25 .
In the ANOVA table, use the information below to find the value of the Theoretical Variance?
Brand n x s2
A 9. 5. 19.
B 9. 10. 13.
C 9. 15. 22.
S^2 pooled=18
Theoretical Variance = 2.
Theoretical Variance = 10.
Theoretical Variance = 6.
Theoretical Variance = 18.
Theoretical Variance = 2.
In the ANOVA table, use the information below to find the value of the ANOVA fraction test statistic?
Brand n x s2
A 95. 9.
B 9. 10. 13.
C 9. 15. 22.
S^2 actual =25. S^2 theoretical=6
ANOVA fraction = 4.2.
ANOVA fraction = 12.5.
ANOVA fraction = 0.24.
ANOVA fraction = 7.2.
ANOVA fraction = 4.2.
In the ANOVA table, use the information in the table below to calculate the pooled sample variance?
Pop 1 Pop 2 Pop 3
Variance: 10. 20. 30
Count: 11 11 23
S2p = 22.00
S2p =22.67
S2p = 22.33
S2p = 22.86.
S2p = 22.86.
In the ANOVA table, what is the purpose of the F-curve?
To use for probability of the critical value and test statistic.
To be able to draw the situation in the schematic curve.
The t-curve analyzes means, the F-curve analyzes variances.
To calculate the Theoretical variance of the ANOVA fraction.
To use for probability of the critical value and test statistic.
In the ANOVA table, where does the significance level (α) come from?
From the researcher.
From statistical theory.
From prior studies.
From social importance.
From the researcher.
In the ANOVA table, what type of hypothesis test uses the ANOVA fraction?
A right-tail hypothesis test.
A no-tail hypothesis test.
A left-tail hypothesis test.
A two-tail hypothesis test.
A right-tail hypothesis test.
In the ANOVA dataset, a balanced dataset means that each sample has the same number of data values (n1 = n2 =n3). Is a balanced dataset required by the ANOVA method?
Yes, ANOVA requires a balanced dataset for small datasets.
No, ANOVA works with unbalanced datasets.
No, unless the dataset has a wide range of data values.
Yes, ANOVA requires balanced datasets.
No, ANOVA works with unbalanced datasets.
In the ANOVA table, use the information below to find the value of the Theoretical variance?
Car n x s2
Chevy 16 100 119
Ford 16 110 121
Chrysler 16 120 126
s2pooled = 122
S2 theoretical = 7.6.
S2 theoretical= 70.4.
S2 theoretical= 30.5.
S2 theoretical= 40.7
S2 theoretical = 7.6.
Lesson 8.3
In the ANOVA method, what is the purpose of the ANOVA table?
To determine if the population means are equal.
None of the other answers.
To determine if the sample averages are equal.
To determine if the population variances are equal.
To determine if the population means are equal.
In the ANOVA method, how are the assumptions of Randomness and Independence checked to see that they are met?
Calculating the five-number summary and the fences.
Using a sum-of-squares table.
Using the appropriate histogram(s).
Checking that the sampling method was appropriate.
Checking that the sampling method was appropriate.
In the ANOVA method, how are the assumptions of Normality / Equal Variance checked to see that they are met?
Checking the sampling method / Checking the sampling method.
Using the appropriate histogram(s) / Using a sum-of-squares table.
Using the F-test / Using the ANOVA fraction.
Using the Shapiro-Wilk test / Using the Levene's test.
Using the Shapiro-Wilk test / Using the Levene's test.
Flip
The shape is normal, because 0.418 is greater than 0.05.
In the ANOVA method, what information does the computer output (shown below) give you?
The population variances are equal, because 0.4188 is greater than 0.05.
The shape is normal, because 0.418 is greater than 0.05.
The shape is normal, because 0.918 is greater than 0.05.
The population variances are not equal, because 0.918 is less than 1.0.
The population variances are equal, because 0.2903 is greater than 0.05.
In the ANOVA method, what information does the computer output shown below give you?
The population variances are equal, because 0.2903 is greater than 0.05.
The shape is normal, because 0.2903 is less than 1.3125.
The shape is normal, because 0.2903 is greater than 0.05.
The population variances are not equal, because 1.3125 is greater than 1.0.
The units of information in each row.
In the ANOVA table (shown below), what information is given in the Degrees of Freedom column?
Two of these other answers.
The units of information in each row.
The number of data values in each row.
The amount of spread in each row.
The Sum-of-Squares / The Mean Squares.
In the ANOVA table (shown below), which column gives the raw measure of spread / the standardized measure of spread, for each row?
The Mean Squares / The Sum-of-Squares.
The Model / The Error.
The F-Value / The P-Value.
The Sum-of-Squares / The Mean Squares.
F0 = 18.13.
In the ANOVA table (shown below), what is the value of the F-Ratio? [hc09]
F0 = 18.13.
F0 = 1.75.
F0 = 18.40.
F0 = 190.32.
No, because the values should be DFerror = 27 and DFc total = 29
In the ANOVA table (shown below), are the degrees of freedom correct for a situation with three populations and ten data values from each population?
No, because the values should be DFerror = 27 and DFc total = 29
Unknown, because this table does not have that information.
Yes, because the DF check is met (2+21 = 23).
Yes, because the degrees of freedom are correct.
More than one population mean.
In the ANOVA table (shown below), how many different population means are indicated?
One population mean.
One or more population means.
More than one population mean.
Three or less population means.

One population mean.
In the ANOVA method, how many population means are indicated in the Tukey table shown below?
Three or less population means.
More than one population mean.
One population mean.
Two population means.
MSday = 3,560,717 / MSerror = 193,438.
In the ANOVA table shown below, what is the value of the mean square DAY / mean square Error?
MSday = 4,062,197 / MSerror = 7,121,434.
MSday = 36.8 / MSerror = 386.3.
MSday = 14,242,868 / MSerror = 85,306,137.
MSday = 3,560,717 / MSerror = 193,438.
A variance (sum-of-squares/degrees of freedom) for each row.
In the ANOVA table (example below), what do the words Mean Square stand for?
The amount of information contained in each row.
A raw measure of spread for each row.
An average sum-of-squares for each row.
A variance (sum-of-squares/degrees of freedom) for each row.
SSday = 7,129,434 / SSerror = 4,069,197.
In the ANOVA table shown below, what is the value of the Sum-of-Squares DAY / sum-of-squares Error?
SSday = 7,129,434 / SSerror = 4,069,197.
SSday = 1,782,358 / SSerror = 9,227.
SSday = 36.8 / SSerror = 386.3.
SSday = 973,794 / SSerror = 10,224,837.
Cannot tell because the ANOVA table tests for means, not for variances.
In the ANOVA table shown below, should the population variances be considered equal?
No , because the MSday (3,564,717) is greater than MSerror (193,771).
No, because the p-value (<0.0001) is less than alpha (0.05).
No, because only sample variances are in the ANOVA table.
Cannot tell because the ANOVA table tests for means, not for variances.
The Friday and Wednesday population means are equal. The Monday population mean is less.
In the ANOVA method, in the Tukey table shown below, what is the appropriate relationship between the values of the population means?
None of the population means are equal.
The Friday and Wednesday population means are equal. The Monday population mean is less.
The Friday and Monday population means are equal.
The Friday, Wednesday, and Monday population means are equal.
The Tuesday, Thursday, and Wednesday population means are equal.
In the ANOVA method, in the Tukey table shown below, what is the appropriate relationship between the values of the population means?
The Tuesday, Thursday, and Wednesday population means are equal.
The Friday and Thursday population means are equal. The Wednesday population mean is less.
The Tuesday and Wednesday population means are not equal.
None of the population means are equal.
Yes for Normality, Yes for Equal Variance.
In the ANOVA method, using the computer output shown below, are the assumptions of Normality and Equal Variance met?
No for Normality, Yes for Equal Variance.
No for Normality, No for Equal Variance.
Yes for Normality, No for Equal Variance.
Yes for Normality, Yes for Equal Variance.
The population means are not all equal.
In the ANOVA method, using the computer output shown below, what is the appropriate relationship between the population means?
None of the population means are equal.
The population means are all equal.
The population means are not all equal.
Two of the population means are equal, and one is less.
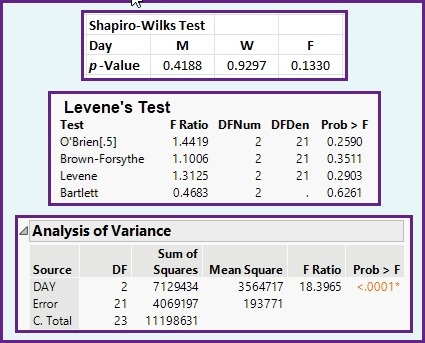
Friday= Wednesday > Monday.
In the ANOVA method, using the computer output shown below, what is the appropriate relationship between the population means?
Friday = Wednesday > Monday.
Friday > Wednesday > Monday.
Friday = Monday < Wednesday.
Friday = Wednesday = Monday
Yes for Normality, Yes for Equal Variance.
In the ANOVA method, using the computer output shown below, are the assumptions of Normality and Equal Variance met?
Yes for Normality, Yes for Equal Variance.
No for Normality, No for Equal Variance.
Yes for Normality, No for Equal Variance.
No for Normality, Yes for Equal Variance.

The population means are all equal.
In the ANOVA method, using the computer output shown below, what is the appropriate relationship between the population means?
The population means are all equal.
Two of the population means are equal, and one is less.
None of the population means are equal.
The population means are not all equal.
Tuesday = Thursday = Wednesday.
In the ANOVA method, using the computer output shown below, what is the appropriate relationship between the population means?
Tuesday = Thursday = Wednesday.
Tuesday = Thursday > Wednesday.
Tuesday = Wednesday > Thursday.
Tuesday > Thursday > Wednesday.
No for Normality, Yes for Equal Variance.
In the ANOVA method, using the computer output shown below, are the assumptions of Normality and Equal Variance met?
No for Normality, Yes for Equal Variance.
No for Normality, No for Equal Variance.
Yes for Normality, No for Equal Variance.
Yes for Normality, Yes for Equal Variance.

The population means are all equal.
In the ANOVA method, using the computer output shown below, what is the appropriate relationship between the population means?
The population means are not all equal.
Two of the population means are equal, and one is less.
None of the population means are equal.
The population means are all equal.
Summer = Spring = Winter.
In the ANOVA method, using the computer output shown below, what is the appropriate relationship between the population means?
Summer = Winter > Spring.
Summer = Spring > Winter.
Summer > Spring > Winter.
Summer = Spring = Winter.
Flip
In the ANOVA table, the bottom row is a check row for the degrees of freedom and the sum-of-squares? What information about spread is given in Row 1 / Row 2?
About the sample averages / About the data values.
None of the other answers.
About the sample variance / About the pooled sample variance.
About the largest sample variance / About the smallest sample variance.
About the sample averages / About the data values.
In the ANOVA method, what is the purpose of the Tukey table?
To calculate the differences between the sample averages.
To determine if all the population means are equal.
To rank the population means from highest to lowest.
To determine which population means are not equal.
To determine which population means are not equal.
In the ANOVA method, how are the sample averages arranged in the Tukey table?
From highest to lowest.
In alphabetical order by population name.
From lowest to highest.
In the order in the dataset.
From highest to lowest.
In the ANOVA method, how does the Tukey table determine if two population means are equal?
The difference in the two sample averages is less than the MSD.
The difference in the two sample averages is greater than the MSD.
The difference in the two sample averages is a positive value.
The difference in the two sample averages equals the MSD.
The difference in the two sample averages is less than the MSD.
In the ANOVA table, which are the two assumptions about the sample data values / about the populations?
Randomness and Normality / Independence and Equal Variance.
Randomness and Equal Variance / Independence and Normality.
Randomness and Independence / Normality and Equal Variance.
Independence and Normality / Randomness and Equal Variance
Randomness and Independence / Normality and Equal Variance.
What was the original purpose of the ANOVA table?
To present the ANOVA information in a computer output.
To make it easy to calculate the F0 test statistic by hand.
It was the form required in research papers.
To list the values of all the components in the F-test.
To make it easy to calculate the F0 test statistic by hand.
In the ANOVA table, the conceptual ANOVA fraction is shown below. How is this fraction modified to a mathematically equivalent form that is used in the ANOVA table?
(S2/x) /(s2p/n)
Multiply by 1/n.
Multiply by n.
Multiply by n/n.
Divide by n .
Multiply by n/n
In the ANOVA method, does the Tukey table provide new information when the null hypothesis in the ANOVA table is NOT rejected?
Yes, any additional statistical test gives more information.
No, because the Tukey table always gives the same information as the ANOVA table.
Yes, the Tukey table gives new information about the population means.
No, because the Tukey table should have only one letter.
No, because the Tukey table should have only one letter.