Cardio Review and Intro to ECGs
 Call Kai
 Learn
Learn Practice Test
 Spaced Repetition
 Match
Match Flashcards
 Knowt Play
1/49

There's no tags or description
Looks like no tags are added yet.
Name | Mastery | Learn | Test | Matching | Spaced | Call with Kai | Chat |
|---|
No analytics yet
Send a link to your students to track their progress
50 Terms
Special Properties of Cardiac Cells: Excitable
Each cardiac cell has a resting potential to “fire” or depolarize
Purpose: For the cell to contract
Special Properties of Cardiac Cells: Conductive
Activated cardiac cells can stimulate adjacent cells to contract
Purpose: For the heart to pump as a unit
Special Properties of Cardiac Cells: Automatic
Certain cells have capacity to “fire” spontaneously with an inherant rhythm without external stimulus
Purpose: Pacemaker cells
Special Properties of Cardiac Cells: Refractory
Cells cannot be stimulated to depolarize during rest phase
Purpose: allows heart chambers to rest/refill
Cardiac innervation - What do the nerves innervating the heart control?
Heart rate and blood pressure
Conduction of electrical impulses through the heart muscle
Myocardial contraction
Cardiac Innervation: Parasympathetic Nervous System
Works to slow the heart rate
Vagus Nerve
Cardiac Innervation: Sympathetic Nervous System
Works to increase heart rate and blood pressure
Norepinephrine
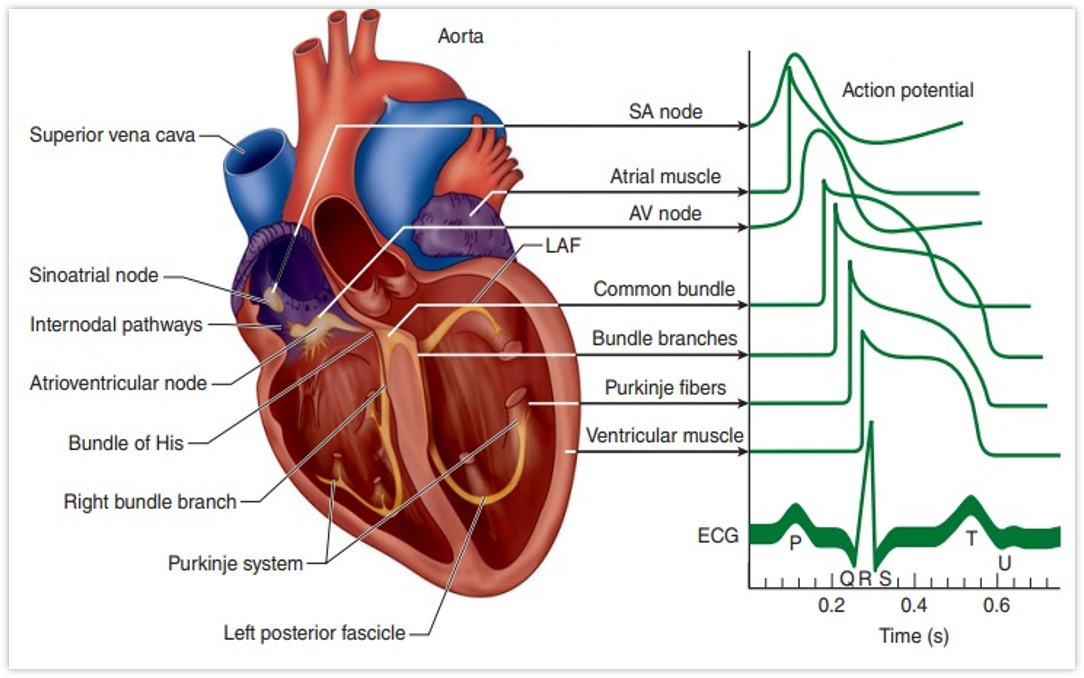
Cardiac Action Potential
Rapid sequence of changes in the voltage across a cell membrane
The membrane voltage (or potential) is determined by the relative ratio of extracellular to intracellular ions
Depolarization and Repolarization of the cell

How electrical impulses travel thorugh the heart
SA Node
Stimulates atrial contraction (main pacemaker)
Sends Impulse to AV Node
AV Node
Slows conduction, allowing atria to fully contract
Controls length of diastole
Bundle of His
Signals beginning of systole
R/L Bundle Branches
Purkinje Fibers

Cardiac Action Potential - Photo
6 Ways to evaluate heart function
Pulse rate and quality
Heart rate and rhythm
Heart sounds
Mucous membrane color
Capillary refill time (CRT)
Electrocardiogram
What does and ECG tell us?
Only tells us about the electrical function of the heart
It does not tell us anything about how the heart is physically functioning.
Electrical activity can be present without a physical heartbeat.
What we learn from ECG’s
Heart rate and rhythm
Chamber enlargement
Visual representation of how the electrical impulses move through the heart
Can help determine best course of treatment
ECG Indications
Evaluation of arrythmias and heart rate
History of syncope, weakness, or trauma
Pre-anesthetic workup
Cardiac monitoring during anesthesia
Critical illness
Concurrent drug administration
Lead Polarity
Patient attached to the ECG machine by 4 cables with clips
Lead selection knob on the ECG machine causes 2 of the 4 cables to become charged
One limb becomes the positive pole
A different limb become the negative pole
Run a standard 6 lead ECG
6 different viewa of heart’s electrical activity
Each lead reads different on machine
Lead II is most important for evaluation and interpretation
Lead Polarity: Different leads
Change in leads = change in polarity of electrodes
Changes appearance and amplitude of the ECG waves
DIfferences help with diagnosis
Lead Polarity: Limb Leads
Lead I: RA 9-) to LA (+)
Lead II RA (-) to LL (+)
Lead III: LA (-) to LL (+)
Lead Polarity
Augmented leads
aVR: ½ between LA-LL(-) to RA(+)
aVL: ½ between RA-LL(-) to LA(+)
aVF: ½ between RA-LA(-) to LL(+)
Einthoven’s Triangle
Leads I-III form an inverted triangle around the heart
Each lead = heart at another angle
Electrical impulses traveling toward the “+” pole = positive deflection on ECG
Moving away = “-” deflection

When electrical impulses move toward the positive pole of a lead…
An upward deflection is recorded
When electrical impulses move toward the negative pole of a lead…
A downward deflection is recorded
When an electrical impulse moves perpendicular to the lead…
No deflection is recorded
When there is an absence of electrical activity…
there is no deflection recorded
The magnitude of the deflection is…
proportional to the mass of the muscle
Patient positioning
Right lateral recumbency
Decreases muscle tremor artifact
Alters the amplitude of PRS waves
Shifts mean electrical axis to the right relative to standing Legs 90 degrees to the body
Clips should be attached near the elbows, stifles
Clips should not touch each other or the table (metal)
Patient and restrainer must remain still
ECG Cable Placement
White - Right FL
Green - Right HL
Black - Left FL
Red - Left HL
What is Happening in the Heart - P Wave
Atrial Depolarization
Deflection of ECG - Small positive deflection
What is Happening in the Heart - PR Segment
Pause at the AV node
Deflection of ECG - no deflection
What is Happening in the Heart - PR Interval
Atrial contraction and pause at AV node
Deflection of ECG - Small positive deflection (P wave) and no deflection (PR segment)
What is Happening in the Heart - QRS Complex
Ventricular depolarization and atrial repolarization (hidden)
Deflection of ECG - Small negative deflection, followed by large positive deflection, and small negative deflection
What is Happening in the Heart - St Segment
Pause between ventricular depolarization and repolarization
Deflection of ECG - No deflection
What is Happening in the Heart - T wave
Ventricular repolarization
Deflection of ECG - small positive deflection
What is Happening in the Heart - QT interval
Ventricular depolarization
Small positive deflection
What is Happening in the Heart - QT interval
Ventricular depolarization and repolarization
Deflection of ECG - Small negative, then large positive, small negative, no deflection, sm. +
ECG Waveforms

U Wave?
Small positive deflection after the T wave
Difficult to identify
It is thought to represent repolarization of the Purkinje fibers, but its exact source is unknown

Paper speed and amplitude
Amplitude is measured on the vertical axis in millivolts (mV)
Time is measured on the horizontal axis in seconds (s)
Each small box measures 1 mm by 1 mm
Each large box measures 5 mm by 5 mm
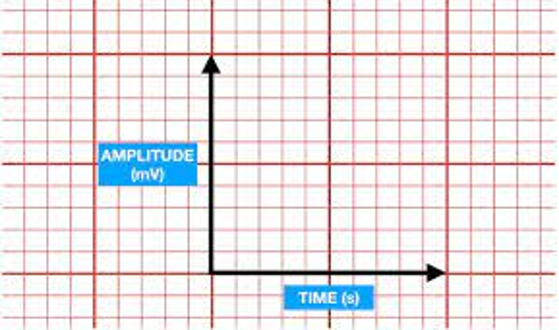
Used to calculate heart rate and durations
Two Paper Speeds
25 mm/sec
1 mm= 0.04 sec
Standard speed
50 mm/sec
1 mm = 0.02 sec
Best for arrhythmias
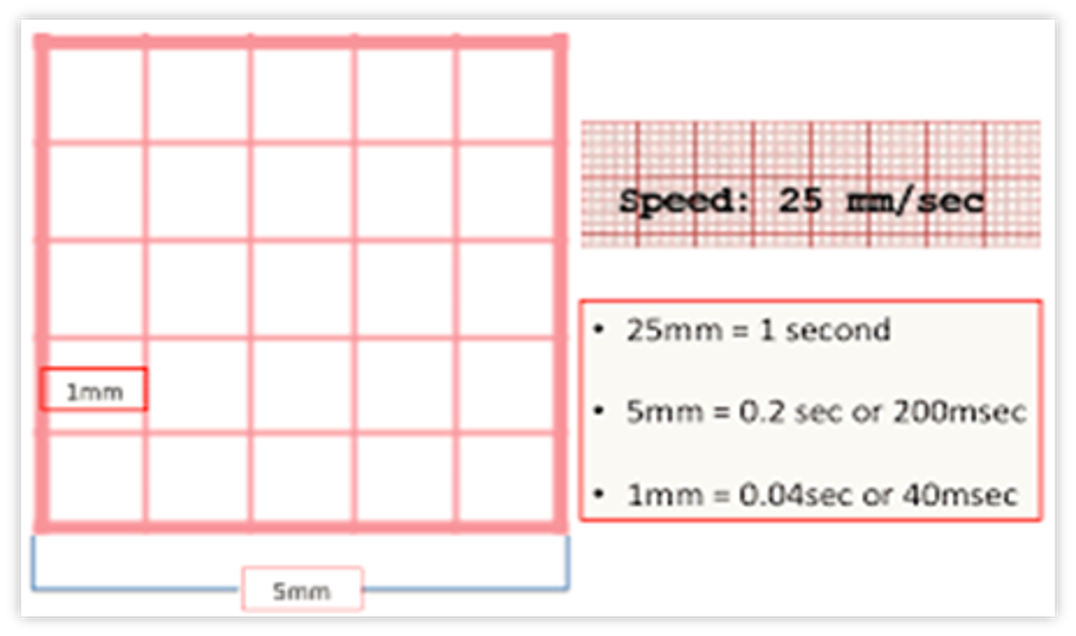
Paper Speed 25 mm/sec
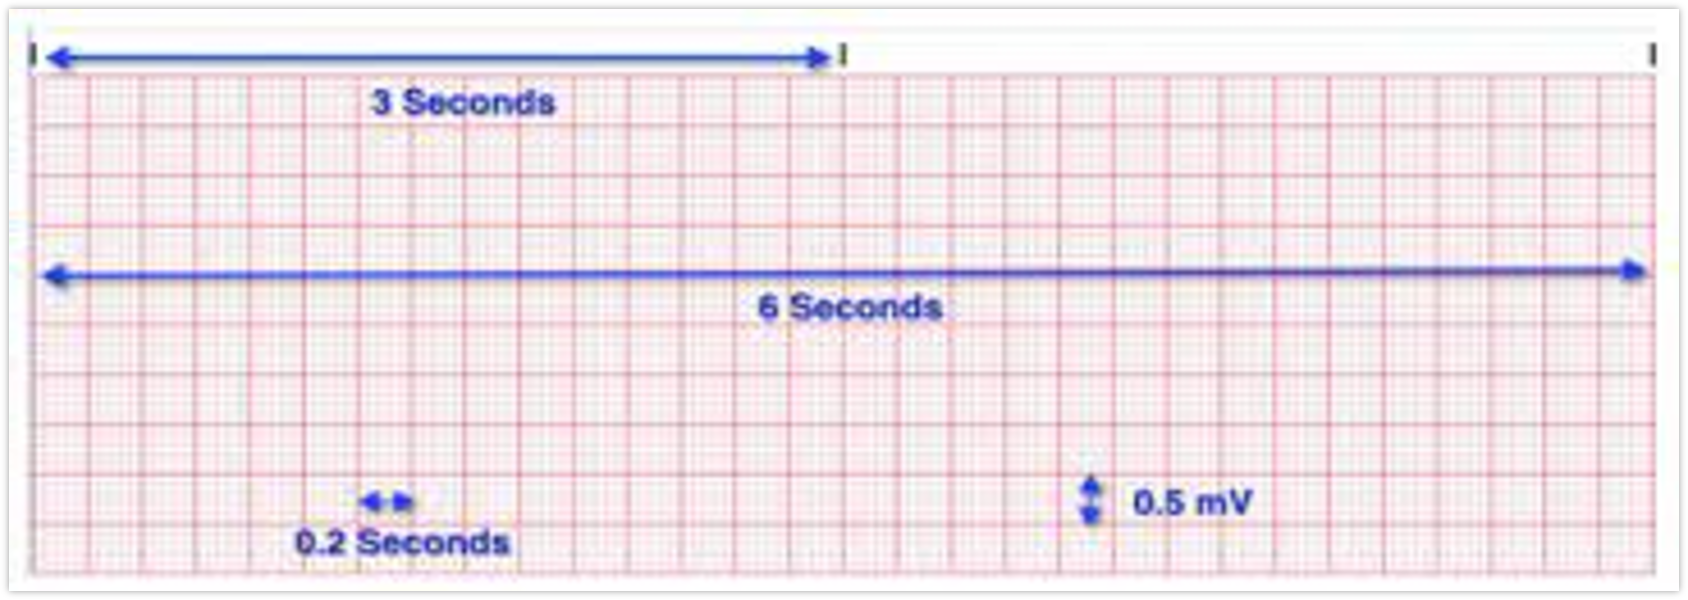
1500 small boxes/min
300 large boxes/min
Paper speed 50 mm/sec
3000 small boxes/min
600 large boxes/min
Heart rate calculation methods

Calibration
Calibration is used to calculate the amplitude (voltage) of the waves on an ECG tracing
Calibration Settings
5 mm/mV - often used for large animals (horses, cattle) due to large complex size
10 mm/mV - Often used for dogs
20 mm/mV - Often used for cats due to small complex size
Calibration Box

The calibration box should print out at the beginning of every ECG tracing
You can calculate the calibration from the calibration box
Most ECGs will also have the calibration printed on the bottom of the paper
ECG Interpretation - Time
Time (Duration) - Measured on horizontal axis (seconds)
This is the time it takes for something to happen
Atria to contract, pause at the AV node, Ventricles to contract/atria repolarization, ventricular repolarization
Paper speed affects only horizontal measurements
ECG Interpretation (Amplitude)
Amplitude (Mass) - Measured on vertical axis (height of waves) (milivolts)
Calibration affects only vertical measurements
Time interpretation
Abnormally long time means
One or more chambers is/are enlarged
± faculty electrical conduction
Shorter (faster) than normal times mean
SA node is being driven to contract faster by sympathetic nervous system (damaged heat tissue/muscle cells) usually in the ventricles
Amplitude Interpretation
Amplitude of ECG waveform indicates the amount of muscle mass present
Amplitude of P wave = size of atrial mass
Amplitude of QRS complex = size of ventricular mass
Mass Interpretation
Larger than normal amplitudes mean
The corresponding muscle mass is larger than normal
P wave = atrial enlaregment
QRS complex = ventricular enlargement
Smaller than normal amplitudes mean
The corresponding muscle mass is smaller than normal
Abnormal Examples
P wave
too tall = right atrial enlargement
too wide = left atrial enlargement
PR interval
too short = tachycardia from drugs, fear, or ectopic beat
too long = increased vagal tone, AV block (1st, 2nd, or 3rd degree)
QRS complex
too tall = left ventricular enlargement (LV has more mass than RV)
too wide = ventricular enlargement, bundle branch block, or ectopic beat
Deep S wave = right ventricular enlargement
ST segment
Evaluation or depression from baseline may include myocardial ischemia