PP ECON ANALYSIS CHAP 2
 Call Kai
 Learn
Learn Practice Test
 Spaced Repetition
 Match
Match Flashcards
 Knowt Play
1/27

There's no tags or description
Looks like no tags are added yet.
Name | Mastery | Learn | Test | Matching | Spaced | Call with Kai | Chat |
|---|
No analytics yet
Send a link to your students to track their progress
28 Terms

The demand curve; what is it a graphical depiction of; what is P, what is Q
The demand curve is a graphical depiction of the relationship between the
price of a good and the quantity demanded
• Price (P) is often on the vertical axis
• Quantity demanded (Qd)is often on the horizontal axis
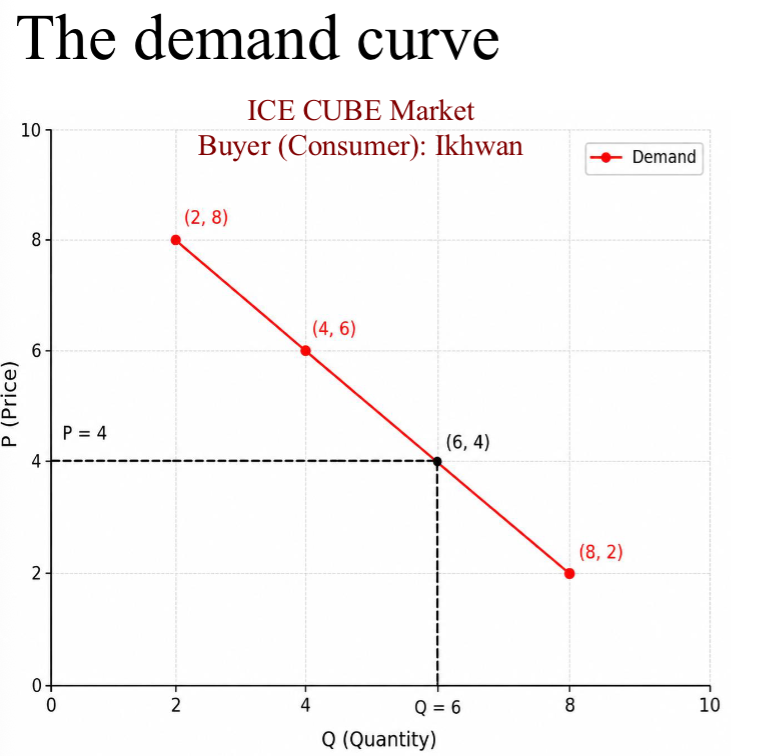
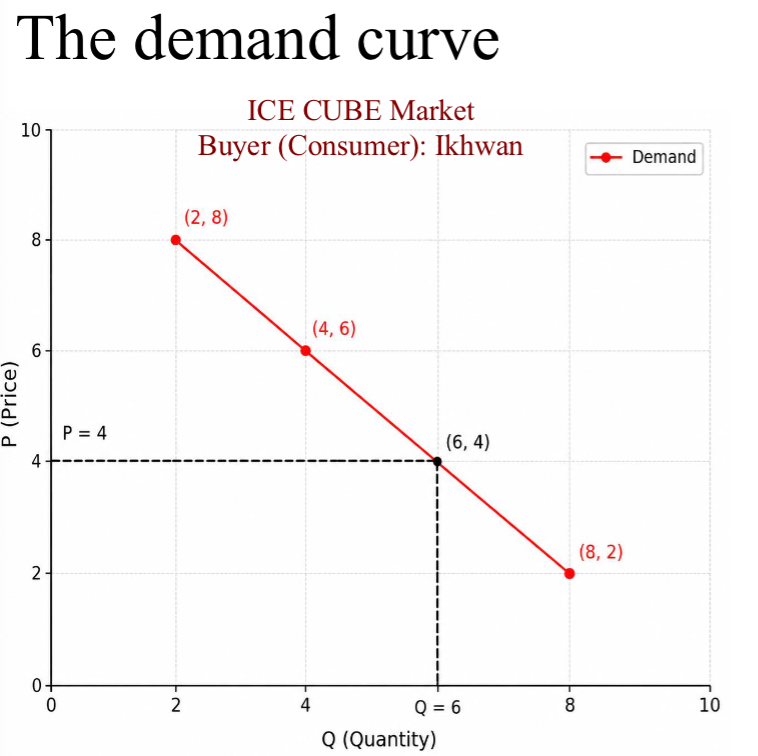
The demand curve: What does each point on the demand
curve (e.g., (6, 4)) represent?; the demand curve illustrates the (2 words)
At a price of $4, the quantity demanded for this good that the consumer is willing and able to purchase is 6.
The demand curve illustrates the Maximum Quantity of a good that consumers are willing and able to purchase at each price, all else equal


The demand curve: What does the demand curve tell us about the relationship between price and quantity demanded?
There is an inverse relationship between the quantity demanded of a good and its price, holding all other factors constant
The demand curve slopes downward (i.e., it has a negative slope).
• The Law of Demand
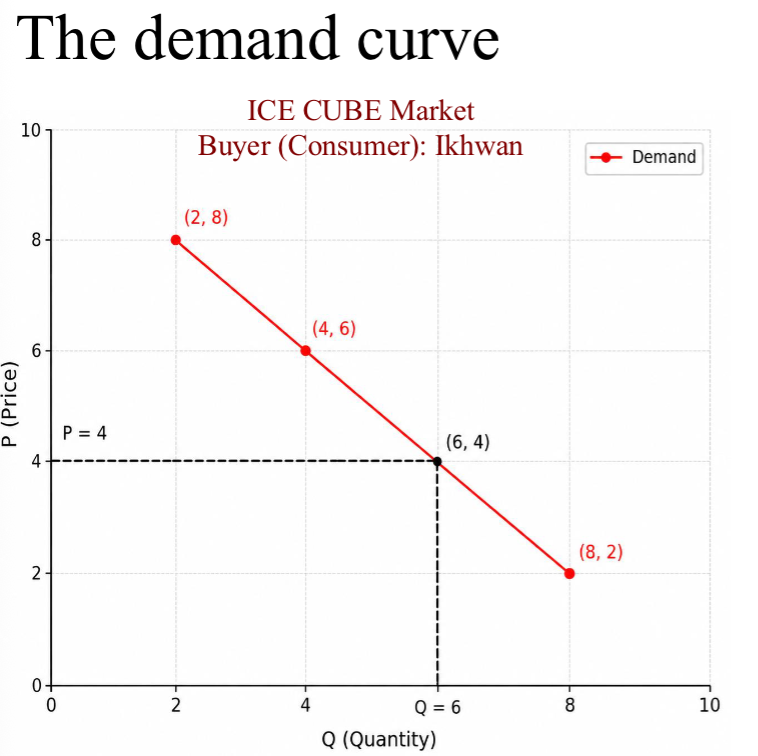
Why are demand curves downward sloping? (2 REASONS)
1. Substitution effect: when the price of a good rises, consumers purchase less of that good and more of similar goods that are now relatively less expensive
2. Income effect: when the price of a good rises, a consumer’s real income falls, making them less able to purchase all goods
What kinds of movements can we observe in the demand curve?
movements along the demand curve
movement OF the demand curve = shift of the demand curve
Movements along the demand curve occur when…
A change in price results in a change in quantity demanded
• A change in the price of a good result in a movement along the
demand curve

movement of the demand curve = shift of the demand curve occur when…
If any determinant of demand other than a good’s own price
changes, the demand curve shifts

Factors that SHIFT the demand curve (5)
Income
Prices of related goods: Substitutes: goods that are interchangeable & Complements: goods that go together
A will fall.
• Tastes and preferences
• Population
• Taxes and subsidies levied on consumers
DEMAND CURVE: Substitutes and Complements
• Substitutes: goods that are interchangeable
• If goods A and B are substitutes, and the price of good B rises, the demand for good A will rise.
• Complements: goods that go together
• If goods A and B are complements and the price of good B rises, the demand for good A will fall

Coffee Market: When the price of coffee increases, what happens?
A. Movement along the demand curve: Quantity demanded increases
B. Movement along the demand curve: Quantity demanded decreases
C. Demand curve shifts right
D. Demand curve shifts left
E. No effec
A change in price results in a movement along the demand curve
- When the price increases, quantity demanded decreases.

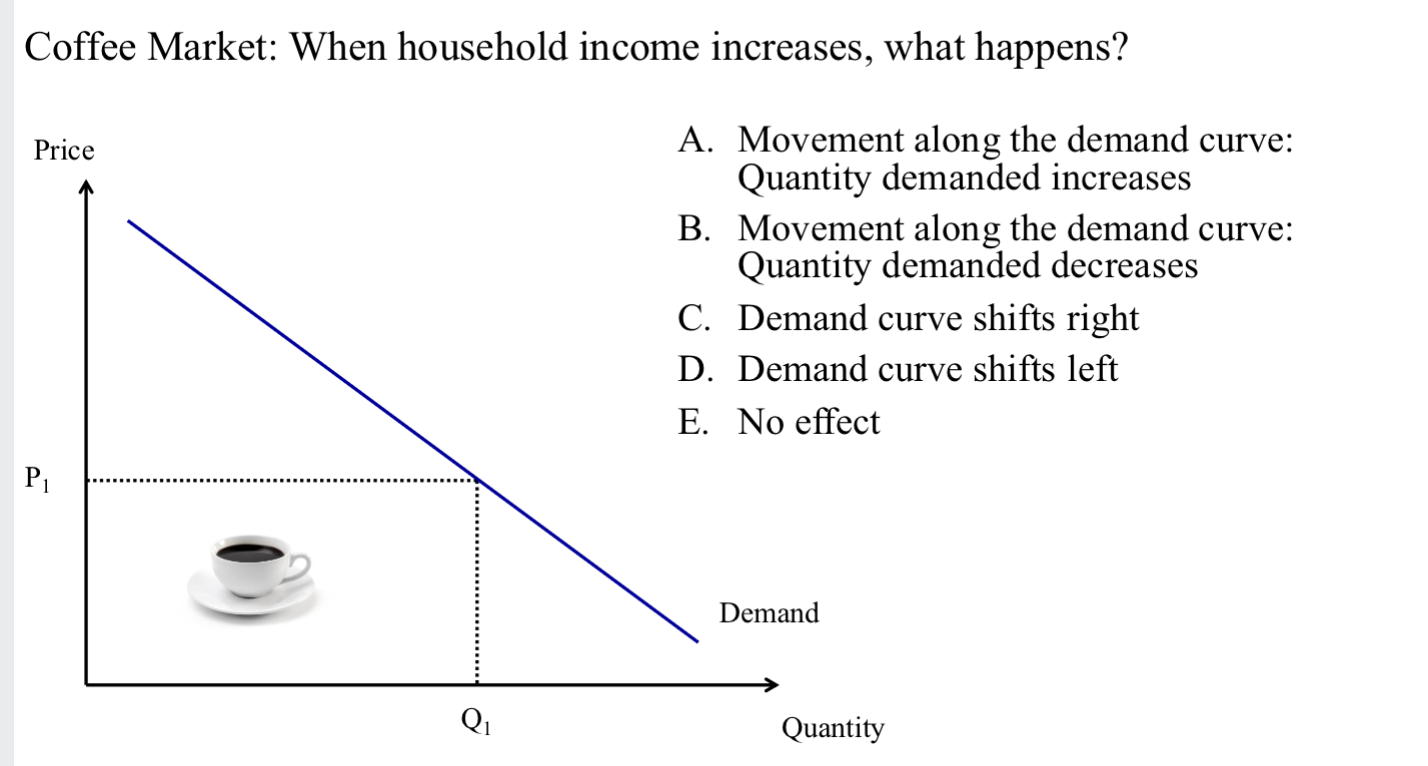
An increase in income shifts the demand curve to the right


A positive change in preference shifts the demand curve to the right


An increase in the price of a substitute
causes demand to shift to the right
o substitute aka tea is expensive, coffee would be demanded more
o An increase in the price of a substitute causes demand to shift to the right


An increase in the price of a
complementary good causes demand
to shift to the left


The supply curve; what is it a graphical depiction of; what is P, what is Q
The supply curve is a graphical depiction of the relationship between the price of a good and the quantity supplied
• Price (P) is often on the vertical axis
• Quantity supplied (Qs)is often on the horizontal axis


the supply curve; what does each point on the supply curve (ex. 4,4) represent?
At a price of $4, the quantity supplied for this good that the seller is willing and able to sell is 4.
• The supply curve illustrates the maximum quantity of a good that producers are willing and able to produce at each price, all else
equal

the supply curve: why kind of slopes do supply curves have?
Supply curves often have positive slopes
• There is a general expectation that quantity supplied will increase
with price
• All else equal, the higher the price of a good, the more of a good
firms are willing to produce
What kinds of “movements” can we observe in the supply curve?
movements along the supply curve
movement of the supply curve = shift of the supply curve
supply curve: movements along the supply curve
A change in price results in a change in quantity supplied
• A change in the price of a good result in a movement along the
supply curve

supply curve: movement of the supply curve =. shift of the supply curve
If any determinant of supply other than a good’s own price changes,
the supply curve shifts

factors that SHIFT the supply curve
input prices (labor, capital, raw materials, etc)
technology
taxes and subsidies levied on producers

A change in price results in a movement along the supply curve
- When the price increases, quantity
supplied increases

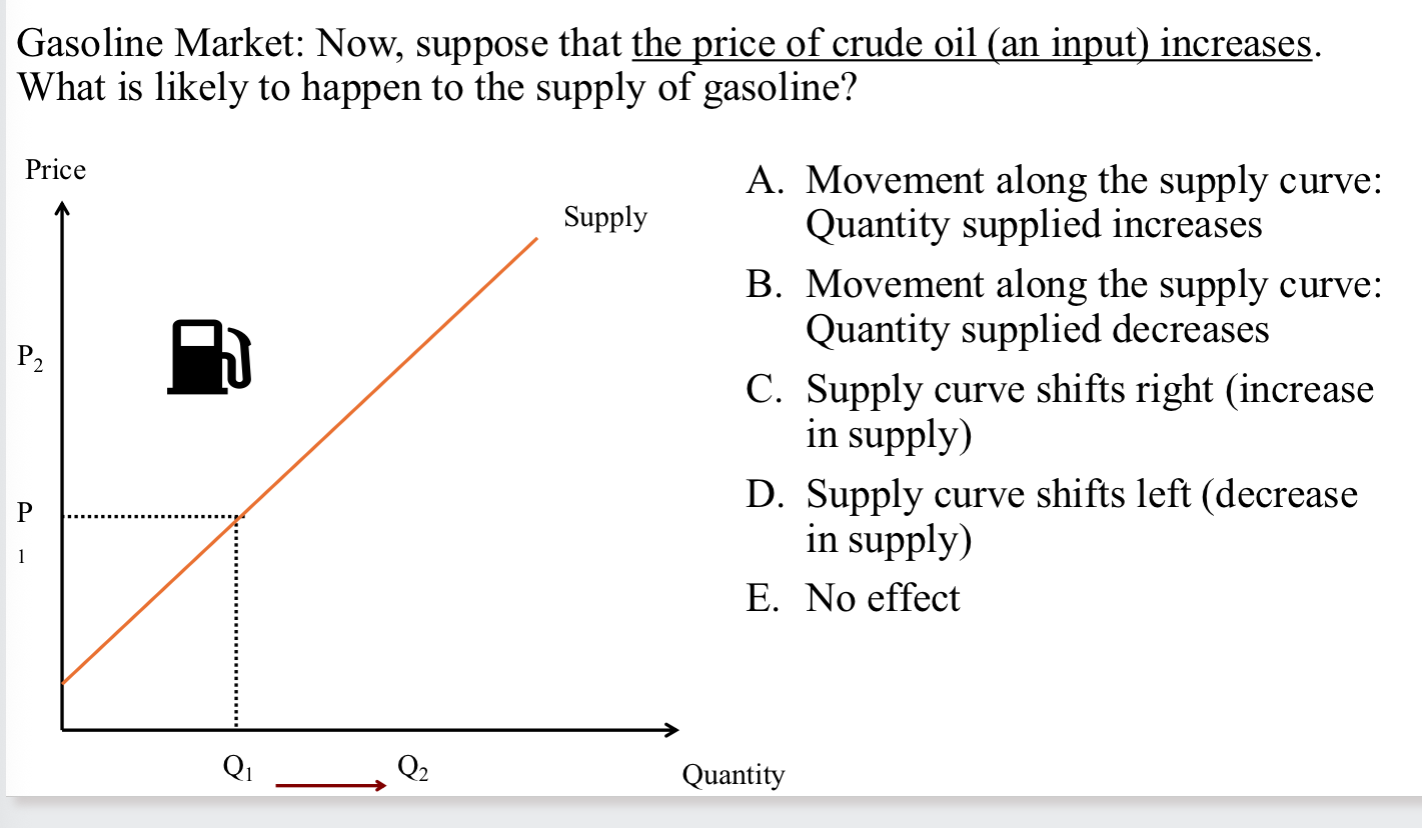
An increase in input costs
shifts the supply curve to the
left


An advancement in technology shifts the supply
curve to the right


For each curve type, what is the P change and Q Change?


Market Equilibrium what is it
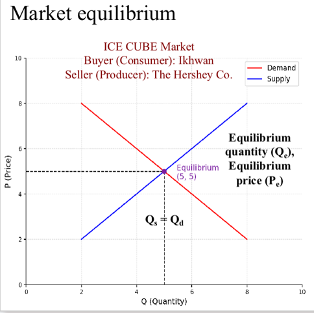
o A market is where buyers (demand) and sellers (supply) interact
o Market equilibrium: a state in which there are no forces acting to change the current quantity or price
§ Equilibrium occurs where quantity supplied equals quantity demanded
§ Qd = Qs

Market in disequilibrium: Excess supply (surplus); what is this, what do suppliers do then
o When the price is not the equilibrium price, the market is not in equilibrium
§ The price is HIGHER than the equilibrium price
o Now, the quantity supplied is greater than the quantity demanded
o Excess supply (surplus)
o Suppliers will lower the price to increase sales (demanded quantity)
§ They will continue to lower the price until it reaches the equilibrium price

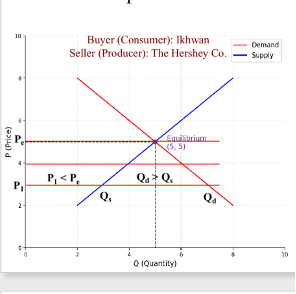
· Market in disequilibrium: Excess demand (shortage); what is it and what do suppliers do?
o The price is LOWER than the equilibrium price
o Now, the quantity demanded is greater than the quantity supplied
o Excess demand (shortage)
Suppliers will increase the price as byers compete against one another by bidding the price upward
§ They will raise the price until it reaches the equilibrium price
