Lecture 10: The Normal Distribution
 Call Kai
 Learn
 Practice Test
 Spaced Repetition
 Match
 Flashcards
 Knowt Play
1/5

There's no tags or description
Looks like no tags are added yet.
6 Terms
What are the key properties of the normal distribution?
The normal distribution has the following properties:
Symmetrical, bell-shaped, and smooth.
Mean = Median = Mode, all located at the centre.
Total area under the curve (AUC) = 1 (100%).
Shape determined by two parameters:
Mean (μ): Location.
Standard deviation (σ): Spread.
Probability is represented by the area under the curve.
The normal distribution formula gives the probability density at a particular value Y:

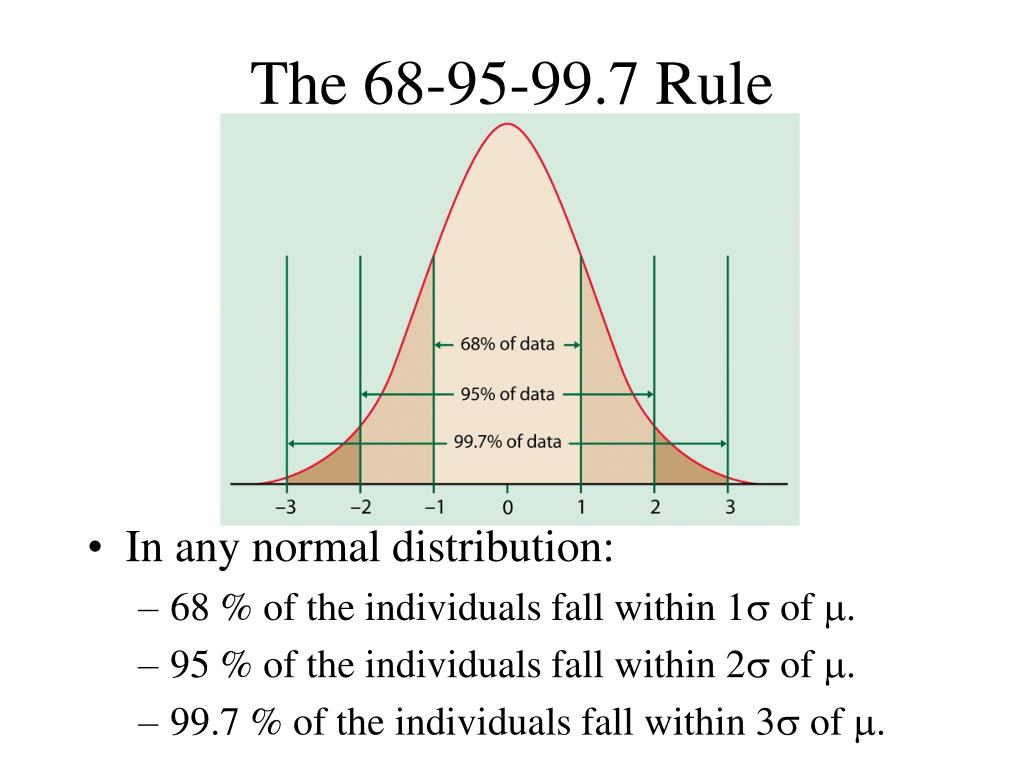
What is the 68–95–99.7 rule?
The 68–95–99.7 rule describes the approximate percentage of observations that fall within 1, 2, or 3 standard deviations of the mean in a normal distribution.
μ ± 1σ: Approximately 68% of observations.
μ ± 2σ: Approximately 95% of observations.
μ ± 3σ: Approximately 99.7% of observations.
What are the key properties of the standard normal distribution (z-distribution)?
The standard normal distribution (z-distribution) is just a standardized normal distribution with the following key properties:
Mean (μ) = 0.
Standard deviation (σ) = 1.
Values are expressed as z-scores.
Symmetry: Positive and negative z-scores of equal magnitude are mirror images, with equal tail probabilities.
Range probabilities: The probability of a z-score falling between two values can be calculated by subtracting their right-tail probabilities (if using a right tail z-table):
Pr[lower < Z upper] = Pr[Z > lower] − Pr[Z > upper]

What does a z-score tell us?
A z-score tells us how many standard deviations a value is from the mean.
Z = 0: Value is at the mean.
Z > 0: Value is above the mean.
Z < 0: Value is below the mean.
Why do we standardize?
Standardizing converts a value into a z-score, allowing us to place it on a universal scale with a mean of 0 and a standard deviation of 1. This allows us to compare values from different normal distributions and calculate their probabilities.
Note: We can also standardize a sample mean from a sampling distribution.
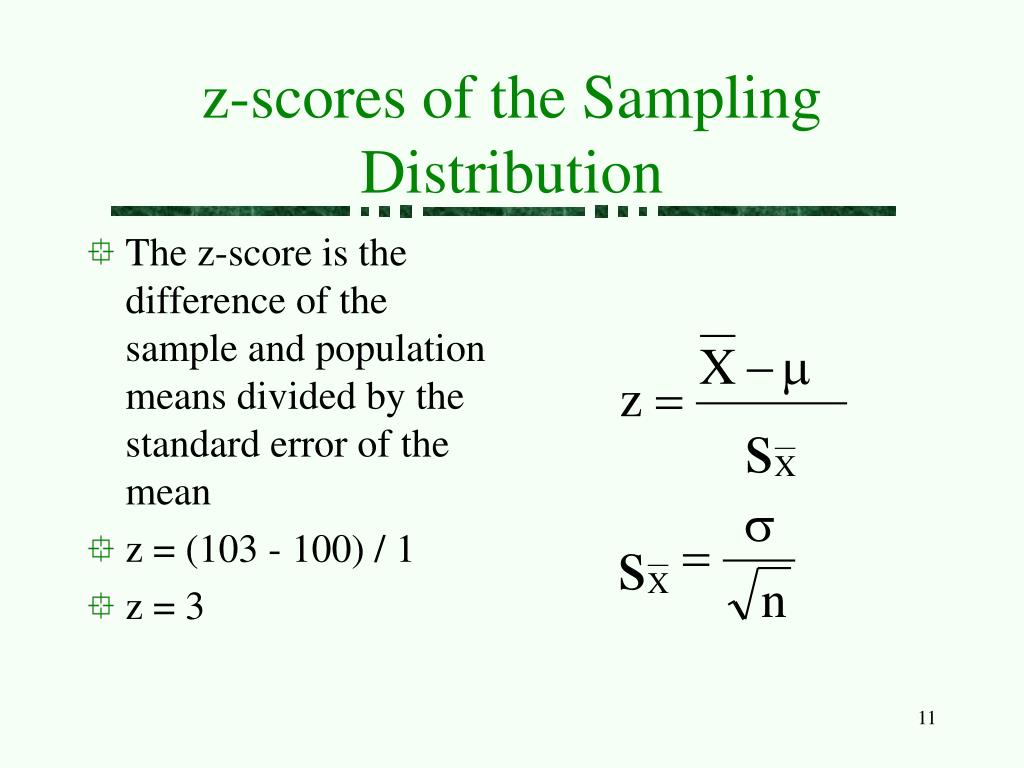
According to the central limit theorem, this normal approximation can be used even when the population is not normally distributed, provided the sample size is large enough.
When and how can the normal distribution approximate a binomial distribution?
The normal approximation to the binomial distribution allows us to calculate binomial probabilities using z-scores and the standard normal distribution, provided there are enough expected successes and failures:
np ≥ 10
n(1 − p) ≥ 10
We can then standardize the number of successes (X) using the following formula:
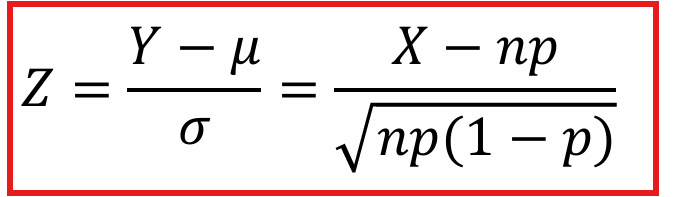
Then use the z-table to find the corresponding probability.
Continuity correction: When approximating binomial probabilities with a normal distribution, adjust the count boundary by 0.5. For “X or more,” use X − 0.5; for “X or fewer,” use X + 0.5. Use the corrected value in the Z-score formula.