Chem 004 Units 1 and 2
 Call Kai
 Learn
Learn Practice Test
 Spaced Repetition
 Match
Match Flashcards
 Knowt Play
1/20

There's no tags or description
Looks like no tags are added yet.
Name | Mastery | Learn | Test | Matching | Spaced | Call with Kai | Chat |
|---|
No analytics yet
Send a link to your students to track their progress
21 Terms
Air is a mixture of many substances, including nitrogen, oxygen, carbon dioxide, argon, and water. Which of the following properties of substances are “differentiating characteristics” that could be used to separate or identify each component? Options: Density, solubility, boiling point, volume, pressure, temperature, mass
Density, solubility in water, boiling point
Imagine that you were interested in separating pure oxygen from the atmosphere for commercial purposes. You may want to sell it to hospitals for using in the treatment of pneumonia, emphysema, and other respiratory diseases like COVID-19.
Which of the following properties of oxygen could be used to separate it from other air components?
Boiling point

The image shows the heating curve for nitrogen. Use the data to estimate the melting point of this substance.
64k

Which of the following graphs describes the energy absorbed when liquid nitrogen is heated up and transformed into a gas?
B
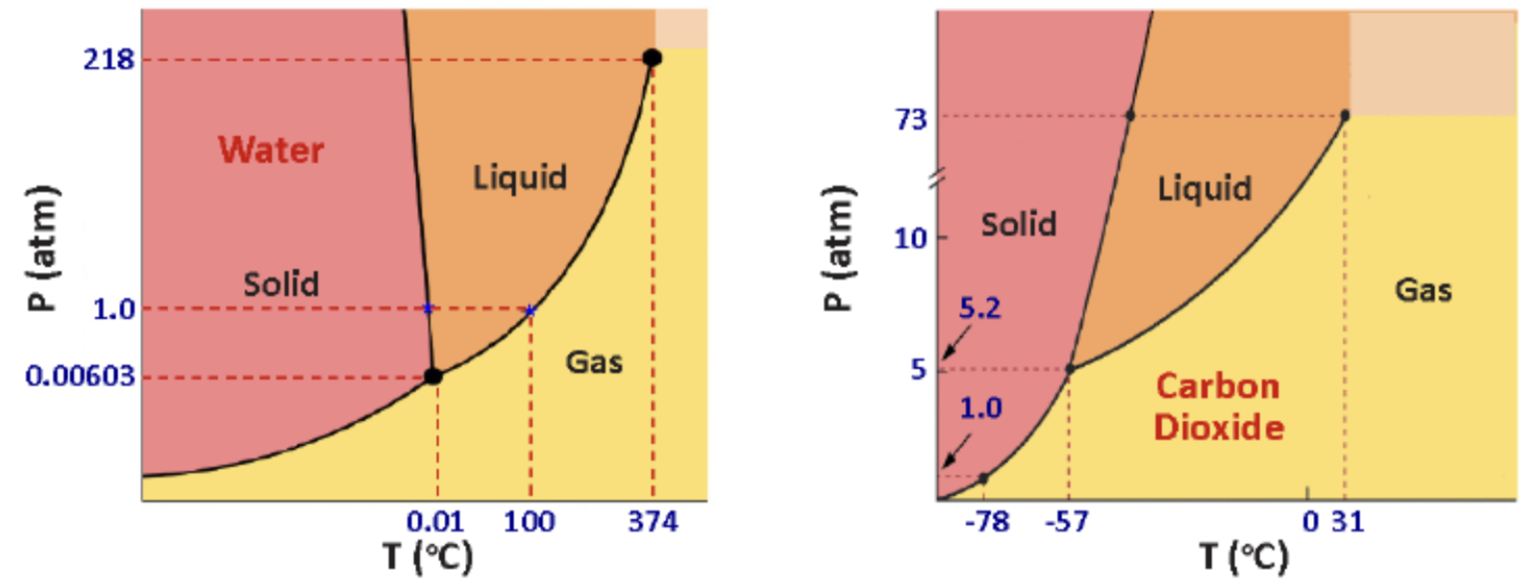
What is the stable phase of each of these substances at 40 °C and 1 atm?
Water is a liquid; Carbon dioxide is gas

Estimate the melting point of carbon dioxide at 10 atm.
-50C

According to the phase diagrams, what happens to a solid sample of each substance when the pressure is increased?
Solid water melts, solid carbon dioxide remains in the same place.

What is the state of matter of substances A, B, and C in Figure 1.6 at 1 atm (760 mm Hg) and 360 K?
A and B are gases; C is a liquid

Match the substances A, B, and C in Figure 1.6 to the most accurate description of their relative volatility.
Least volatile- C (water)
Most volatile- A (methanol)
Medium- B (ethanol)


Imagine you had a liquid mixture of water, ethanol, and methanol at 20 °C and 1 atm. Predict the order in which each of the substances would distill if you heated up the mixture to separate its components (first substance to distill on the top of the list).
1) Methanol 2) Ethanol 3) Water

Estimate the temperature at which methanol would distill at 1 atm (760 mm Hg)?
330 K
According to the simulation, how does the average speed of the particles changes with temperature?
The average speed of the particles increases as temperature increases
Imagine that you had a sample of pure liquid water, water vapor, and water ice at this substance’s triple point (273.16 K, 4.58 mm Hg).
If you could measure the speed of the water particles at the submicroscopic level, in which state of matter would you expect particles to have the lowest average speed?
The average speed would be the same for all phases

The graph in Figure 1.12 indicates that the attractive forces between two particles
Decreases with increasing distance between particles
It is expected that under the same conditions of temperature, volume, and number of particles, gases made up of particles that interact more strongly with one another will exert (larger, lower, or the same?) average pressures on the walls of the container than gases with weaker interactions between particles.
Lower

Which of the following graphs best represents the change in gas pressure P when the temperature T of the system is varied at constant volume V, number of particles N, and mass m?
B
Which of the following graphs best represents the change in gas pressure P when the volume V of the system is varied at constant temperature T, number of particles N, and mass m?
C


Which of the following graphs best represents the change in gas pressure P when the number of particles N in the system is varied at constant volume V , temperature T, and particle mass m?
A
Which of the following properties are emergent properties of a substance and not properties of its individual particles? (Viscosity, color, malleability, density)
All

The following graphs show the variation of the potential energy as a function of distance for three different substances. In which case are the attractive interactions between particles stronger?
Substance 1

Which of the following energy graphs best represents the change in the total kinetic energy (white bars) and the total potential energy (black bars) of the particles in a liquid S when it is freezing to its solid S phase at the freezing point?
C