Lecture 4, Chapter 53 - Community Ecology
 Call Kai
 Learn
Learn Practice Test
 Spaced Repetition
 Match
Match Flashcards
 Knowt Play
1/33

There's no tags or description
Looks like no tags are added yet.
Name | Mastery | Learn | Test | Matching | Spaced | Call with Kai | Chat |
|---|
No analytics yet
Send a link to your students to track their progress
34 Terms
Community
an assemblage of populations of different species in a particular area/habitat (communities can have distinct/gradual boundaries)
Community Ecology
focuses on the processes driving interactions between different species + the consequences
Consequences
number of species and the relative population size of each species
Biodiversity
the variety of life at all its levels, from genes to species to ecosystems
Shannon-Wiener’s Diversity Index (H’)
Diversity metric that incorporates both evenness + richness
H’ = - Σ [pi ln (pi)] → using this to measure biodiversity; useful for comparing sites
What do you need for Shannon-Wiener’s Diversity Index (H’)?
# of species
proportion of each species (counts, % cover, biomass)
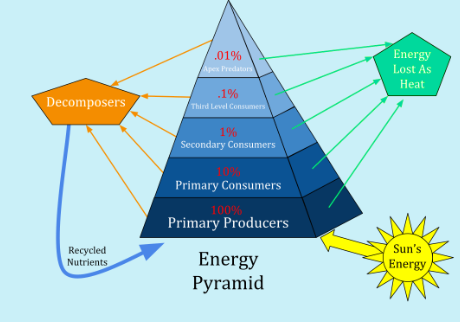
Describe the Energy Pyramid
energy lost each level by 10%
Primary producer
Primary consumer
Secondary consumer
Third level consumer
Apex predator
What is the difference between primary producers and secondary consumers?
primary producers make their own food (i.e. - via photosynthesis) to get energy while secondary consumers are organisms that feed off of producers to get energy

What do the red arrows show on the Salt March Food Chain?
shows the flow of energy

What do the black arrows show on the Salt March Food Chain?
shows the effect on top of species on lower species (in this case - and predation)
What are some ways we determine food webs? (4 ways)
observational
gut content (can be biased)
fecal analysis
stable isotopes
Stable Isotopes
an element with the same number of protons and different number of neutrons (unlike radioactive isotopes, they DO NOT decay over time - they are “stable”)
isotopes can tell us about:
trophic levels (nitrogen isotopes reveal food web position)
primary production source (carbon isotopes can trace energy sources)
animal movement (oxygen/hydrogen isotopes can reflect water sources)
Direct Effects
occur when the species interact without involving other species (i.e. - parasitism, predation, interference competition, etc)
Indirect Effects
occurs when the species interact in a way that involves one or more intermediate species (indirect effects initiated by predators are called trophic cascade - removing a predator can impact an entire ecosystem → related to keystone species)
Keystone Species
a species that has a disproportionate effect (compared w/ abundance) on the community
apex (top) predators can often be keystone species
to test a species to see if it is, REMOVE IT
What did Bob Paine’s Pisaster Removal Experiment (1969)
shows the amount of biodiversity depended on the survival of the sea star (starfish) → therefore it IS a keystone species
Ecological Succession
the change in species composition over time
Seral Stage
each stage of community change during the process of succession
Primary Succession
development of communities in habitats that have no plants and organic soil (lava flow)
Secondary Succession
development of communities that doesn’t have plants but DOES have organic soil (forest fire; still has organic soil)
Direct Observation
documenting changes in community composition across time
problem: difficult to do for succession that happens over time scales (Krakatau → lava, volcano)
Indirect Observation
looking back in time; examine communities that began succession at different times (space-for-time substitution)
problem: can’t tell initial conditions were the same (lake Michigan → looking at sediments, who lived there, etc)
Pioneer Species
factors that contribute to early success:
good dispersers to new/disturbed sites
rapid growth/reproduction
factors that contribute to outcompeted:
poor competitors
shade intolerant (for plants)
Climax Species
factors to contribute to late success:
large size as adults
shade tolerant (for plants)
factors that contribute to early failure:
bad dispersers (i.e. - large seeds)
slow growing/invest in below-ground biomass
Island Biogeography
the study of the distribution and characteristics of species (particularly how factors like island size and isolation (distance from mainland))
the closer the island is to mainland, the more biodiversity and lower extinction (easier access to other species)
Demographic stochasticity
random variation in birth and death rates due to differences between individuals
Environmental stochasticity
random variation in birth and death rates due to changes in environmental conditions
Patch Size
larger patches support larger population; as patch size increases, so does richness (because of lower extinction rate)
Equilibrium Theory of Island Biogeography
the number of species on an island reflects a balance between the colonization of new species and the extinction of existing species
Limiting nutrient
nutrients run out and it limits productivity
Secondary productivity
energy transferred from producer to consumers and some energy is stored in new consumer biomass
Assimilation efficiency
the ratio of energy absorbed from consumed food to the food’s total energy content
Harvesting efficiency
the percentage of available food in a lower trophic level that a consumer actually eats or ingests