Lecture 14 (Ligand Binding 2)
 Call Kai
 Learn
 Practice Test
 Spaced Repetition
 Match
 Flashcards
 Knowt Play
1/28

There's no tags or description
Looks like no tags are added yet.
29 Terms
Surface Plasmon Resonance (SPR) is
a label-free, real-time optical technique used to study biomolecular interactions (e.g., protein–protein, protein–DNA, antibody–antigen)
SPR measures
changes in the refractive index, and this change is translated into a measurable resonance angle shift, proportional to the amount of bound material
Ligand-analyte binding
refractive index increases
SPR provides
kinetic, affinity, and concentration information
SPR: Ligand and Analyte

In an SPR experiment
one molecule (referred to as the Ligand, usually a protein) is immobilized on a sensor chip and binding to a second molecule (the Analyte) is measured under flow
SPR: SPR angle and electrons resonate

In SPR the metal layer (gold)
possesses surface mobile electrons
In SPR at certain incidence angle the incoming beam of light
disturbs these electrons causing changes in surface plasmon waves. These electrons then “resonate” giving a name to SPR phenomena
In SPR Ka is
association rate constant (on rate) (M^-1 s^-1)
In SPR Kd is
dissociation rate (off rate) (s^-1)
In SPR KD is
the equilibrium dissociation constant (affinity) (nM)
SPR: set up
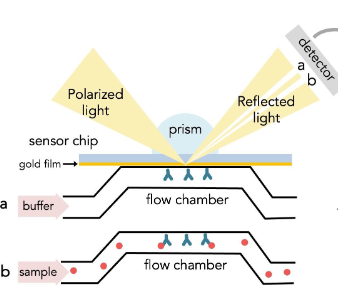
SPR: angle shift gives
resonance signal

SPR: Raw sensogram
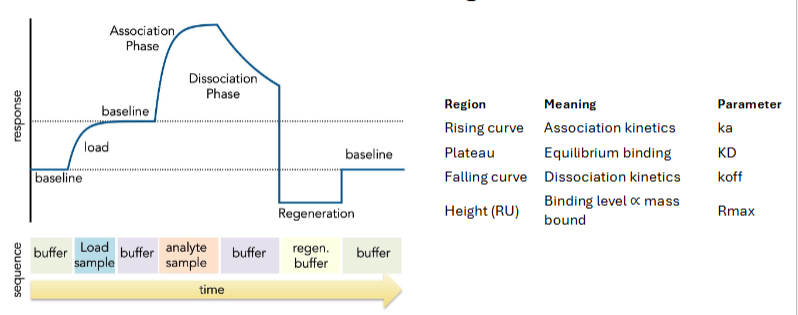
X-axis of SPR graph
Time (seconds) — continuous measurement throughout the experiment
Y-axis of SPR graph
Response Units (RU) — proportional to mass bound at the sensor surface
SPR: Overview
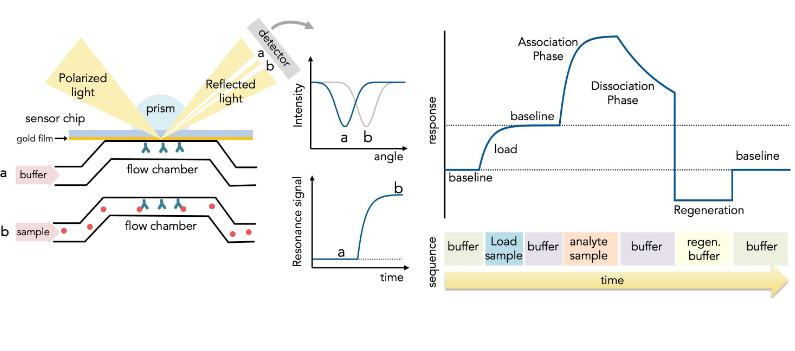
Graph means?

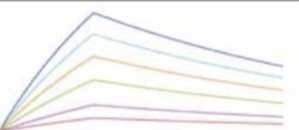
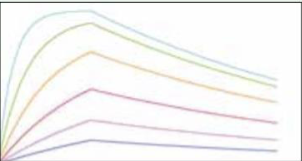
Graph means?
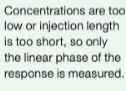

Graph means?

SPR: equations

Association Phase
Slope ∝ ka×[Analyte]
Steady-State or Equilibrium Plateau
Binding sites begin to saturate.
Rate of association ≈ rate of dissociation:
Signal levels off to a plateau = Req.
The height of this plateau (RU value) depends on analyte concentration [A] and affinity (KD).
Req=
Rmax([A] / [A] + KD)
Dissociation Phase (Buffer-Only Flow)
Injection stops, buffer resumes.
Bound analyte begins to dissociate from ligand.
Signal decays exponentially with rate constant kd.
The slope of this decay gives kd.
R(t) =
𝑅0𝑒−𝑘𝑑𝑡
Steady State at equilibrium

SPR: equations
