ACIS 3504
 Call Kai
 Learn
 Practice Test
 Spaced Repetition
 Match
 Flashcards
 Knowt Play
1/127

There's no tags or description
Looks like no tags are added yet.
128 Terms
Accuracy
Correct; free of error; accurately represents events and activities
A sale occurred on December 27 but is recorded as occurring the following year on January 4. Is an example of what type of violation?
Accuracy
Completeness
Does not omit aspects of events or activities; of enough breadth and depth
An annual evaluation of vendor performance only contains 7 months of data. Is an example of what type of violation?
Completeness
Consistency
Presented in the same format over time
A company switches the denomination of amounts (e.g., thousands, millions, etc.) irregularly. Is an example of what type of violation?
Consistency
Timely
Provided in time for decision makers to make decisions
Customer purchasing metrics are 2 years old. Is an example of what type of violation?
Timely
Validity
Data measures what it is intended to measure; conforms to syntax rules and to requirements
There are only 7 unique job positions at a company but 9 different positions are attributed to employees—2 answers are not valid. Is an example of what type of violation?
Validity
Aggregate data
The presentation of data in a summarized form
Data joining
The process of combining different data sources
Data pivoting
A technique that rotates data from rows to columns
Data Standardization
The process of standardizing the structure and meaning of each data element so it can be analyzed and used in decision making.
Data Parsing
Involves separating data from a single field into multiple fields.
Data concatenation
The combining of data from two or more fields into a single field.
Cryptic Data Values
Are data items that have no meaning without understanding a coding scheme.
Dummy variables
When a field contains only two different responses, typically 0 or 1
Misfielded data values
Data values that are correctly formatted but not listed in the correct field.
Data consistency
The principle that every value in a field should be stored in the same way.
Data de-duplication
The process of analyzing data and removing two or more records that contain identical information.
Data filtering
The process of removing records or fields of information from a data source.
Data imputation
The process of replacing a null or missing value with a substituted value.
Data contradiction error
Errors that exist when the same entity is described in two conflicting ways.
Data threshold violations
Data errors that occur when a data value falls outside an allowable level.
Violated attribute dependencies
Errors that occur when a secondary attribute in a row of data does not match the primary attribute.
Data entry errors
All types of errors that come from inputting data incorrectly.
Visual inspection
The process of examining data using human vision to see if there are problems.
Basic statistical tests
Can be performed to validate the data.
Audit a sample
One of the best techniques for assuring data quality.
Advanced testing techniques
possible with a deeper understanding of the content of data.
As part of the data standardization process, often items contained in different fields for the same record need to be combined into a single field. This process is called?
a. data aggregation
b. data concatenation
c. data parsing
d. aggregating data
b. data concatenation
Which of the following reasons describes why transforming data is necessary?
A. Multiple data values are contained in the same field and need to be separated.
B. Data within a field has various formats.
C. Data aggregated at different levels needs to be joined.
D. All of the above.
D. All of the above
In which step of the data transformation process would you analyze whether the data has the properties of high-quality data?
A. data structuring
B. data cleaning
C. data standardization
D. data validation
D. data validation
Descriptive
Summary of past events that address the basic question of “what happened?”
Diagnostic
Goes beyond examining what happened to try to answer the question, “why did this happen?”
Predictive
go beyond diagnostic analytics to answer the question “what is likely to happen in the future?”
Prescriptive
answers the question “what should be done?”
Exploratory data analysis
An approach to examine data that seeks to explore the data without testing formal models or hypotheses.
Confirmatory data analysis
Tests a hypothesis and provides statistical measures of the likelihood that the evidence (data) refutes or supports a hypothesis.
Null hypothesis
Is a proposed explanation worded in the form of an equality (e.g., paying employees more will not affect the likelihood of leaving the company)
Alternative hypothesis
Is a proposed explanation worded in the form of an inequality (e.g., paying employees more will reduce the likelihood of leaving the company)
GIGO (Garbage in Garbage out)
Data analysis is of no value if the underlying data is not of high quality.
Data overfitting
Occurs when a model is designed to fit training data very well but does not predict well when applied to other datasets.
Extrapolation beyond the range of data
Is a process of estimating a value that is beyond the data used to create the model.
Benefits of Data Visualization
processed more quickly than written or tabular information, more user-friendly, and supports the dominant learning style of the population because most learners are visual learners.
Simplification
refers to making a visualization easy to interpret and understand.
Emphasis
In design, assuring the most important message is easily identifiable.
Ethical presentation
avoiding the intentional or unintentional use of deceptive practices that can alter
the user’s understanding of the data being presented.
A company has collected performance data (machine movements, units produced, quality measures) from a production machine for several months. Each day the company has increased speed by 0.05 percent. The company plans on building a model to estimate the machine's quality measures assuming an additional 2% increase in machine speed. Which type of analytic will be performed?
A. diagnostic
B. descriptive
C. predictive
D. prescriptive
C. predictive
A company uses a boxplot in a visualization. What is likely the purpose of the visualization?
A. comparison
B. part-to-whole
C. distribution
D. correlation
C. distribution
Which chart type is best for depicting trends over time?
A. pie chart
B. area chart
C. histogram
D. bar chart
B. area chart
Comparing means and medians is an example of ___________ analytics?
A. prescriptive
B. diagnostic
C. descriptive
D. predictive
C. descriptive
Which of the following is NOT a good reason to visualize data?
A. Visualizations help the majority of people to learn better.
B. Visualized data is processed faster than written information.
C. Building visualizations does not take as much time as writing a report.
D. Users can find information more quickly with visualized data.
C. Building visualizations does not take as much time as writing a report.
A company wants to determine how to decrease employee turnover. In order to do this, they test whether paying off an employee's student debt will cause fewer employees to leave. The analytic test of whether paying off an employee's student debt causes lower turnover is an example of which type of analytic?
A. diagnostic
B. prescriptive
C. descriptive
D. predictive
A. diagnostic
Which of the following can be used to present data unethically?
A. selectively presenting only part of a visualization
B. with an axis, showing the most recent time closest to the origin
C. truncating or stretching the axes
D. All the above
D. All of the above
Which of the following is a technique to simplify data presentations?
A. distance
B. weighting
C. ordering
D. highlighting
A. distance
Making an item in the data area of a viz larger to increase emphasis is an example of using which principle?
A. weighting
B. highlighting
C. ordering
D. It's a poor design choice; items should all be the same size.
A. weighting
A general rule of thumb is that a visualization should only have 3-5 groups in the data area. Putting in more or less than this amount violates which principle?
A. color contrast principle
B. Goldilocks principle
C. emphasis principle
D. ethical data presentation principle
B. Goldilocks principle
Business process diagram
A visual representation that outlines the various steps or activities in a business
process.
Document flowchart
visual representation of the flow of documents and data within an organization. Often used in evaluating internal controls
System flowchart
Graphical representation of the relationships among various components of a system, such as input, processing, storage, and output.
Program flowchart
Illustrates the sequence of logical operations executed by a computer when carrying out a program.
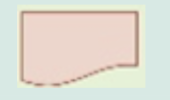
An electronic or paper document or report
Document

Illustrated by overlapping the document symbol and printing the document number on the face of the document in the upper right corner
Multiple copies of one paper document

Information displayed by an electronic output device such as a
terminal, monitor, or screen
Electronic output
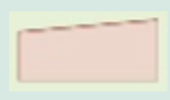
Electronic data entry device such as a computer, terminal,
tablet, or phone
Electronic data entry

The electronic data entry and output symbols are used together to show a device used for both
Electronic input and output device

A computer-performed processing function; usually results in a change in data or information
Computer processing
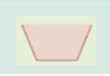
A processing operation performed manually
Manual operation

Data stored electronically in a database
Database

Data stored on a magnetic tape; tapes are popular back-up storage mediums
Magnetic tape

File of paper documents; letters indicate file-ordering sequence: N = numerically, A = alphabetically, D = by date
Paper document file

Paper-based accounting journals and ledgers
Journal/ledger

Direction of processing or document flow; normal flow is down and to the right
Document or processing flow

Transmission of data from one geographic location to another via communication lines
Communication link

Connects the processing flow on the same page; its usage avoids lines crisscrossing a page
On-page connector

An entry from, or an exit to, another page
Off-page connector

A beginning, end, or point of interruption in a process; also used to indicate an external party
Terminal
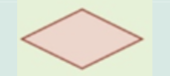
A decision-making step
Decision

Addition of descriptive comments or explanatory notes as clarification
Annotation
Document flowchart
shows the flow of documents and information among areas of responsibility in an organization.
System Flowchart
a pictorial representation of automated processes and files
Program Flowchart
illustrate the sequence of logical operations performed by a computer in executing a program.
Data Flow Diagram
graphically describes the flow of data within an organization.

The people and organizations that send data to and receive data from the system are represented by square boxes. Data destinations are also referred to as data sinks.
Data sources and destinations

The flow of data into or out of a process is represented by curved or straight lines with arrows.
Data flows

The processes that transform data from inputs to outputs are represented by circles. They are often referred to as bubbles.
Processes

The storage of data is represented by two horizontal lines.
Data stores
Context diagram
the highest level of DFD and provides a summary-level view of the system
What is a level one diagram?
A projection of a level 0 process
What is a level 0 diagram?
is a projection of the process on the context diagram. It is like opening up that process and looking inside to see how it works – to show the internal sub-processes
Flowcharts vs. DFD’s
DFDs place a heavy emphasis on the logical aspects of a system.
Flowcharts place more emphasis on the physical characteristics of the system.
What are the four threats to AIS
Natural and political disasters, software errors and equipments malfunctions, unintentional acts, intentional acts
Fraud
any and all means a person uses to gain an unfair advantage over another person.
Knowledgable insiders
are former and current employees and are much more likely to perpetrate frauds
Misappropriation of assets
Theft of company assets by employees. (includes physical and digital assets)
Fraudulent financial reporting
Intentional or reckless conduct, whether by act or omission, that results in materially misleading financial statements (e.g., booking fictitious revenue)
SAS Number. 99 (AU-C Section 240) requires auditors to:
Understand fraud
Discuss the risks of material fraudulent misstatements
Obtain information
Identify, assess, and respond to risks
Evaluate the results of their audit tests
Document and communicate findings
Incorporate a technology focus
What are the three conditions of fraud? (fraud triangle)
Pressure, Opportunity, and Rationalization