Ecology: Climate, Populations, Communities & Ecosystems Exam Review 3
 Call Kai
 Learn
 Practice Test
 Spaced Repetition
 Match
 Flashcards
 Knowt Play
1/49

There's no tags or description
Looks like no tags are added yet.
50 Terms
If an ecologist were examining how multiple populations of different species interact across a region and influence the exchange of materials between their environments, which of the following research scales would be most appropriate?
population ecology
How does Earth’s axial tilt and orbital position contribute to the greater seasonal variations in temperature and precipitation observed at middle to high latitudes compared to equatorial regions?
The tilt of Earth’s axis relative to its orbital plane causes solar radiation to fluctuate more significantly throughout the year at mid-latitudes
For mountain ranges that are subjected to prevailing winds, which of the following best explains why the climate is drier on the leeward (downwind) side?
Pushed by the prevailing winds on the windward side, air is forced to rise, cool, condense, and drop its precipitation, leaving drier air to descend the leeward side.
What is the key reason explaining why polar regions of Earth are cooler than the regions at the equator?
Solar radiation strikes the poles at a lower angle and travels through more atmosphere?
Coral reefs occur on the southeast coast of the United States, near Florida, but not at similar latitudes on the southwest coast near Los Angeles. Differences in which of the following most likely account for this?
water temperatures driven by ocean currents
Which type of biome is best defined by the following characteristics?
conifers are very prevalent, as well as pines and spruce trees
one of the largest biomes in terms of square kilometers of area
does not receive a lot of precipitation, but is still very moist because of the presence of permafrost
boreal forest

The figure depicts average temperatures and total precipitation across the 12 months of the year. Annual precipitation in Area 1 is approximately 260 cm, and in Area 2, 10 cm. Based on the data in the figures, which of the following statements is most consistent with the data?
Area 1 is near or in the tropics.
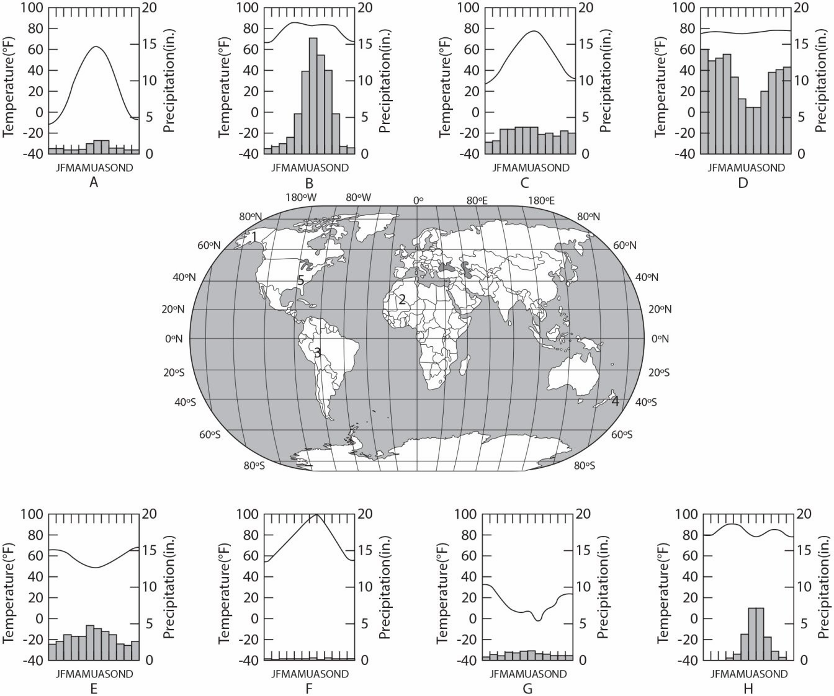
The eight panels below show average climatic values across the year on a monthly basis, as represented by first letter of each month depicted on the x-axis. Temperature values are depicted as a line graph and represented by the left vertical axis, while precipitation values are depicted as a bar graph and represented by the right vertical axis. Which panel (A-H) most likely depicts the climate for location 2 as shown on the map in the center panel?
panel letter F
Turnover of water in temperate lakes during the spring and fall is caused by which of the following?
the changes in the density of water as seasonal temperatures change
Which of the following statements best describes the different oceanic zones?
The benthic zone includes the ocean floor, consisting of rocks, sediment, and benthic organisms
A certain species of pine tree survives only in scattered locations at elevations above 2,800 meters in the western United States. To understand why this tree grows only in these specific places, an ecologist should:
investigate the various biotic and abiotic factors that are unique to high altitude
Which of the following examples demonstrates an ecological effect leading to an evolutionary effect?
A few individuals with denser fur than the population average survive the coldest years of an ice age, and the offspring of the reproducing survivors of the ice age will likely have more dense fur.
Which of the following biotic or abiotic factors limit(s) the range of Saguaro cactus in North America?
pollinators, precipitation, temperature, and sunlight
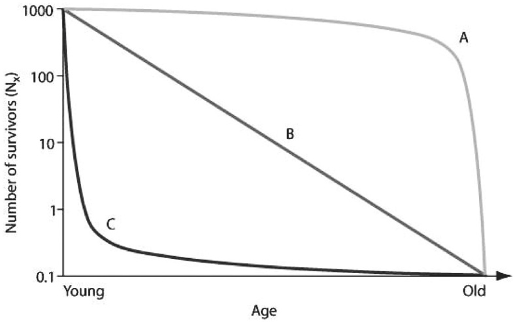
Which survivorship curve most closely models a population of mice in which females consistently give birth to a large number of offspring, and the mortality rate of the offspring is fairly regular during each year of their lives, regardless of their age?
curve B
Which of the following assumptions is applied when using the mark-recapture method to estimate population size?
The marked individuals have thoroughly mixed with the population after being marked.
To measure the population of lake trout in a 250-hectare lake, 500 individual trout were captured using nets and marked with a fin clip, then returned to the lake. The next week, the trout capture was repeated, and out of the 200 lake trout that were caught, 50 had fin clips. Using the mark-recapture estimate, the lake trout population size is predicted to be closest to which of the following?
2,000
In 2025, the United States Census Bureau reported the various components of population change as estimated below.
One birth every 9 seconds
One death every 9.4 seconds
One international migrant (net of immigrants versus emigrants) every 23 seconds
Net gain of one person every 21 seconds
Using the reported estimates from the United States Census Bureau for 2025, calculate the approximate net population growth for that year.
2.7 million people
In 2025, the United States Census Bureau reported the various components of population change as estimated below.
One birth every 9 seconds
One death every 9.4 seconds
One international migrant (net of immigrants versus emigrants) every 23 seconds
Net gain of one person every 21 seconds
In order to estimate the population growth rate (%) for that year, what other information would be required?
the estimated number of people living in the United States in 2025
Starting from a single individual, which estimate best predicts the size of a population of bacteria at the end of a 2-hour time period if they reproduce by binary fission every 10 minutes? (Assume unlimited resources and no mortality.)
4,096
Which of the following is accurate about a population exhibiting exponential growth?
It grows at its maximum per capita rate.
A species population’s size (N) may vary depending on a number of factors including crowding and resource limitation. As N approaches K (carrying capacity) for a certain population, which of the following outcomes is predicted by the logistic growth model?
The population growth rate will approach zero.
Which of the following causes populations to shift most quickly from an exponential to a logistic population growth model?
competition for resources
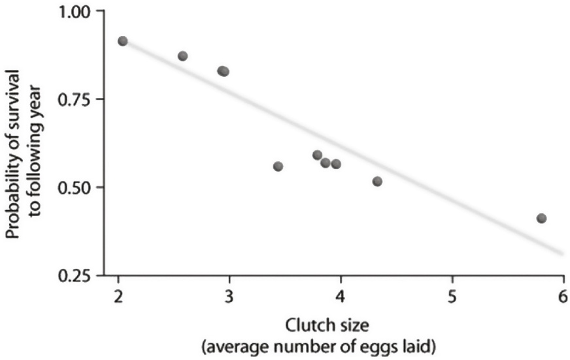
Which of the following hypotheses is most consistent with the data with respect to survival and clutch size?
Animals with low probability of survival the following year tend to have larger clutch sizes.

Which of the following claims can be best supported using the data?
Clutch size is inversely related to density.

Graph (in the figure shows the normal fluctuations of a population of grouse, a ground-nesting bird. Assuming graph (a) in the figure is the result of some experimental treatment in the grouse population, what can be concluded?
The experimental treatment has most likely identified the cause of population cycling.

Which hypothesis is most consistent with these data on hare and lynx populations in the graph?
Lynx likely control hare population density.
Some birds like woodcreepers and ovenbirds in the tropics follow moving swarms of army ants. As the ants march along the forest floor hunting insects and small vertebrates, birds follow behind and eat any insects or small vertebrates that had moved away from the ant swarm. Which of the following species interactions does this example demonstrate between the birds and the ants?
commensalism
If two species do not strongly compete with one another, and one species is experimentally removed from the ecosystem, which one of the following best describes how the remaining species would be expected to respond?
Utilize a broader range of resources and habitats that were previously limited.

Treehoppers (a type of insect) produce honeydew, which ants use for food. Treehoppers have a major predator, the jumping spider. Researchers hypothesized that the ants would protect the treehoppers from the spiders. During the first part of July, researchers found no difference between treehopper populations in any of their control and experimental groups. Which of the following measurements, if subsequently completed, would provide data to explain the researchers’ result?
Measure the relative abundance of jumping spiders.
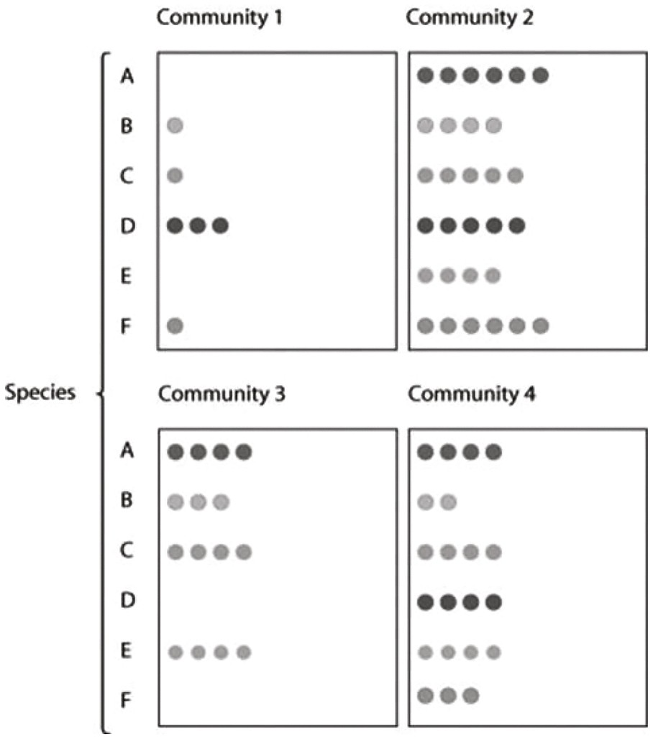
In the figure, species A through F are found among four communities, with the number of circles representing their abundance. Which community has the lowest diversity?
community 1
Approximately how much total biomass of plant material would hypothetically be necessary to support six carnivorous lions (whose diet consists only of herbivorous prey), each weighing 60 kg, living in a given area along with their prey, on an ongoing basis? (Assume a 10% efficiency in energy transfer.)
36,000 kg
According to bottom-up and top-down control models of community organization, which of the following expressions would imply that an increase in the size of a carnivore (C) population would negatively impact its prey (P) population, but not vice versa? In this particular scenario, the arrows between species indicate the direction of control between the populations of organisms
P ← C
Which description below is most consistent with the nonequilibrium model of community diversity?
communities are constantly changing after being influenced by disturbances
Which of the following best explains why there are more species in tropical regions than in locations more distant from the equator?
a longer time frame without disturbances for evolution and speciation

Use the following diagram of five islands formed at around the same time near a particular mainland, as well as the principles of MacArthur and Wilson’s island equilibrium model, to answer the question.
Which area would likely have the lowest extinction rate?
mainland
Which of the following studies would provide the most reliable evidence to understand the mechanism of spread of H5N1 virus from Asia to North America?
Perform anal or saliva smears of migrating waterfowl to monitor whether any infected birds show up in Alaska.

Which letter best represents a primary consumer in the community?
C & D
Which of the following behaviors results in keystone predators maintaining species diversity in a community?
prey on the community’s competitively dominant species
Five hypothetical forest communities, each have one hundred individuals distributed among four different tree species (W, X, Y, and Z). Which of the following combinations of species in a forest community would make it the most diverse?
25W, 25X, 25Y, 25Z
A research team introduces a population of invasive predatory owls to a previously undisturbed forested island. Over several decades, they observe that the island’s dense understory vegetation gradually declines, leading to a shift in ecosystem structure. Which of the following provides the most likely ecological explanation for this transformation?
The owls preyed upon herbivorous mammals that previously controlled fast-growing shrubs, leading to unchecked plant growth that altered the forest’s composition.
In a coastal salt marsh ecosystem, a researcher was examining how essential chemical components cycle between biotic and abiotic factors. These elements are continuously transformed and reused across different trophic levels, allowing the ecosystem to function efficiently. Which of the following best represents the primary categories of chemical substances that are cycled within the ecosystem?
the exchange of inorganic molecules like nitrogen, phosphorus, and carbon with organic compounds used in biological processes
Assuming it were technologically feasible, a scientist could hypothetically track the long-term fate (for example, 100 years) of every atom in a single molecule of carbon dioxide that initially moves from the air into a plant. This fact is a manifestation of which of the following physical laws?
conservation of mass

Food web for a particular terrestrial ecosystem (arrows represent energy flow, meaning arrows point from prey to predator, and numbers represent species)
In the food web, if species 3 is toxic to predators, then which species is most likely to benefit from being a mimic of species 3?
4
Which of the following statements about marine ecosystem productivity is the most accurate?
production in regions where there is higher micro- and macronutrient availability is highest
What advantage would there be for an ecosystem ecologist to measure net ecosystem production (N E P) instead of net primary production (NPP)?
N E P represents the amount of energy from light converted to chemical energy, minus the energy used by all organisms for cellular respiration, which could indicate whether or not carbon is being stored.
Owls eat rats, mice, shrews, and small birds. Assume that, over a period of time, an owl consumes 5,000 J of animal material. The owl loses 2,300 J in feces and owl pellets and uses 2,500 J for cellular respiration. Which of the following best estimates the production efficiency of this owl?
7.4%
Which of the following is a reason that a diet consisting primarily of fruits and vegetables results in a smaller ecological footprint than a diet high in meat content?
Eating meat is an inefficient way of acquiring photosynthetic productivity.

Based on information provided, which of the following represents the greatest flux of water from one reserve to another?
the ocean to the atmosphere
The discipline that applies ecological principles to returning degraded ecosystems to a more natural state is known as
restoration ecology
Which of the following is a reason that logged tropical rain forest soils typically have nutrient-poor soils?
Most of the nutrients in the ecosystem are removed in the harvested timber.