(3) Measurement properties 2 - Validity hypotheses p-value
 Call Kai
 Learn
Learn Practice Test
 Spaced Repetition
 Match
Match Flashcards
 Knowt Play
1/30

There's no tags or description
Looks like no tags are added yet.
Name | Mastery | Learn | Test | Matching | Spaced | Call with Kai | Chat |
|---|
No analytics yet
Send a link to your students to track their progress
31 Terms
⭐ 1A. Q: What does validity mean in a scientific study?
Validity describes how accurate and trustworthy a study’s results and conclusions are.
🔎 What this means:
A study with high validity gives results that are closer to the truth and can be trusted more.
💡 Think: Validity = “Can I trust this study’s answer?”
⭐ 1B. Q: How are systematic error, bias, and validity related?
Systematic error causes bias, and increasing bias decreases the validity of a study.
🔎 What this means:
Systematic error: something in the study was done wrong in a consistent way, i.e how subjects were selected or how something was measured
This creates bias, meaning the results are consistently pushed away from the truth.
More systematic error → more bias → lower validity.
Increasing the sample size does not fix systematic error.
💡 Think: Systematic error → bias → poor validity.
2. Q: What are the three major types of bias that can damage internal validity?
The three major types are selection bias, information bias, and confounding bias.
🔎 What this means:
Selection bias: a systematic error caused by how subjects are selected into the study
Information bias: a systematic error caused by incorrectly measuring or classifying information about subjects, such as their exposure, outcome, or other variables
Confounding bias: a distortion of the exposure-outcome relationship caused by another variable besides the exposure that explains part or most of the apparent association.
Your professor notes that a confounder can even reverse the apparent relationship
⭐ 3. Q: How do internal and external validity differ?
Internal validity asks whether the study's results are valid for the animals actually studied and their source population, while external validity asks whether those results can be generalized to another target population.
🔎 What this means:
Internal validity:
“Can I trust what happened inside this study?”
External validity:
“Can I apply these findings outside this study to the animals I care about?”
Bias in selection or measurement damages internal validity. Differences between the study population and the population you want to apply the results to can damage external validity.
Measurement properties 2 - Vali…
⭐ 4. Q: What is the difference between a target population, source population, and study sample?
The target population is the population investigators want to make conclusions about,
the source population is the population from which subjects can be selected, and
the study sample contains the subjects actually studied.
🔎 What this means:
Example from the notes:
Target: all U.S. dairy cows.
Source: cows from available Michigan herds.
Study sample: a specific farm in Michigan of cows selected and enrolled.
The closer the source population represents the target population, the better the potential generalizability.
⭐ 5. Q: What determines whether a study has good external validity or generalizability?
External validity is better when the source population and study sample adequately represent the target population to which the results will be applied.
6. Q: Why can increasing population diversity improve external validity while simply increasing sample size does not?
Enrolling animals from more varied populations can improve representativeness, whereas merely increasing the number of animals does not remove systematic bias or automatically improve validity.
In a piglet example, studying several farms with different:
locations,
sizes,
management systems,
may improve generalizability because the source population becomes more representative.
The benefit is not simply because n became larger.
⭐ 7. Q: What is precision or reliability, and how is it related to random error?
Precision or reliability describes how consistently repeated measurements give similar results; greater random error means lower precision.
🔎 What this means:
The lecture treats reliability and precision as closely related terms.
Random error is like noise in the system:
More random error → more scattered results → lower precision
Less random error → more consistent results → higher precision
Unlike systematic error, random error does not consistently push results in one direction.
💡 Think: Precision = how tightly the measurements cluster.
⭐ 8. Q: How does increasing sample size affect precision compared with validity?
Increasing sample size can reduce random error and improve precision, but it does not correct systematic error or improve validity.
🔎 Think of it this way:
Random error = wobbliness/scatter
Precision = consistency.
So when wobbliness goes up, consistency goes down.
More random error → less precision (consistency)
Less random error → more precision (consistency)
Precision ONLY asks:
“If I measure something again and again, do I keep getting about the same answer?”
It does not ask whether the answer is correct.
Systematic error = consistently being pushed the wrong direction
Validity = being close to the truth.
Lots of random error → bad precision.
Lots of systematic error → bad validity.
Increasing sample size gives you more observations, so unusually high and low values are more likely to balance each other out, giving you a more consistent average = reducing random error and improving precision.
But a larger sample does not fix a systematic problem in the study, so it does not improve validity. Because precision/consistency does not equal validity/truth.
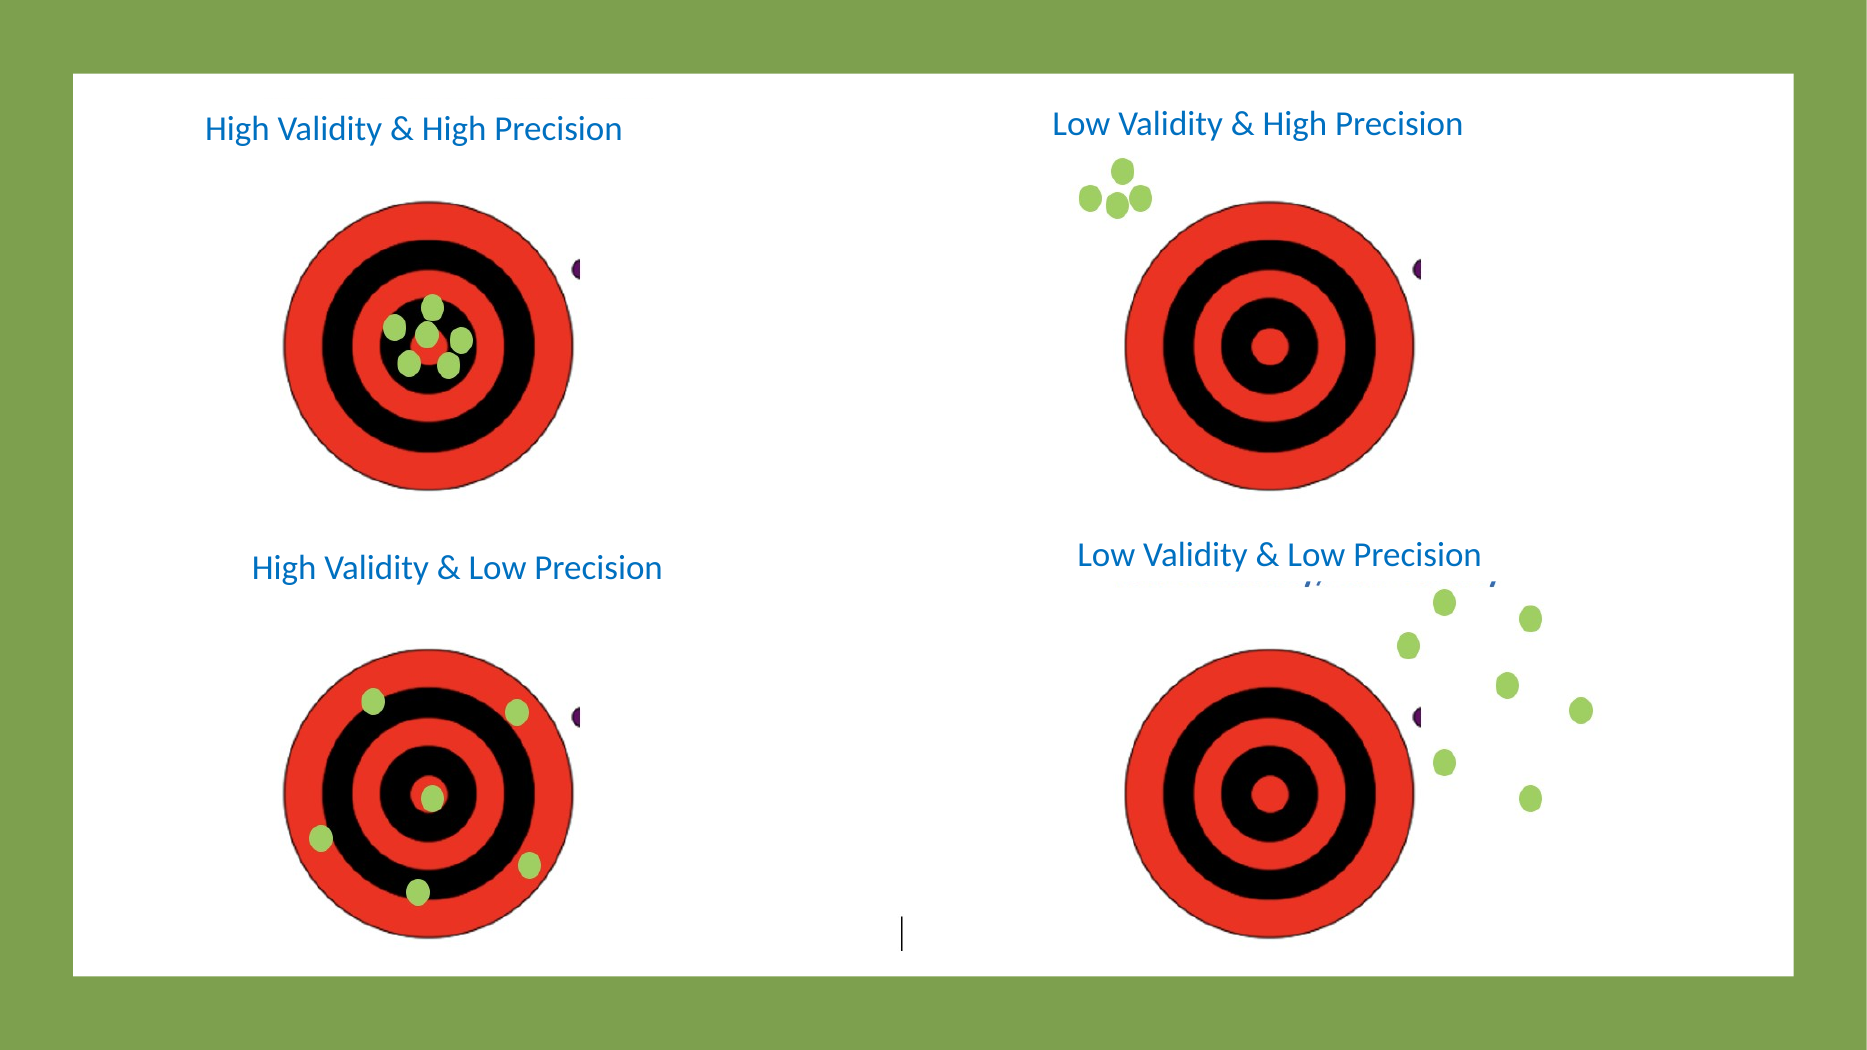
For example, you can consistently hit the edges of a dartboard, but it does not equate hitting the bullseye
⭐ 9. Q: What are the four possible combinations of validity and precision?
Results can have high validity and high precision,
high validity and low precision,
low validity and high precision, or
low validity and low precision.
🔎 What this means:
High validity + high precision: tightly grouped around the truth.
High validity + low precision: spread out, but centered around the truth on average.
Low validity + high precision: tightly grouped, but consistently away from the truth.
Low validity + low precision: scattered and away from the truth.
⭐ 10. Q: How should you evaluate possible bias when appraising the internal validity of a paper?
Evaluate how subjects were selected, how exposure and outcome were measured, whether confounding may exist, and whether the authors explain how bias may have been introduced or limited.
🔎 What this means:
The lecture emphasizes that internal validity depends on:
Selection of the study group
Measurement of exposure and outcome
Confounding
A useful paper should discuss where bias may have entered the study and what investigators did to reduce it.
11. Q: Does a study's position in the hierarchy of evidence automatically determine whether it is good evidence?
Review:
The hierarchy of evidence is the ranking of different types of studies based on how strong their evidence is. (Systematic/meta, then Randomized, then cohort, the case control and etc etc)
The answer is No. A study’s position in the hierarchy of evidence does not determine whether it is good evidence because it does not account for quality of study or validity.
A well-designed cohort study, for example may provide better evidence than a poorly designed randomized control trial
⭐ 12. Q: What questions should you ask to determine a study design?
First ask whether exposures or interventions are compared, then whether investigators assigned the exposure, and if the study is observational, determine how animals were enrolled.
Question 1: Did investigators assign an intervention?
Yes → controlled trial
Assigned randomly → randomized controlled trial
Question 2: Were animals already exposed or already experiencing the outcome?
Yes → observational study
Question 3: How were observational subjects enrolled?
By exposure → cohort
By outcome → case-control
By neither → cross-sectional
⭐ 13. Q: How are cohort, case-control, and cross-sectional studies distinguished by subject selection?
Cohort studies select based on exposure,
Case-control studies select based on outcome, and
Cross-sectional studies assess exposure and outcome at the same point in time without selecting by either.
🔎 What this means:
Cohort: exposure first → follow toward outcome.
Start with animals based on what they were exposed to, then see what happens to them
Case-control: outcome first → look backward for exposure
Start with animals based on what happened to them, then look backward and ask what they were exposed to
Cross-sectional: snapshot → exposure and outcome assessed together.
Take a snapshot right now and check both things at once.
Reminder:
Exposure = the thing you think might cause or affect something.
Outcome = what happens afterward that you care about.
Example: Does smoking cause lung cancer?
Exposure = smoking
Outcome = lung cancer
14. Q: Why can a disease or condition be either an exposure or an outcome?
Whether something is an exposure or outcome depends on the study question and sequence of events, not simply on whether it is a disease.
Exposure = the thing you think might cause or affect something.
Outcome = what happens afterward that you care about.
The lecture gives lameness as an example.
Lameness could be:
an outcome of flooring or the type of stairs, or
an exposure being investigated for later outcomes such as “could it be the cause of decreased milk production in cows?” and etc
15. Q: What is the purpose of inferential statistics?
Inferential statistics help determine whether an observed association or difference may represent a real effect rather than random variation.
⭐ 16. Q: How do the null and alternative hypotheses differ?
The null hypothesis states that there is no association, effect, or difference, while the alternative hypothesis states that an association, effect, or difference exists.
The statistical test is performed on the null hypothesis.
⭐ 17. Q: What would the null and alternative hypotheses be for a study asking whether calving difficulty is associated with metritis?
H₀: Calving difficulty has no association with developing metritis.
Hₐ: Calving difficulty is associated with developing metritis.
Metritis is acute inflammation/infection of the uterine wall, typically occurring after childbirth or abortion
⭐ 18. Q: How do non-directional alternative and directional hypotheses differ?
If an alternative hypothesis states: I think there is a difference
Then a non-directional alternative hypothesis says: I think they are different, but there is no direction
For example: Dogs on Diet A and Diet B have different lifespans
A non-directional hypothesis states they are not the same but not which is better or greater, aka it gives no direction
In a sense, the non-directional hypothesis says the groups differ without predicting which is greater/better in any direction
A directional alternative hypothesis on the other hand says: I think they are different, and I will predict which direction the difference goes
For example: Dogs on Diet A live longer than dogs on Diet B
This one says which group you expect to be better/greater/higher
A directional alternative hypothesis specifies the expected direction of the difference.
A non-directional alternative hypothesis predicts that groups differ without specifying how
⭐ 19. Q: What conclusions can a statistical test make about the null and alternative hypotheses?
A statistical test can only reject or fail to reject the null hypothesis
The alternative hypothesis is not tested directly.
If you reject the null hyp, then you “accept the alternative hyp”
If you fail to reject the null hyp, then you are “accepting the null hyp”
Its hella confusing ik
⭐ 20. Q: How do power, Type I error, Type II error, and confidence correspond to the four possible statistical outcomes?
Power is when a real difference from a study is correctly detected
Type I error (α) The study detected a difference that isn’t actually there
aka when there is really no difference but the test says there IS a difference
in other words, the test gave us a false alarm
a false positive
Type II error (β) There was a true difference but the study failed to detect it
aka the test missed something real/true
in other words, there really IS a difference, but the test falsely claims there is NO difference
a false negative
Confidence (1 − α):
There really is no difference → and the test correctly concludes no difference.

⭐ 21. Q: What does a p-value mean?
The confusing part is that a p-value asks a backwards question.
Suppose we’re comparing Treatment A vs Treatment B.
The null hypothesis says:
“There is no real difference between A and B.”
Now imagine your study finds a pretty big difference.
The p-value asks:
“Let’s pretend the null hypothesis is true and A and B are the same. How likely would it be, by random chance, that the difference is still this big?”
p = 0.01 → Results this extreme would happen only about 1% of the time if there really were no difference between treatment A and B.
p = 0.05 → Results this extreme would happen about 5% of the time if there really were no difference.
p = 0.10 → A little more unusual.
p = 0.50 → If there really were no difference between treatment A and B, results like this would not be very weird.
So when the p-value gets smaller, you start thinking:
“Hmm. These results would be really weird if the null hypothesis were true.”
Therefore:
Small p-value = evidence AGAINST the null hypothesis.
The p-value tells me how surprising my results would be if the null hypothesis is true
⭐ 22. Q: How should a p-value of 0.05 be interpreted?
If the null hypothesis were truly correct, results this extreme or more would occur in about 5% of repeated studies.
Is there an association between dietary factors and pancreatitis in dogs?
Which is the exposure and outcome in this question?
Exposure: Dietary factors
Outcome: Pancreatitis
Does poor teat conformation in dairy cows affect their risk of developing mastitis?
Which is the exposure and outcome in this question?
Exposure: poor teat conformation
Outcome: Developing mastitis
25. Q: When a study has high validity, which statement is correct?
A. Systematic error is high
B. Systematic error is low
C. Bias is high
D. Bias is very high
B. Systematic error is low.
🔎 What this means:
High validity corresponds to low systematic error and low bias.
26. Q: Precision is associated with which type of error?
A. Systematic error
B. Random error
C. Bias
D. None of the above
B. Precision is associated with random error.
🔎 What this means:
Greater random error produces more spread and therefore lower precision
27. Q: The validity of a study is related to which type of error?
A. Random error
B. Systematic error
C. No type of error
D. Both random and systematic error
E. It is not important when appraising studies
B. Validity is related to systematic error.
🔎 What this means:
Systematic error creates bias, which reduces validity.
28. Q: Can results from dogs with multicentric lymphoma treated at a large veterinary teaching hospital be easily extrapolated to dogs seen in a small primary-care practice?
A. Yes, because external validity is likely excellent
B. Primary-practice patients are likely similar to teaching-hospital patients
C. You never need to worry about extrapolation
D. No, external validity is likely not good
D. No, external validity is likely not good.
🔎 What this means:
Referral/teaching-hospital patients may differ from primary-care patients in:
Disease severity
Owner resources
Level of care
Breed, age, or other characteristics
Therefore, generalizability needs to be questioned.
29. Q: Which statement most accurately describes a Type II (β) error?
A. It indicates the magnitude of difference between groups.
B. It occurs when we conclude results are not different when they actually are.
C. It expresses the range over which error occurs.
D. It is the probability of finding a significant difference when one exists.
E. It occurs when we conclude outcomes differ when they actually do not.
B. A Type II error occurs when we conclude that there is no difference even though a true difference exists.
🔎 What this means:
This is a false negative:
A real effect exists → the study fails to detect it.
Option D describes power, not Type II error.
⭐ Q: What is a confidence interval?
A confidence interval is a range of values that gives an estimate of where the true population value is likely to lie, based on the study sample.
🔎 What this means:
You usually cannot measure the entire population, so you use your sample to estimate the true value.
For example, imagine you estimate that the average weight of a population of dogs is 30 kg, with a 95% confidence interval of 28–32 kg.
That interval tells you:
“Based on our sample, 28–32 kg is a reasonable range for the true population average.”
The width of the confidence interval also tells you about precision:
Narrow confidence interval → more precise estimate
Wide confidence interval → less precise estimate
💡 Think: Confidence interval = “My best estimate is here, but here is the range of uncertainty around it.”