Forensic Statistics AFTER MIDTERM
 Call Kai
 Learn
 Practice Test
 Spaced Repetition
 Match
 Flashcards
 Knowt Play
1/16

There's no tags or description
Looks like no tags are added yet.
17 Terms
Slope of linear regression
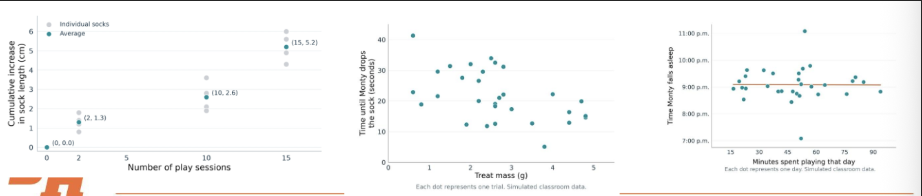
tells us how much additional stretching we predict per extra “session” (“independent trial”)
Simple Linear Regression
studies the relationship between a response variable (y) and a single explanatory variable (x)
describes the existence of a linear relationship between the two variables
a continuous response variable y and one quantitative explanatory variable x (might be continuous or discrete)
x = explanatory, independent, cause
y = response, dependent, effect

How do we choose the slope and intercept for simple linear regression?
we estimate the population parameters from our measurements
for any candidate: Residual = Observed Value - Predicted Value
we choose the intercept and slope that make the sum of squared residuals as small as possible = Least Squares

How do we calculate the slope and intercept of the best-fitting line for simple linear regression?
TOP = when play sessions are above average, is sock stretching also above average? The products measure the pattern
BOTTOM = measures how spread out the number of play sessions is
RATIO = gives slope

Equation for intercept in linear regression best-fitting line

Independence
errors from different observations are independent
checked mainly by looking at how we collected the data
Are observations linked or repeatedly measured?
Linearity
the mean response follows a straight-line relationship with x
checking residuals → curved = bad

Constant Variance
the spread around the regression line is similar across x

Heteroscedasticity
when the residual data resembles a funnel-shape; not a good fit!
when finding constant variance
Normality
errors are approximately normally distributed around zero — for the usual confidence intervals and tests
What does a scatterplot inform you about?
The form
The direction
The strength
all of the relationship between x and y
we can fit a line, but that doesn’t mean the relationship is strong
Pearson Correlation Coefficient, r
measure of the direction and strength of the linear relationship between 2 quantitative variables
+ = larger x tends to accompany larger y
- = larger x tends to accompany smaller y
NEAR 0 = little or no linear relationship
Coefficient of Determination (R²)
proportion of variation in y explained by the fitted regression model
for simple linear regression with an intercept, use the equation

Residual Standard Deviation (S)
describes the scatter remaining around the line, in the original units of y
sigma is estimated using the sample standard deviation (s)
for the case of simple linear regression = estimate of s² is the average squared residue
it describes the typical size of the differences between observed release times and the times predicted by our line

How do we do Linear Regression?
Define the question and variables → what are we predicting and what predictor are we using x
Plot the data → look at form, direction, strength, and outliers → can get R without a line
Fit the line using least squares → y = bo + b1x
Check the assumptions → study design, residual plots, and Q-Q plot
Assess the relationship & fit → correlation ®, R², and residual standard deviation (s)
Predict and express uncertainty → distinguish interpolation from extrapolation & report an appropriate interval
Interpolation
within our observed range
Extrapolation
outside our observed range