PSYC 379 Exam 2 Review
 Call Kai
 Learn
Learn Practice Test
 Spaced Repetition
 Match
Match Flashcards
 Knowt Play
1/67

There's no tags or description
Looks like no tags are added yet.
Name | Mastery | Learn | Test | Matching | Spaced | Call with Kai | Chat |
|---|
No analytics yet
Send a link to your students to track their progress
68 Terms
representative sample
How well does the sample represent/ is generalizable to the broader population?
generalizability
How well can we apply the results to people outside of the lab setting?
Depends on the nature of the sample, and if it’s representative
Also known as external validity
time sampling
Observing at specific times
Systematic: First day of the week
Random: 4 randomly selected 30 min. periods
behavior sampling
Seek samples by observing behavior during “events”
Birthday parties, PTA meetings, etc.
Can be infrequent (natural disasters) or long (conferences).
Provides real world context for observation.
count scale
How frequently something occurs within a specific unit of time
Special type of ratio scale
Can be analyzed similar to ratio or nominal data
reactivity
Changing your behavior because you know you’re being observed.
Can be controlled by researcher concealing behavior, getting participants to habituate to researchers presense,
observer bias
Systematic errors in observation from an observer’s expectations.
population
complete group of objects (people, nonhuman animals, institutions) from which a sample is drawn on and to which results can be generalized.
all students at UIUC

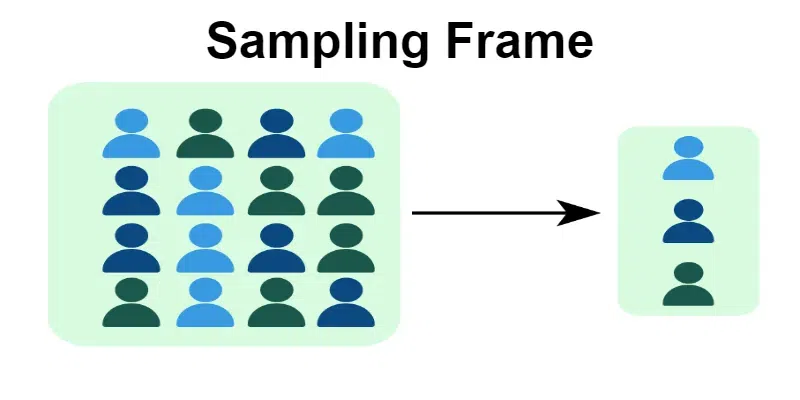
sampling frame
A complete list of all of the elements in a population (e.g., the electoral register)
should be representative of the target population as a whole
Helps operationalize terms
Official enrollment list at the university
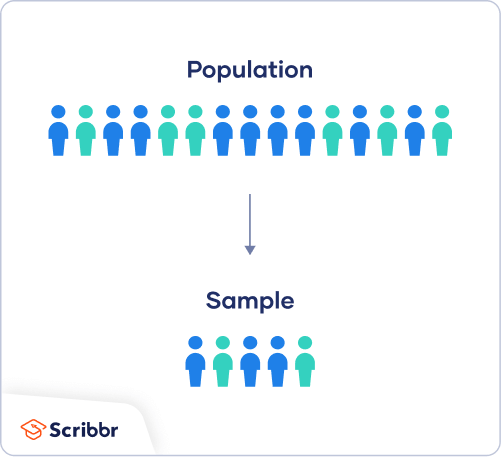
sample
a subset of a population of interest that is selected for study with the aim of making inferences to the population.
Important that sample is representative of the larger population.
Psych students at UIUC
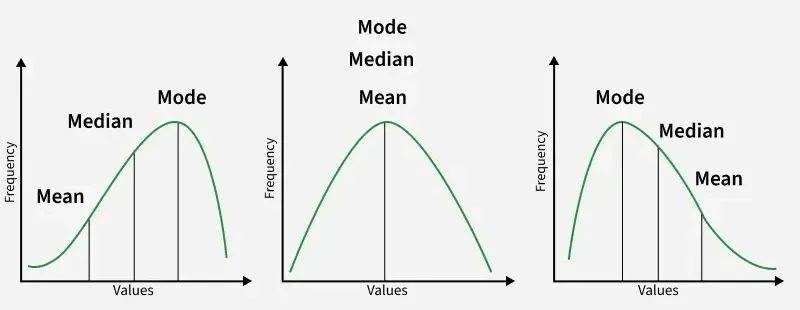
Mean, median, and mode can all be used as descriptions of these statistics..
element
a member of a set, class, or group.
Psychology students are a member of the college of LAS at UIUC
response rate bias
Individuals selected for the sample who don’t complete/return the survey
Those who complete the survey might be different from those who don’t

non probability sampling
The opposite of random sampling. Elements do not have an equal chance of getting selected.
simple random sample
All members of a population have equal chances of being selected.
Random selection of elements from pre-determined list.

successive independent samples design
A research method that involves observation of multiple random samples from a population over multiple time points.
internal consistency
Measure of reliability that checks that items are consistent with each other and are testing the same thing
Cronbach’s coefficient alpha
Cronbach’s coefficient alpha
Measure of internal consistency/reliability. How closely related items of a group are.
discriminant validity
Two measures that are NOT CORRELATED AT ALL.
Self esteem and height
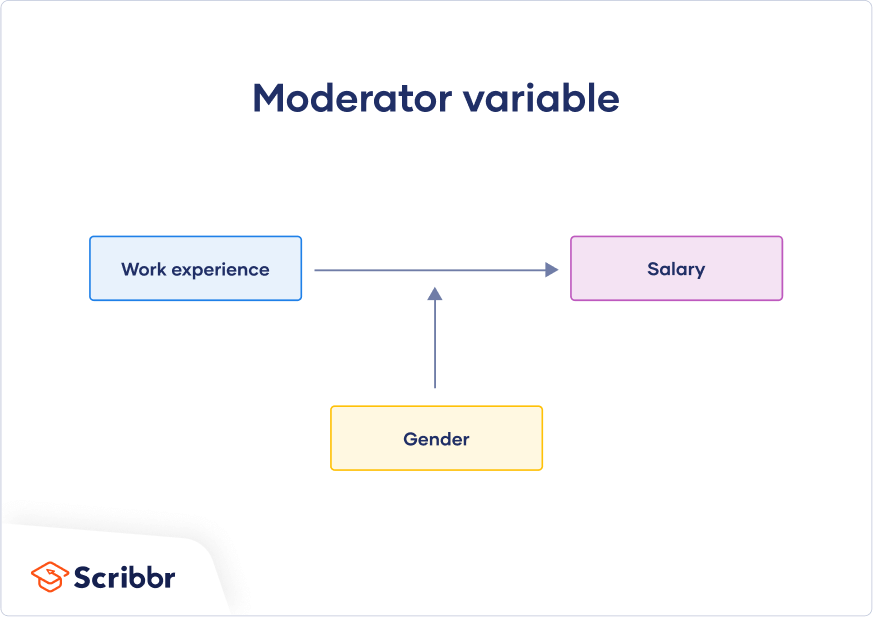
moderating variable
Variables that affect direction/strength of correlation between 2 variables.
For whom, under what conditions?
What if a specific relationship is not observed at all times?
What if the relationships between poverty, chaos, and psychological distress are not observed for all children?
external validity
How the results of the research/testing can be generalized beyond the sample
naturalistic observation
Researcher observes without attempts to change the situation.
Goal: Describe behavior as it normally occurs.

ordinal scale
Rank order behaviors and events
Who is rank 1st, 2nd, 3rd,
Can use less than or greater than
PROBLEMS
Distance between intervals may not be equal, creating unequal intervals (1st place finished in 2 seconds, 2nd in 3 hours
Can’t find averages.

ratio scale
Same as interval, except now there’s an absolute 0.
Does not apply to most psych research, because zero doesn’t really apply here
Examples: time, weight, age.

interobserver reliability
Do 2 or more observers agree in their observations?
Impacted by definition of events/behaviors, characteristics of observers.
For interval/ratio: correlation coefficient (for 2) or intraclass correlation (3 or more).

Demand characteristics
In an experiment, cues that may influence/bias participants behavior
Only doing something because that’s what you think the researcher wants you to do.
biased samplles
when characteristics of the sample differ systematically from the population
Can over/under represent segment of population
Knowing helps contextualize the sample.
selection bias
Procedures result in one or more segment of the population being over/underrepresented.
Exit polls of voters: non voters underrepresented.
convenience sampling
Any process for selecting a sample of individuals or cases that is neither random nor systematic but rather is governed by chance or ready availability.
Form of nonprobability sampling
Participants do not have equal chance

probability sampling
Sample of participants or cases is chosen from a larger group in such a way that each one has a known (or calculable) likelihood of being included
startified random
Divide population into subpopulations called strata, and then draw random samples from it.
Everyone in the strata has an equal chance of selection
Can be helpful for stratifying underrep. subpop.
However, might “oversample” harder to reach groups, making it not representative.
validity
“Truthfulness” of a measure. Does it measure what we’re trying to?
convergent validity
When the responses on one test/instrument is convergent with other measures
Self esteem/self esteem scale
mediating variable
Variables used to EXPLAIN correlation between 2 variables with a third variable
What third factor is responsible for this change?
Chaos is a mediating variable between poverty and psychological distress

cleaning data
Helps to get to know data better prior to analysis
Check for errors, such as missing or impossible values, outliers
Create summaries of your data using numbers, graphs, summaries
histogram
Helps summarize data which may help to identify
outliers
nonsense values,
Important clues about the distribution
descriptive statistics
Ways to summarize and describe your data, like the mean, median, range.
inferential statistics
Statistics used to test hypotheses, such as if an association is significant or if two groups are different on an outcome
• Correlation, t-test, ANOVA, linear regression
• Mediation/Moderation (next time)
• Phi Coefficient (next time)

null hypothesis testing
Start with a null and alternative hypothesis
find a t-test statistic that that will connect to p-value
Find the p-value
Null hypothesis
Two groups will not have different means (H0)
There is not an association between x and y

alternative hypothesis
Aligns with resarch hypothesis Two groups will have different means (Ha)
There is an association between x and y

t test statistic
Compares two means of data
Larger t value, smaller p value
Smaller the chance you would have observed your results if null hypothesis was true
p value
Probability to which data supports null hypothesis
Large t value, smaller p value
Smaller p value means that null should be rejected in favor of alternative
<.05, reject the null there is an association
p>.05, keep the null, there is no association

continuous variables
Numerical variables that can take on any value within a given range. Can be measured with tools such as rulers or stopwatches
Interval and ratio
Example: the time it takes to run a mile
Pearson correlation to find association

nominal scale
Used to classify behaviors, events, and characteristics into mutually exclusive categories
Either in one category or another, not both
Lowest level of measurement
Use phi coefficient and chi square
multiple linear regression
Examining association between multiple independent variables
categorical variables
Qualitative
Nominal ordinal
Spearman rank order correlation
Two fiind association, look at contingency table and compute phi

independent samples t test
Used to see if means are different between two independent groups
Psychology and chemistry majors
dependent samples t test
Used to see if means are different between two dependent groups
Measurement on the sample person, or closely linked participants such as couples/family.
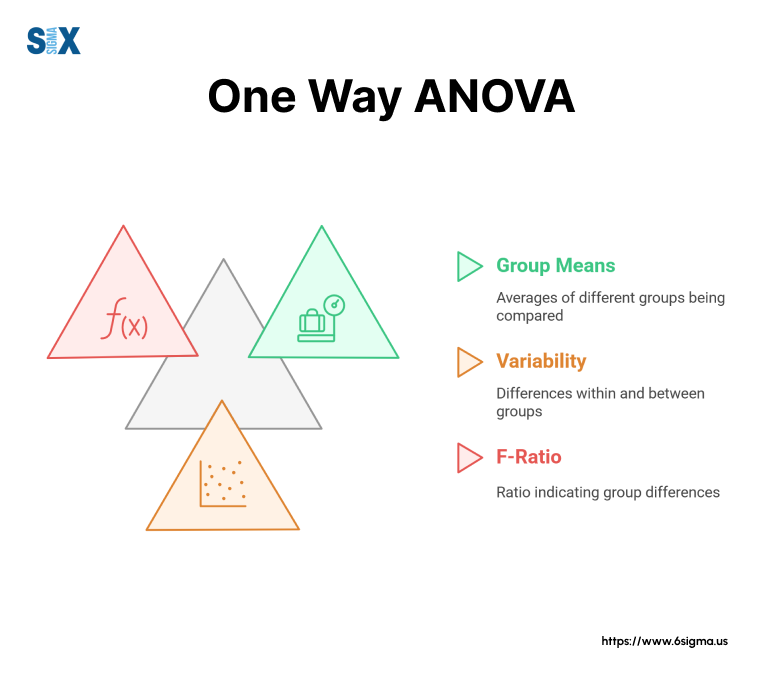
One way ANOVA
Used To see if means are different between three or more independent groups
young, middle aged, older adult.
contingency table
Shows the distrubution of one variable in rows and another in columns
Used to examine the relationship between 2 categorical/nominal variables

phi coefficient
Measure of association between 2 categorical variables can range from 0 (completely independent) to 1 (perfect association)
Like correlations, except ALWAYS POSITIVE
Helps with testing independence theories
chi square test
Describes different pattern of association if independent or dependent
Test use of balance observed/expected values to determine dependence (phi value)

participant observations
Observational method where observer actively participates in natural setting they are observing in.
Can be disguised (subjects are unaware of observation) or undisguised (people know they are being observed)
Challenges with reactivity, and impact of researcher on subjects

structured observation
Setting up a specific situation to observe behavior
Done when it’s hard to observe behavior naturally
Parent child interactions, selective attention gorilla test
Problems when observers do not follow the same procedures across observations

interval scale
Distance between points on a scale is assumed to be equal
Temperature
Advantages: Can find mean and standard deviation
Disadvantages: No absolute zero, so typing zero on a scale doesn’t mean anything.
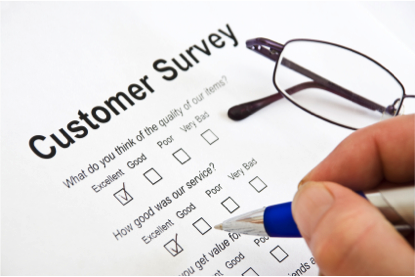
mail survey
Quick, convenient, self-administrated survey method. Best for personal/embarrassing topics
Challenges
Lots of people who receive won’t actually do it
Final sample may not be representative of pop
Little control over how survey is administered.
Costly
in person interviews
Survey method where researchers have more control over how survey is administered. Allows participants to ask questions, and interviewers to provide clarity
Challenges: Must have very trained interviewer, or else potential room for bias/interferance
telephone interview
Survey method where participants complete brief surveys over the phone. Essentially cold calling
Efficient, gives greater access to population
Problems: Some people may have trust issues with answering over the phone
internet surveys
Research method. Efficient, low cost, and gives potential to recruit large samples.
Can get very diverse/underrep. samples
Problems
Selection bias: Only people who have internet
Are respondents bots?
Lack of control over research environment

increasing response rate
Incentives:
Fixed: you will get a twenty dollar gift card
Or lottery
Personal touch
Reminds people a human made this
Interesting topic
Responding takes minimal effort

cross sectional design
Selected sample from a population at ONE TIME POINT. Choose population of interest, do probability/convenience sampling, and then respondents complete survey.
Snapshot look
Helps describe population, make predictions
Limitation: Can’t assess change over time. Need to make sure representative.

successive independent samples designs
Series of cross-sectional samples over time. Each sample comes from the same pop., but DIF. SAMPLE EVERY TIME
Helps study population at different points in time
Doing a study on incoming freshman each year.
Challenges: Can’t really tell a lot about individual or non comparable samples.

longitudinal design
SAME SAMPLE AT DIFFERENT POINTS IN TIME. Good for seeing how individuals change over time/
Problems: expensive/intensive, keeping people engaged over time
Attrition: dropping out of survey
Questionnaire reliability
Should be both reliable and valid. Can be improved by increasing number of good items, and having greater variability amongst individuals.
Test retest: Getting the same results every time
Internal consistency: Ideally over .75
Writing quesstionaires
Write clear and specific.
Don’t double barrel (have you eaten apples and oranges today?)
Have conditional phrases (IF this were to happen…)
No leading questions
Use opposite q’s to avoid response bias