HINF 5004 Common Figures
 Call Kai
 Learn
 Practice Test
 Spaced Repetition
 Match
 Flashcards
 Knowt Play
1/42

There's no tags or description
Looks like no tags are added yet.
43 Terms
Conceptual model (causal diagram)
LOOKS LIKE: Boxes for exposure, outcome, common causes and mechanisms, joined by arrows and laid out in time order (e.g., Prior engagement → Portal activation and → 6-month HbA1c). PURPOSE: A provisional map of the study's logic that exposes assumptions, timing and backdoor paths (E ← C → Y) before you choose adjustment variables. It is not proof.
Response distribution (bar chart of ordered categories)
LOOKS LIKE: One bar per Likert category in order (Very difficult → Very easy), y-axis = number of respondents, denominator stated (n = 100). PURPOSE: Shows the full spread of ordinal answers that a single mean would hide.

Correlation and agreement plot (Bland & Altman idea)
LOOKS LIKE: Paired readings from a device and a reference method, plotted against each other or as connected pairs, with the difference (device − reference) labeled. PURPOSE: Shows that a perfect correlation (r = 1) can coexist with a constant bias (+2 every time). Interchangeability needs an acceptable difference, not just a high r.

2×2 table
LOOKS LIKE: A grid with test result (positive/negative) or exposure as rows and true condition or outcome as columns, with four cells (TP, FP, FN, TN or a, b, c, d) and row/column totals. PURPOSE: The base for sensitivity, specificity, PPV, NPV, risk, odds, RR and OR. Always show the margins and the threshold.

ROC curve
LOOKS LIKE: A curve of sensitivity (true-positive rate, y) against false-positive rate (1 − specificity, x), one point per threshold, rising from (0,0) to (1,1), with a diagonal chance line. PURPOSE: Shows the sensitivity–specificity trade-off across all thresholds. AUROC summarizes ranking (discrimination). It says nothing about accuracy at your chosen threshold or about calibration.

Forest plot (meta-analysis / risk ratios)
LOOKS LIKE: One row per study. A square marks the estimate (its area is proportional to the inverse-variance weight), a horizontal line shows the 95% CI, a diamond shows the pooled estimate, and a vertical null line sits at 1 on a log scale. PURPOSE: Compares effect estimates and their uncertainty across studies and gives a pooled result.

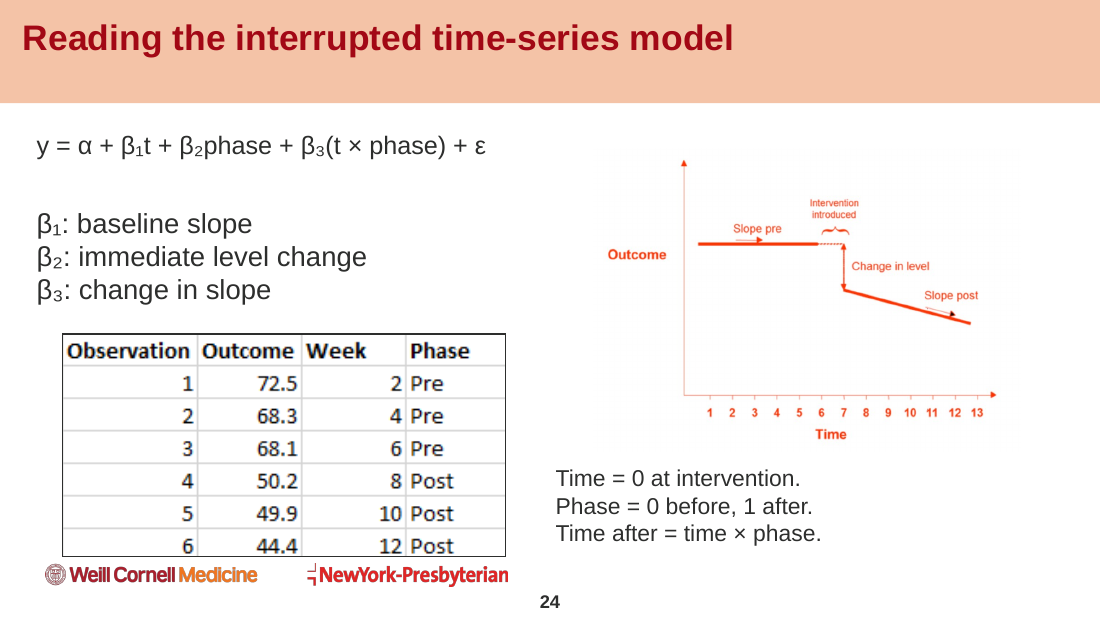
Interrupted time series (ITS) plot
LOOKS LIKE: Repeated outcome measurements over time, with a vertical line at a clearly timed intervention. Separate fitted lines before and after show any jump (level change) and any change in steepness (slope change). PURPOSE: Tests whether the outcome departed from the projected pre-intervention trend. Stronger than a simple pre-post comparison.
Joint display
LOOKS LIKE: A table with columns Numerical finding | Interview finding | Combined interpretation | Next check. PURPOSE: In mixed methods, it lines up quantitative and qualitative evidence so the integration step can be inspected. Interviews suggest explanations but do not prove the mechanism.
C01 · Counts and rates (two-panel bar chart)
LOOKS LIKE: Two side-by-side horizontal bar panels, one with missed-appointment COUNTS and one with missed/scheduled PERCENTAGES by clinic, with n labeled. PURPOSE: Shows that the clinic with the most missed visits may not have the highest missed rate. Keep the denominator visible.
C02 · Bar baselines and dot plots
LOOKS LIKE: The same three rates (11%, 12%, 13%) drawn as truncated bars, as zero-baseline bars, and as dots on a labeled narrow axis. PURPOSE: Bar length encodes magnitude, so bars must start at zero. A truncated baseline exaggerates small differences. Use dots (position, not length) for a focused narrow-range comparison.
C03 · Histogram
LOOKS LIKE: Adjacent bars over bins of a quantitative variable (e.g., wait in days), bar height = count per bin, often with a median line. Shown with 6, 15 and 35 bins. PURPOSE: Shows distribution shape, skew and tail. Bin width changes the look, so report the features that persist across bin choices.
C04 · ECDF (empirical cumulative distribution function)
LOOKS LIKE: A rising step curve from 0 to 1, x = value (wait days), y = fraction of observations at or below that value, one curve per clinic, with a threshold line (e.g., 14 days). PURPOSE: Answers threshold questions such as 'What fraction waits ≤ 14 days?' with no bins or smoothing. It is NOT a survival or Kaplan–Meier curve.
C05 · Boxplot with individual observations
LOOKS LIKE: A box from the 25th to the 75th percentile (IQR), a median line, whiskers to the furthest observed values within 1.5 × IQR, and jittered raw points plus n per group. PURPOSE: Compares distributions across groups while showing sample size, skew and unusual points. A distant point is not automatically an error.
C06 · Violin plot
LOOKS LIKE: A mirrored, smoothed density shape for each group (like a violin), with the median and n marked. PURPOSE: Reveals skew or multiple peaks that a boxplot hides. Width is estimated density, not a count, and the bandwidth (e.g., 0.25 vs 0.60) changes which peaks appear.
C07 · Scatterplot
LOOKS LIKE: One point per observation, x = one quantitative variable (wait), y = another (experience score), with color and shape by group and transparency for overlap. PURPOSE: Shows the relationship between two quantitative variables. Report the included n and exclusions, and write a descriptive, non-causal caption.
C08 · Time-series small multiples
LOOKS LIKE: A row of small line-chart panels, one per clinic, with months in calendar order on shared axes and a visible GAP for an unreported month. PURPOSE: Shows change over time within each group. Lines require an ordered axis, and connecting across a missing month invents information.
C09 · Heatmap
LOOKS LIKE: A grid with rows = clinics and columns = months. Cell color shows the value (median wait) on one shared color scale with a colorbar, missing cells in gray, and optional numbers in the cells. PURPOSE: Summarizes a matrix to spot high/low combinations. Trajectories are easier to read in small multiples.
C10 · Mean estimates with confidence intervals (point-and-interval plot)
LOOKS LIKE: One dot per group (the mean) with a horizontal line for its 95% t confidence interval, and n beside each label. PURPOSE: Shows how PRECISELY each mean is estimated, not patient-to-patient variability. Overlapping group CIs are not a test of the difference.
C11 · SD versus CI (two-panel interval plot)
LOOKS LIKE: Two panels with the same means and axes. One shows mean ± 1 SD, the other mean with a 95% CI (the CI is much narrower). PURPOSE: SD describes spread of individuals, while the CI describes uncertainty about the mean. Every interval must be labeled; 'error bar' alone is not enough.
C12 · Paired observations (preserve pairing)
LOOKS LIKE: Left panel: each patient's before and after scores as two dots joined by a line. Right panel: histogram of the after-minus-before changes. PURPOSE: Keeps each person's own change visible, so patients who moved in the opposite direction are not hidden by the group average. Before–after alone is not causal.
E01 · Boxplot plus jittered scores (worked solution)
LOOKS LIKE: A boxplot per clinic with jittered experience scores (0–100) overlaid and respondent n labeled. PURPOSE: Compares score distributions. The denominator is RESPONDING attendees, not all appointments, so the plot cannot describe nonrespondents or a causal clinic effect.
C01 · Sunburst
LOOKS LIKE: Concentric rings read from the center out. The center is the root (all encounters), the inner ring is the parent level (setting), and the outer ring is the child level (disposition). Each sector's angle shows its count within its parent. PURPOSE: Shows how a whole breaks down into NESTED categories. Use a bar chart for precise ranking, and say which denominator you mean (parent share vs root share).
C02 · Sankey diagram
LOOKS LIKE: Left-to-right columns of nodes (stages/states) joined by ribbons (links). Ribbon WIDTH = the count moving from one state to the next (e.g., referral → scheduled → completed → treatment), with terminal branches for losses. PURPOSE: Shows weighted FLOWS between stages. Internal nodes must balance (inflow = outflow), and summing all links recounts people.
C01 · Case-by-code evidence matrix
LOOKS LIKE: A binary heatmap grid with rows = participants and columns = qualitative code categories. A filled cell means at least one coded segment exists (repeats count once). PURPOSE: Compares evidence across cases while staying traceable to the excerpts. An empty cell means 'not recorded', not 'never experienced', and frequency ≠ importance.
C02 · Stacked task-outcome bars
LOOKS LIKE: One horizontal bar per interface condition (baseline vs revised), split into segments for unassisted success, assisted completion and failure, out of 12 attempts. PURPOSE: Shows effectiveness and need for help together while keeping ALL attempts, including failures. It cannot show individual transitions.
C03 · Paired task-time dot plot
LOOKS LIKE: For each participant, two dots (baseline and revised task time) on a common time axis, joined by a line. PURPOSE: Shows the direction and size of each person's change. It includes only people with unassisted success in BOTH conditions (6 of 12), so it is a conditional efficiency view. Keep the failures in the outcome chart.
Kaplan–Meier (KM) curve
LOOKS LIKE: A downward STEP curve of estimated event-free probability (y, 0–1) against time since a stated origin (x). It steps down at events, has tick/plus marks at censoring times, has shaded pointwise 95% CI bands, and has a number-at-risk table below. PURPOSE: Estimates the cohort's probability of remaining event-free over time while handling right-censoring. Censoring shrinks the risk set but causes no step. Do not trust a late plateau with few at risk.
Risk table (number at risk)
LOOKS LIKE: Rows of counts under a KM plot, one row per group, aligned with selected times (e.g., 40, 22, 13, 6, 0). PURPOSE: Shows how much information supports each part of the curve, with a stated before/after convention. The count can fall without a step (censoring).
Censoring mistake comparison (KM vs naive curves)
LOOKS LIKE: The same 40 people plotted three ways: the KM curve, a curve that drops too fast (WRONG: every last contact treated as an event), and a curve that stays too high (WRONG: censored people event-free forever). PURPOSE: Shows that mishandling censoring distorts the curve. Only KM uses the changing risk sets.
Swimmer plot
LOOKS LIKE: One horizontal lane (bar) per patient from a common time zero. Thick segments show response or treatment intervals, and distinct symbols mark events (progression/death), censoring, adverse events, and arrows for ongoing at cutoff. PURPOSE: Shows INDIVIDUAL histories and timing. It cannot estimate population survival. Disclose selection and ordering (longest-only overstates durability), and give a legend that defines intervals and markers.
Graph / network (node-link diagram)
LOOKS LIKE: Circles (nodes = entities such as clinicians, proteins or patients) joined by lines or arrows (edges = relationships). Arrows show direction, and line width can show weight (e.g., confidence). PURPOSE: Shows entities and how they connect. Define what a node and an edge mean, whether edges are directed or weighted, and which records were eligible.
Graph layouts (force-directed / spring, hierarchy, measured space)
LOOKS LIKE: The SAME nodes and edges drawn in different positions: force-directed/spring (connected nodes pulled together), hierarchy/tree (levels for parent–child), or measured space (real x-y coordinates such as tissue). PURPOSE: Layout is a display choice. In force-directed layouts, distance has no unit, so save the seed and coordinates.
Adjacency matrix
LOOKS LIKE: A square grid with every node as both a row and a column. 1 = edge, 0 = no edge (or color/weight). It is symmetric for undirected graphs, and row sums = degree. PURPOSE: Shows the same graph as a node-link diagram but supports exact pairwise lookups and dense graphs. It is harder for tracing paths.
Filtered graph (before vs after a cutoff)
LOOKS LIKE: Two node-link panels: the full weighted graph, and the graph after removing edges below a threshold (e.g., confidence ≥ 0.80). PURPOSE: Shows that filtering changes the evidence. Removing the 0.55 C–D bridge splits 1 component into 2, and the betweenness of C and D drops from 0.60 to 0.
Community view (colored partition)
LOOKS LIKE: A node-link diagram with nodes colored by group or community membership. PURPOSE: Summarizes densely connected clusters. Membership depends on the algorithm and its settings and needs scientific interpretation.
Node size encoding (degree vs score)
LOOKS LIKE: A network where node AREA is scaled by a measure, e.g., degree (PACE) or a predicted Z score (Dou/NETTAG), with layout and edges kept fixed. PURPOSE: Highlights important nodes. Always say what size measures, because 'largest node = best target' is not supported without experimental and clinical evidence.
Bipartite view
LOOKS LIKE: Two columns of nodes of different types (e.g., ligands on the left, receptors on the right) with edges only BETWEEN the columns. PURPOSE: Shows relationships between two kinds of entities (drug–target, ligand–receptor). A top-ranked subset omits other pairs.
Confusion matrix
LOOKS LIKE: A 2×2 colored grid of predicted vs actual class (No readmit / Readmit) with counts in each cell. PURPOSE: Shows errors at ONE threshold (e.g., 0.15 vs 0.50 gives very different sensitivity). Always report the threshold with sensitivity, specificity and PPV.
Precision–recall (PR) curve
LOOKS LIKE: A curve with precision (PPV) on y against recall (sensitivity) on x across thresholds, and a horizontal no-skill line at the PREVALENCE (e.g., 0.19, not 0.5). Summarized by average precision. PURPOSE: Shows ranking performance when the outcome is uncommon. Pair it with ROC.
Calibration (reliability) curve
LOOKS LIKE: Mean predicted risk (x) against observed event rate (y) in bins, with a 45° diagonal for perfect calibration and a histogram of predictions underneath. PURPOSE: Asks whether a predicted 30% risk really means 30%. A model can rank well (good AUROC) yet be badly miscalibrated.
Decision curve
LOOKS LIKE: Net benefit (y) against threshold probability (x), with one line per model plus reference lines for 'treat all' and 'treat none' (0). PURPOSE: Asks whether ACTING on the model helps across clinically plausible thresholds. Net benefit = TP/n − FP/n × pₜ/(1 − pₜ).
Permutation importance plot
LOOKS LIKE: Horizontal boxplots, one per feature, sorted, showing the drop in AUROC when that feature is shuffled (e.g., 30 repeats). PURPOSE: Shows which features the MODEL relies on. It describes model behavior, not biology or causation.
SHAP beeswarm plot
LOOKS LIKE: One row per feature with a dot per patient, spread along the x-axis by SHAP value (push toward a higher or lower prediction) and colored by feature value (low = blue, high = red/orange). PURPOSE: Shows how each feature shifts individual predictions relative to a baseline. It explains the model, not causal effects.