PSY 133 Exam 2 Study Guide
 Note
Note Call Kai
 Learn
Learn Practice Test
 Spaced Repetition
 Match
Match Flashcards
 Knowt Play
1/55

There's no tags or description
Looks like no tags are added yet.
Name | Mastery | Learn | Test | Matching | Spaced | Call with Kai | Chat |
|---|
No analytics yet
Send a link to your students to track their progress
56 Terms
Be able to define validity theoretically and mathematically
Theoretically: the extent to which inferences drawn from an instrument are correct
Mathematically: observed score is X= T+e T= portion of score that is consistent
X= V (valid part) + I (irrelevant part) + e
T= V+E
Correction for Attenuation
> used to estimate what the correlation would have been if the variables had been perfectly reliable
>What is the formula for perfect reliability?
r’xy = rxy/(√rxx)(√ryy)
Formula for more reliable
r’xy = rxy(√rxxnewryynew)/(√rxx)(√ryy)
What is range restriction, and how does it affect correlation coefficients
when there is restricted range of variation in scores, resulting in small changes in scores resulting in much larger differences in correlations or rankings
Content Validity
evidence that the content of a test representing the domains its supposed to be representing
Used to find items representative of domain or cover bases. Often used in achievement tests or licensing
Methods of determining content validity
Lawshe: Content Validity Ratio
Compute CVR for each item
CVR= (nessessary – nunnessesary)/ntotalraters
Compute CVR for test (content validity index)
CVI= SCVR/nitems
Face Validity
How the test appears to test takers as relating to its purpose. Good for wanting to keep them on track, make them feel confident, bad if exam’s purpose is for someone to not know whats being tested like a depression or bipolar screening or something.
Construct Validity
observed correlations between the test and other measures provide evidence for the meaning of the test
Process of development: hypothesis testing, developing nomological network
Process: accumulate evidence/data about what construct test measure
Nomological network:
Refers to the network of concepts that the test relates to and doesn’t relate to internal, experimental, correlational data (criterion related, discriminant, convergent, factor analysis with varimax rotation)
Correlation data
referring to convergent and discriminant validity.
Convergent evidence
looking if measures that measure same construct are more highly inter correlated
Discriminant evidence
measures that demonstrate a test measures something different from what other available measures are testing (aka what it does that others can’t)
Criterion-Related Validity
how well a test corresponds with a particular criterion
Predictive validity evidence
the evidence for the criterion validity where the test forecasts scores on a critieron in the future (ex: ACT and future GPA)
Concurrent validity evidence
Evidence for criterion validity where the test and criterion are administer at the same point in time
characteristics of good criteria
deficiency, contamination, relevance
Contamination
stuff picked up on criterion that is irrelevant
Deficiency
The performance area not tapped into by criterion (what the criterion neglects to include)
Relevance
the overlap between conceptual and actual criterion
why is it important to have good criteria
Having good criteria minimizes contamination and deficiency. You also might get poorer validity or reliability if your criteria are bad.
Indices of criterion related validity
better decision making than w/o test
Better decisions than other devices
Must be stable and generalizable
Must provide utility
Level (single reliability) ——-> .4 is strong
Group differences
known group validity
Predicted groups
does the test distinguish between who has a disorder or who does not
How is a regression equation used for validity coefficients
To make a prediction accurately
cross-validation
We use it to not lose predictive value (aka prevent shrinkage)
Standard Error of Estimate
68% = image
change 1 to 2 to get 95%
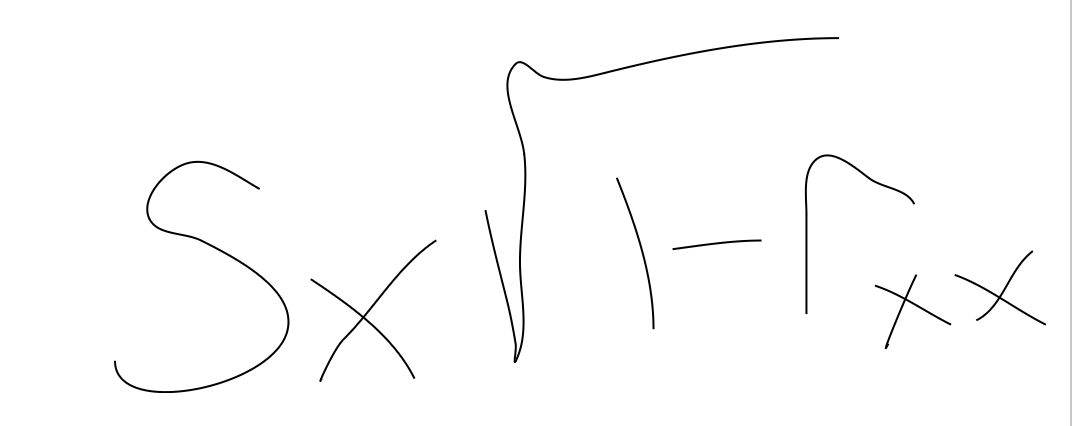
What factors can affect level of validity
Unreliability in measure
Sample characteristics
Range restriction
Base rate
Selection ratio
validity generalization
the extent to which we can generalize validity coefficients across situations
Interpreting validity coefficients
need to consider Utility = Benefit – Cost
What is an appropriate validity level
Level is going to matter by context but usually rxx=.4 raw is acceptable
what is Utility
the cost- benefit
does the cost outweigh the benefits? If yes, no utility.
True positives
have trait, trait detected
False positives
do not have trait, trait detected
True negatives
do not have trait, no trait detected
False Negatives
have trait, not detected
Total Hits
(True positives + true negatives )/ (total)
Positive Hits
(True positives) / (true positives + false positives)
Base Rate
(true positives + false negatives) / (total)
Selection ratio
(true psoitives + false positives)/(total)
he relationships between validity, base rate, selection ratio
Higher validity –hit more accurate decisions
Misses are very small the more valid your data is
Selection ratio should be higher than base rate if valid
Taylor-Russell tables
tables that show the ratio of hits/accurate decisions based on level of validity
If a test is useful, it will result in better decisions
how does incremental validity play a part in decisions about test use?
How much added validity is explained by adding a new predictor.
If not getting more info with a new predictor, its not necessary.
Test Bias
form of systematic error, Consists of subgroup differences in test score implications that are not the result of real different in a measured characteristics
Content bias
issues based on the content of a test. 2 people w/ same abilities will have different scores
Internal structure
issues with internal structure of an exam
Testing environment
different environments creating bias during examination
Prediction Bias
Differential prediction and differential validity
Differential prediction
Think of prediction/regression lines predicting different outcomes for different groups (example in class: gender and ACT score). think BEST FITTING LINE
Differential Validity
The extent to which a test has different meanings for different groups of people, think 2 regression line scores, both with rxx above 0, but significantly different from EACHOTHER. think MAGNITUDE
Stereotype Threat
Stereotyped group preforms to stereotype under certain conditions
Harms performance on exams
Especially if it is important or the difference between groups is made noticeable.
methods of reducing stereotype threat
Minimize test importance
Minimize group differences
Indicate no difference in performance across groups
Methods of trying to reduce bias and their effectiveness
Change testing
Culture specific tests
Intelligence tests created to cater to specific cultures. Created because different cultures emphasized different things and performed differently on exams
Culture-reduced testing
Creation of tests that are mostly absent of cultural influence (mostly, because none really achieved 100%)
Specific tests
Raven's Progressive Matrices
- Cattell's Culture Fair Test of Intelligence
What is the SOMPA system
Change testing conditions
Consider tests within context
Change environment (SES)