chap 2 - cognitive neuroscience methodology
 Call Kai
 Learn
Learn Practice Test
 Spaced Repetition
 Match
Match Flashcards
 Knowt Play
1/16

There's no tags or description
Looks like no tags are added yet.
Name | Mastery | Learn | Test | Matching | Spaced | Call with Kai | Chat |
|---|
No analytics yet
Send a link to your students to track their progress
17 Terms
Structural vs. Functional Brain Imaging
Structural Brain Imaging:
Visualize anatomical structure of the brain
i.e., size, specific regions, tumors
Functional Brain Imaging:
Visualize active processes in the brain
(e.g., neural activity, blood flow)
visualizing pathways
Spatial Resolution
Amount of detail you can see in the image
structural imaging:
Amount of neuroanatomical detail you can see
↳ ex: distinguish gray from white matter
functional imaging:
Precision with which you can localize activation to specific brain regions
↳ ex: how precisely can you identify the region
Temporal (“timing”) Resolution
Relevant for functional imaging (and single-cell recording)
Refers to the precision with which you can localize brain activation to a specific point in time → when in time, did the brain activity occured
Poor temporal resolution –minutes
Good temporal resolution –milliseconds
Single-cell recording
Record neural activity directly.
Place a thin electrode in or near a neuron (invasive).
Count the number of action potentials per second.
Determine which experimental manipulations change the neural response.
How is the spatial & temporal resolution?
spatial → excellent because you know exactly which neuron is firing
temporal → excellent bc record changes right at the neuron
insert into neuron (sometimes group) & record activity
limited to animals bc its so invasive

ex:
Record action potentials per second during a delayed-matching task in a monkey
wm task
have to retain info in wm
saw more activity in DLPFC
more neuron firing

C(A)T: Computed Axial Tomography

Basically an “x-ray absorption map”
Different tissues absorb different amounts of x-ray radiation → look different on the image
bone is highly dense & absorbs lots of radiation → why very white
CSF is low dense → why black bc not rlly absorbing radiation
brain matter is in the middle (density-wise) → why has intermediate color
poor spatial resolution (compared to MRI)
can’t see a lot of anatomical detail
Less expensive than MRI
More often used in clinical settings (than in research)
ex: ct scans
Can use CT scans to identify lesion (dead tissue) sites (and areas of overlap) in stroke patients
stroke → certain parts weren’t getting blood/oxygen so they died

Magnetic Resonance Imaging (MRI)

A structural MRI is basically a “proton density map”
Different tissues have different proton densities and look different on the map
protons → normally in the form of water in biological life
tissues then have different amounts of water
How is the proton density map created?
Protons have magnetic properties
These magnetic properties are measured by the scanner
Tissues with different proton densities have different magnetic properties → appear different on an MRI image
measuring different magnetic properties
What are some advantages of MRI over CT?
more detailed
better spatial resolution
can identify specific brain regions
answer more specific anatomical questions
doesn’t involve any radiation
have fMRI & uses same machine

Ex MRI:
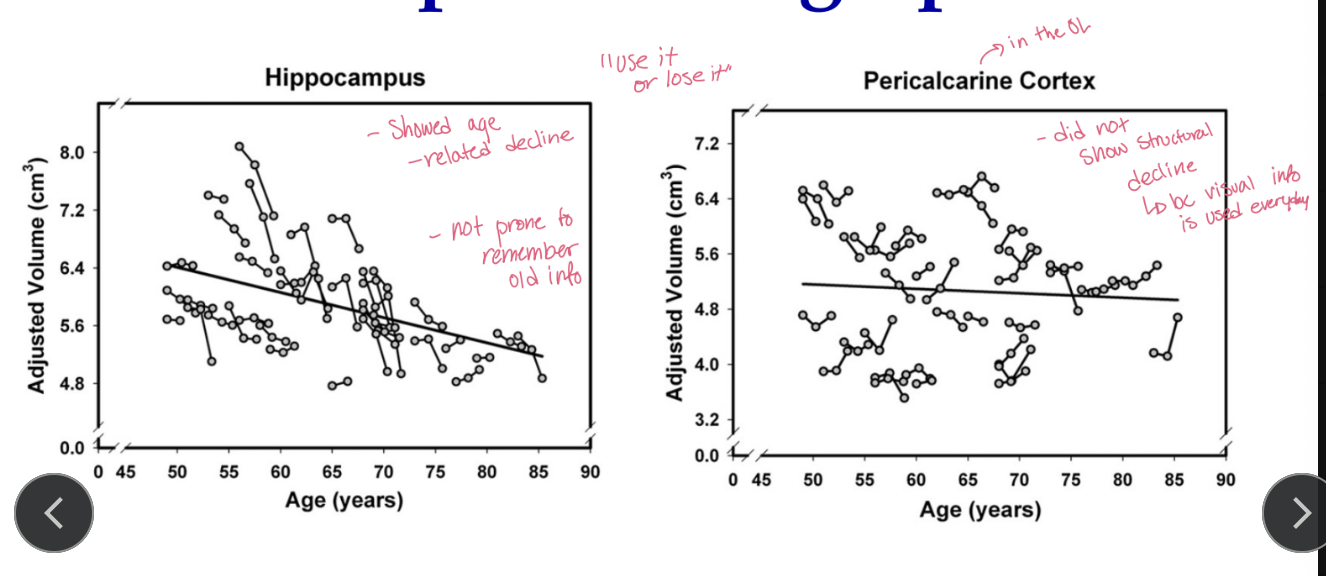
Raz et al. (2010) used MRI to assess regional changes in structural volume of different brain regions with increasing age
Ex MRI (Graphs):
Different brain regions showed different structural volume trajectories over time
hippocampus:
showed age-related decline
not pront to remember old info
pericalcarine cortex (in the OL)
did not show structural decline → bc visual info is used everyday
“use it or lose it”
Diffusion Tensor Imaging (DTI)
Method to measure white matter tract
Myelinated axons have a lipid boundary so water must diffuse along length of axon rather than in any direction
have lipid bilayer → water can’t diffuse normally
diffusion of water must follow path of axon
still use MRI machine

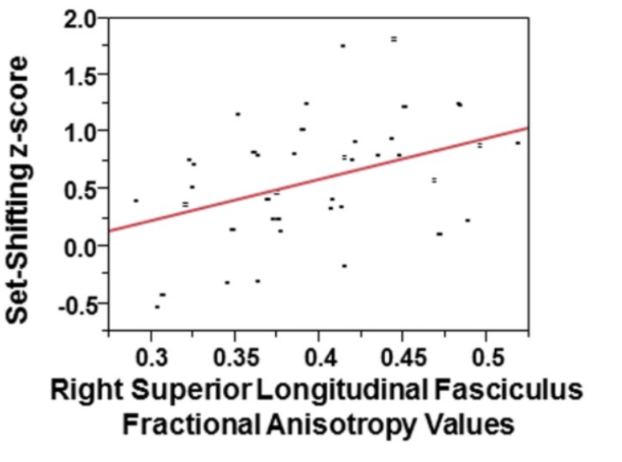
Example: Diffusion Tensor Imaging (DTI)
Related the microstructural integrity of the superior longitudinal fasciculus (“white matter tract”) to neuropsychological performance in adolescents

Example: Diffusion Tensor Imaging (DTI) (graph)
Greater microstructural integrity of the superior longitudinal fasciculus was related to better set-shifting (executive control)
when water is diffusing in a concentrated direction → more myelinated axon
relate white matter integrity of SLF in EF task → being used in task
“Active” Brain Regions
The whole brain is always active
some regions may be used more
Neuroimaging activation maps display the relative differences in brain activity between two or more conditions
e.g., compare baseline to visual stimulus
subtracting
Regions showing greater relative activity during a particular cognitive task are labeled with an arbitrary color
PET: Positron Emission Tomography

A PET image is basically a “blood flow map”
Areas with more active neurons receive more oxygenated blood
Poor spatial resolution (compared to fMRI)
Worst temporal resolution of functional techniques (compared to fMRI and to EEG/ERP)
How is the blood flow map created?
radioactive substance injected into bloodstream
Substance travels to brain; Radioactivity measured by detectors around the head
Areas where there is more blood flow (i.e. areas of the brain that are more active) emit more radioactivity
Can be used to measure:
resting brain activity
brain activity associated with doing a specific task
levels of substances in the brain (e.g., neurotransmitters, proteins) that bind to radioactive tracers
what its normally used for
for: dopamine, amyloid, tau
only technique to do it
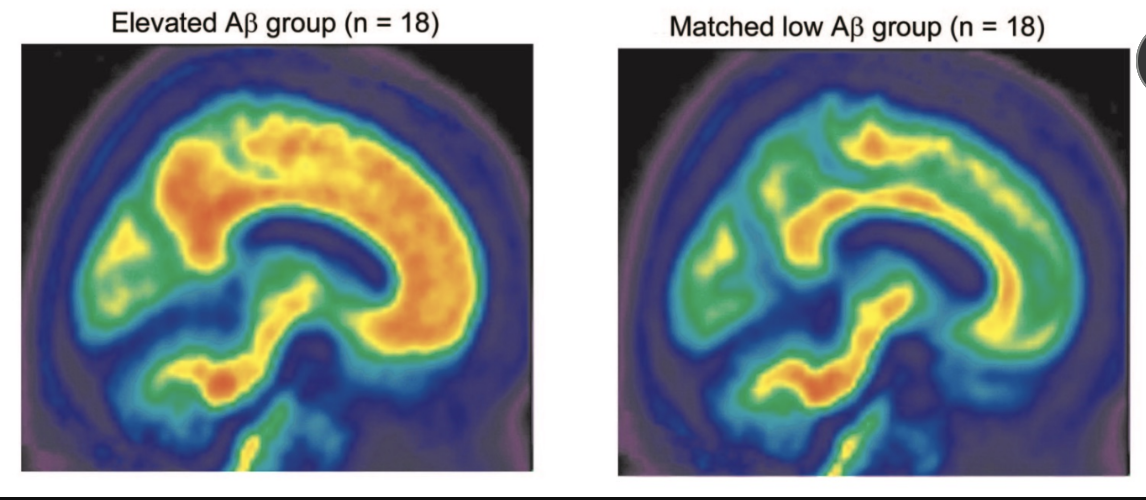
Example: PET
Rodrigue et al. (2012) used PET to assess the deposition of amyloid plaques (protein-related to alzheimer) in middle-aged and older adults (w/o alzheimer’s)
then assess cognition
more amyloud = worse cognitive performance
fMRI: Functional Magnetic Resonance Imaging

Colored areas = Functional image
Functional data overlaid on a structural MRI (black & white)
or atlas image
doesn’t show structure → that's why overlapped to then distinguish
A fMRI image is basically a “blood oxygenation level map”
More oxygenated blood in regions of increased neural activity
neurons need more oxygen bc they were active
Oxygenated blood has different magnetic properties than de-oxygenated blood (comparing)
Measure the Blood Oxygen Level Dependent (BOLD) response
Used to measure brain activity associated with doing a specific task or during resting state
fMRI
no task is being performed
can compare across different populations to see what area tend to be
Best spatial resolution of all functional techniques (compared with PET)
Good temporal resolution (compared with PET)
~ 2 sec
Example: fMRI
Nee et al. (2007) identified brain regions associated with performing a directed forgetting task
intentional forgetting
Left DLPFC → more active when performing task

How does fMRI work? Blood Oxygen Level Dependent (BOLD) signal

increased neural activity
increased blood flow (to area)
comparing:
baseline
active
surplus of freshly oxygenated blood
oxy-deoxyhemoglobin ratio increases
increased BOLD signal
DV = BOLD response → indicator of more active areas
Interpreting the BOLD signal:
Regions activated in fMRI experiments are associated with a task.
Correlational
we can infer, not conclude
tends to be active
but may not be essential →
However, they may NOT be ESSENTIAL for performing that task
Thus, lesion methods are needed to determine whether a brain region makes an ESSENTIAL contribution to performing a task.
i.e., w/ a stroke
(naturally occuring)
when area is damaged, what happens?
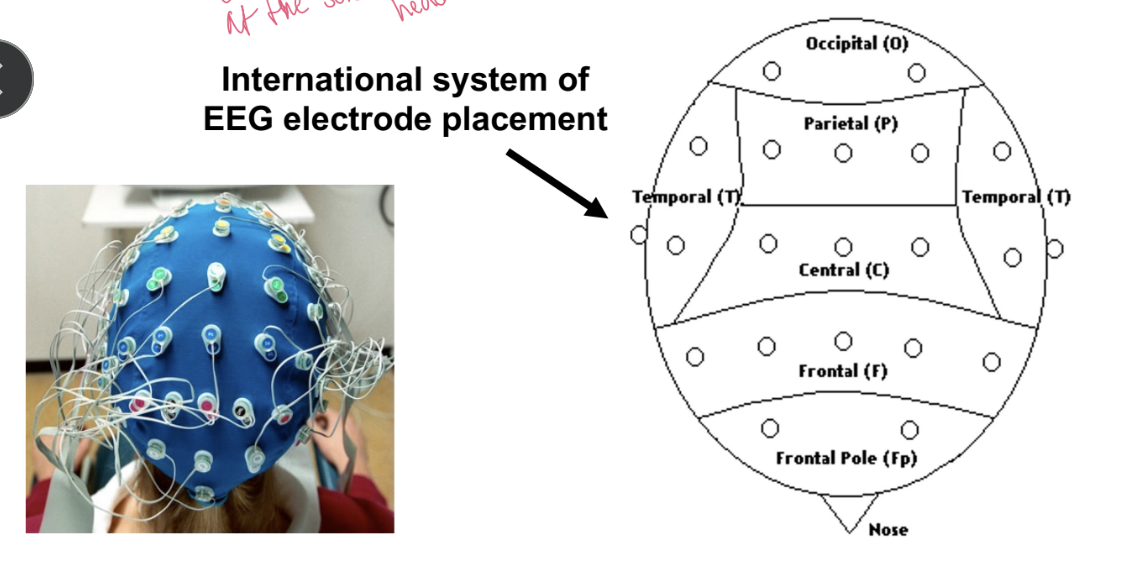
EEG: Electroencephalography
Electrical potentials recorded by electrodes placed on the scalp
measuring electrical signals (activity) at the surface of the head
has BEST temporal resolution
mapping electrical activity of the brain
mapping electrical activity of the brain
“brain”
ERP: Event-Related Potentials
Measures neural activity related to a particular event
An event can be a sensory stimulus, movement, etc.
uses EEG
patterns of electrical activity related to a specific event
normally repeated → to get avg. of pattern
Example ERP:
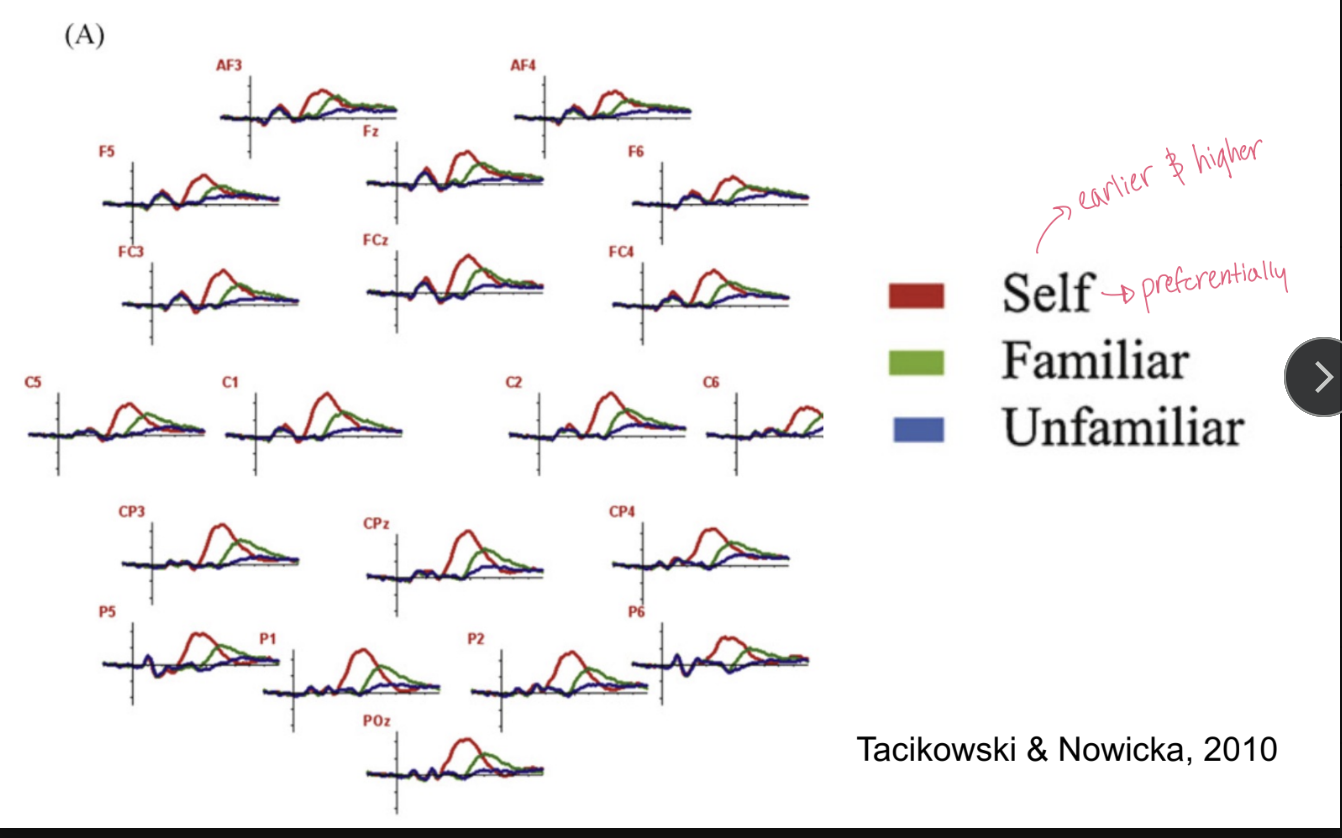
Do people preferentially attend to their own name or face?
Measured ERPs to onset of their own, famous, or unknown names/faces
Examined attentional P300 ERP component
signature of electrical activity
Example ERP: Name ERPs
self: earlier & higher freq.; preferentially
ERP has the best temporal resolution of all of the neuroimaging techniques
use most with timing question
ERP has the worst spatial resolution of all of the neuroimaging techniques
don’t know which brain regions were active to produce the electrical activity
don’t know specificially
ERP vs. fMRI/PET
ERP is good for figuring out the timecourse of cognitive events
fMRI (and PET) are good for understanding where in the brain these cognitive events occur
“When vs. where”
Transcranial Magnetic Stimulation (TMS)
Pulses of electromagnetic field from coil induce an electric field in the brain
not imaging technique
Can either:
Excite the cortex (induce movement, sensation, etc.)
trigger activation
single-pulse TMS
Or disturb its function (temporary “lesion”)
repetitive TMS
temporarily making it inactive
good for not relying on natural occuring
help answer cause & effect question
how does this effect performance

Example: TMS
TMS of the left IFG and posterior middle temporal gyrus impaired gesture-speech integration
overall: disrupted performance
reduction in IFG & pMTG
only able to TMS cortical areas
not subcortical
