Chapter 6: Perform the Analysis: Descriptive Analytics
 Call Kai
 Learn
Learn Practice Test
 Spaced Repetition
 Match
Match Flashcards
 Knowt Play
1/30

There's no tags or description
Looks like no tags are added yet.
Name | Mastery | Learn | Test | Matching | Spaced | Call with Kai | Chat |
|---|
No analytics yet
Send a link to your students to track their progress
31 Terms
Descriptive analytics addresses the questions
“What happened?” or “What is happening?
Descriptive analytics are analytics performed that
characterizes, summarizes, and organizes features and properties of the data to facilitate understanding.
To be useful to decision makers, accounting needs to be both
relevant and faithfully represent the substance of what occurred.
This is consistent with what descriptive analytics attempts to provide to the many current and potential users of accounting data.
Accounting data for descriptive analytics can be found in many places.
Balance Sheet.
Income Statement.
Statement of Cash Flows.
Statement of Stockholders’ Equity.
Footnotes.
10/K Filing.
Descriptive analytics techniques help to summarize data.
Mean, Median, Mode
Minimums, Maximums
Standard Deviation
Quartiles/Deciles
Counts
Totals, Sums, Subtotals
Mean, Median, Mode
What is the average employee salary?
What is the average stock market return over the past five years?
Minimums, Maximums
What was the largest sales refund given last month?
Standard Deviation
What is the standard deviation of the company’s stock price over the last quarter?
Quartiles/Deciles
What quartile is Ford in based on its leverage compared to the automobile industry as a whole?
Counts
How many sales transactions did we have last year?
Totals, Sums, Subtotals
What is net income each year for the past four years?
Descriptive analytics can be presented visually. 1
Graphs (Bar Charts)
Percentage Change
PivotTables
Ratio Analysis
Vertical Analysis
Horizontal Analysis
Graphs (Bar Charts)
The change in revenue from one period to the next might be best shown with a bar chart.
Percentage Change
What is the percentage increase in sales, general and administrative expenses from last year to this year?
PivotTables
What is the total profitability of each customer or each inventory item?
Histogram
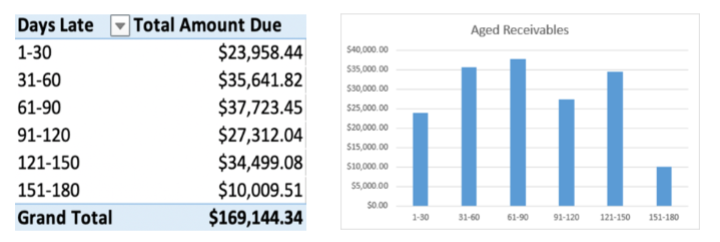
What is the total aged receivables in each 30-day bucket?
Ratio Analysis
The computation of the debt-to- equity ratio as a measure of solvency.
Vertical Analysis
The comparison of interest expense in relation to net sales revenue from one period to the next.
Horizontal Analysis
What is the percentage increase in accounts receivable from the prior balance to the current balance sheet?

Start with a simple table

Present it as a bar graph.
Show aged receivables using PivotTables
and PivotCharts.
Horizontal analysis show
trends over time.
Horizontal analysis provides
comparative increases about various line items of each financial statement over time

Horizontal analysis uses percentage change using this formula:
(New − Old)/Old
where old is the prior year or period and new is the current year or period.
Vertical analysis show
relationships between accounts.
Vertical analysis expresses
financial information in relation to some relevant figure, or base.
For example, on an income statement, the relevant base would be net sales revenue.
On a balance sheet, the relevant base for a balance sheet line item would be total assets.

The DuPont analysis shows the result of
multiple ratios.
Disaggregation of Return on Equity (ROE) into three component parts, including profit margin, asset turnover and financial leverage, in this way:
Return on Equity (ROE)
= Profit Margin × Asset Turnover × Financial Leverage
= (Net profit/sales) × (Sales/Total Assets) × (Total Assets/Equity)
Descriptive analytics are the first step to
identifying phenomena.
Descriptive analytics are used to ask
follow-up questions.
Descriptive analytics leads to additional questions:
Why would this be?
Did managers make this happen?
Do managers not like small losses? Do they prefer small gains?
Do managers use the flexibility within accounting standards to make earnings higher (or lower) than the expected? If they do manage earnings, how do they do that?
What incentives do they have to manage earnings up or down? To maximize bonus? To maintain a string of positive earnings?
A summary of descriptive analytics
Descriptive: Summarize
