03 the force- velocity relation and fibre types
 Call Kai
 Learn
 Practice Test
 Spaced Repetition
 Match
 Flashcards
 Knowt Play
1/19

There's no tags or description
Looks like no tags are added yet.
20 Terms
What factors determine human muscle fibre type distribution according to the slide?
Genetics: Fibre type distribution is partly genetically determined.
Short-term: Short-term shifts in fibre type are possible through training.
Long-term: Scientific studies for longer periods are currently missing
Why is zero force (F = 0) at maximum shortening velocity (vmax) a theoretical laboratory condition, and why do real-life movements always have F > 0?
Laboratory Condition (In Vitro): Tested on isolated single muscle fibers with zero attached external load/mass. All internal energy is consumed by shortening the tissue itself, leaving zero external force output (F = 0).
Real-Life Movement (In Vivo): Muscles must always overcome and accelerate the mass of limb segments or body parts (e.g., arm, torso in push-ups). Because mass is always present, human movements always operate at F > 0 (and thus P > 0), never reaching the absolute unloaded boundary of vmax
Question: What fundamental biological constraint is introduced on according to the "Force-velocity relation"?
Core Topic: The mechanical relationship between the force (F) a muscle can generate and the velocity (v) at which it shortens or lengthens
Fundamental Trade-off: Represents an active speed-strength limit: a muscle cannot generate maximum force and maximum velocity simultaneously
How was Archibald V. Hill's (1938) isotonic release experiment conducted, and what parameters were measured?
Experimental Setup: An isolated muscle is attached to a lever system with an adjustable stop (Hub-Einsteller), an attached load, and an electromagnetic release mechanism (Release-Mechanik)
The last = external load mass is the last the muscle is pulling against
Procedure: Electrical stimulation activates the muscle until it reaches maximum isometric force (F0). The release mechanism then suddenly frees the lever to a lower load (F1)
Measurements: A revolving drum (kymograph) records the rapid force drop (∆ F) and length change (∆ l) over time to calculate shortening velocity (v = ∆l/∆t)
If their is on the left side a low mass last → muscle contract fast = high velocity

What do the two lower diagrams on the "Hills experiment" slide illustrate regarding tendon compliance and extension (∆ l SE)?
Left Graph (Compliance vs. Force): At low forces, the series elastic element (SE / tendon & aponeurosis) exhibits high compliance (it is soft/flexible). As muscle force increases, compliance drops sharply (the tendon becomes rigid/stiff)
Right Graph (Force vs. ∆ l SE Extension): Shows the non-linear, exponential force-extension curve of tendons. At higher forces, progressively greater force is required to produce incremental tendon stretching (∆ l SE)


How are the axes defined on the picture, where is the isometric contraction point located, and which exercise examples represent v = 0?
X-axis: Normalized contraction velocity (v/vmax)
Y-axis (left / primary): Normalized muscle force (F/F0 or T/T0), where 1.0 equals maximum isometric force (F0)
Y-axis (right / secondary): Normalized mechanical power (T x v/T0 x vmax) for the red power curve
Isometric Point: located at the Y-intercept (v=0, F/F0 = 1.0). Muscle length remains constant
Lecture Example: Planking or Bavarian beer mug holding (Bierkrugstemmen): maximum isometric force (F0), zero movement velocity (v=0), zero mechanical power (P=0)
How do concentric and eccentric force outputs differ, and why does concentric force drop to zero at vmax?
Concentric (v > 0, Right): Muscle shortens. Force drops hyperbolically even at small contraction speeds
Eccentric (v < 0, Left): Muscle is forced to lengthen under load; force rises above isometric capacity to 1.4-1.8 • F0
Drop at vmax: At maximum shortening velocity (vmax), filaments slide so fast that myosin cross-bridges cannot detach, cock, and reattach quickly enough to build tension, dropping net force to zero (F = 0)
Bei Isometrie (v = 0) ist die Kraft maximal, aber die mechanische Leistung ist null!

What does the upper blue line dictate at the force-velocity relation diagramm , and can a muscle operate outside of it?
Upper Bound Envelope: Represents the maximum physical force limit of the muscle at 100% activation (a = 1.0)
Constraint: A muscle can never operate above/outside this blue curve. It operates on the line during maximal activation or below it during submaximal activation (a < 1.0)
How is mechanical muscle power derived from work and duration?
Work (W): Generated by force along a displacement (W = ∫ F dl)
Power (P): Work generated in a unit of duration (P = work/duration = ∫ F dl/dt (distance/duration)
Derivation: Since velocity v = dl/dt, mechanical power simplifies to P = F • v

Why is mechanical power P = 0 at both boundary ends, where is peak power achieved, and how do bicycle gears illustrate this?
At v = 0(Isometric): P = F0•0 =0 (High force, zero movement = zero power)
At v = vmax (Max Speed): P = 0 • vmax = 0 (Max speed, zero load = zero power)
Peak Power (Pmax): Forms an inverted U-curve (red line), peaking at approx. 30% vmax and 30% F0
Bicycle Gears Example:
High gear uphill: High pedaling force (F → F0), cadence stalls (v → 0) → Power drops to zero
Very low gear: High cadence (v → vmax), zero resistance (F → 0) → Power drops to zero
Optimal gear: Matches the sweet spot (~ 30%) for maximum mechanical power output
How does the 3D surface model unify the force-length and force-velocity relationships?
Unification: Combines the Force-Length curve (Gordon et al., 1966) and the Force-Velocity curve (Hill, 1938) into a single 3D state space (Lieber, 2010 / Uchida & Delp, 2021)
Cross-Sections:
Slice at constant velocity (v^M = 0) → yields the classic Force-Length curve
Slice at constant length (l^M = 1) → yields the Force-Velocity curve

How does neural activation (a) scale the 3D force-length-velocity surface across the four diagrams?
Neural Drive: The nervous system controls muscle force through motor unit recruitment and firing rates, modeled by muscle activation (a € [0, 1.0])
At a = 0: Completely relaxed muscle → surface is entirely flat (0 N force capacity)
Scaling (a = 0 → 0.33 → 0.67 → 1.0): Increasing neural drive scales the height of the entire 3D surface upwards, expanding the muscle's maximal force capacity envelope across all lengths and speeds

How are Slow-Twitch (ST) and Fast-Twitch (FT) fibres distinguished in histological preparation?
Slow-Twitch (ST): Stained blue ("ST - blau") → many mitochondria; tiny; dense network of capillaries (to ensure the oxygen supply for the aerobic metabolism)
Fast-Twitch (FT): Stained yellow/brown ("FT - gelb/braun") → less mitochondria; big; low capillarity (in their immediate vicinity)
How does hypertrophy affect appearance according to st and ft fibres?
Hypertrophy Effect: Hypertrophy increases individual fibre cross-sectional area (thickness). If ST fibres enlarge, the histological section shows a larger relative area of blue.
Which fibre type transitions are easy vs. hard?
Type IIX <—> Type IIA (Easy/Fast): Shifts within fast-twitch subtypes occur readily with endurance or strength training.
Type I (ST) <—>Type II (FT) (Hard/Slow): Complete transitions between slow-twitch and fast-twitch major types are extremely difficult, very slow, and mostly constrained by genetics.
How do force-velocity properties differ between Type 1 (Slow-Twitch) and Type 2 (Fast-Twitch) muscle fibres?
Type 1 (Slow-Twitch): Lower maximal shortening velocity (vmax)
Type 2 (Fast-Twitch: 2A, 2B, 2X): Significantly higher maximal shortening velocity (vmax) and higher maximal power output
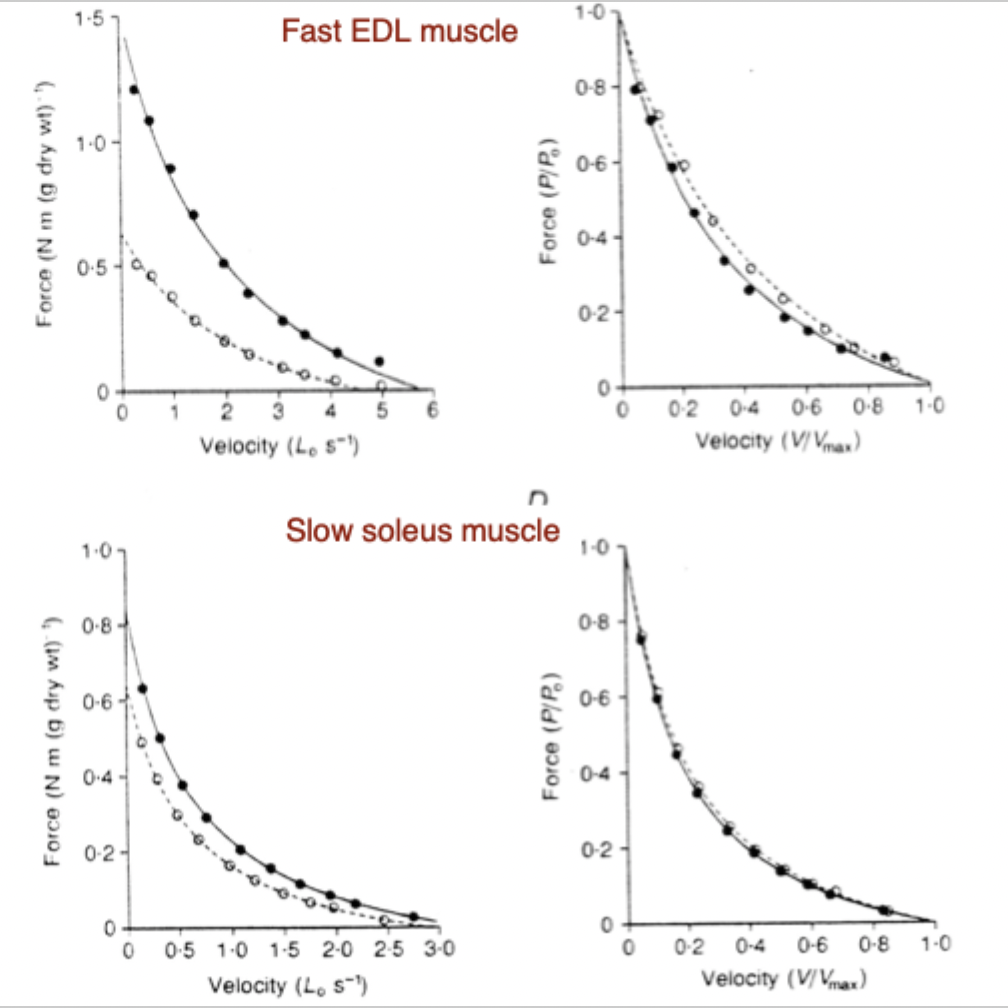
How does fatigue affect the force-velocity relationship in fast (EDL) versus slow (Soleus) muscles?
Fast EDL Muscle: Shows a large drop in absolute force under fatigue
Slow Soleus Muscle: Maintains force much better under fatigue (fatigue-resistant)
Normalized Curves: When normalized (P/P0 vs V/Vmax), the curve shapes remain nearly identical
Black point line = fresh muscle compared to white point line = used muscle
P0,F0= gleich immer die isometrische Form = dafür steht die null, weil 0,2Vx0F=0
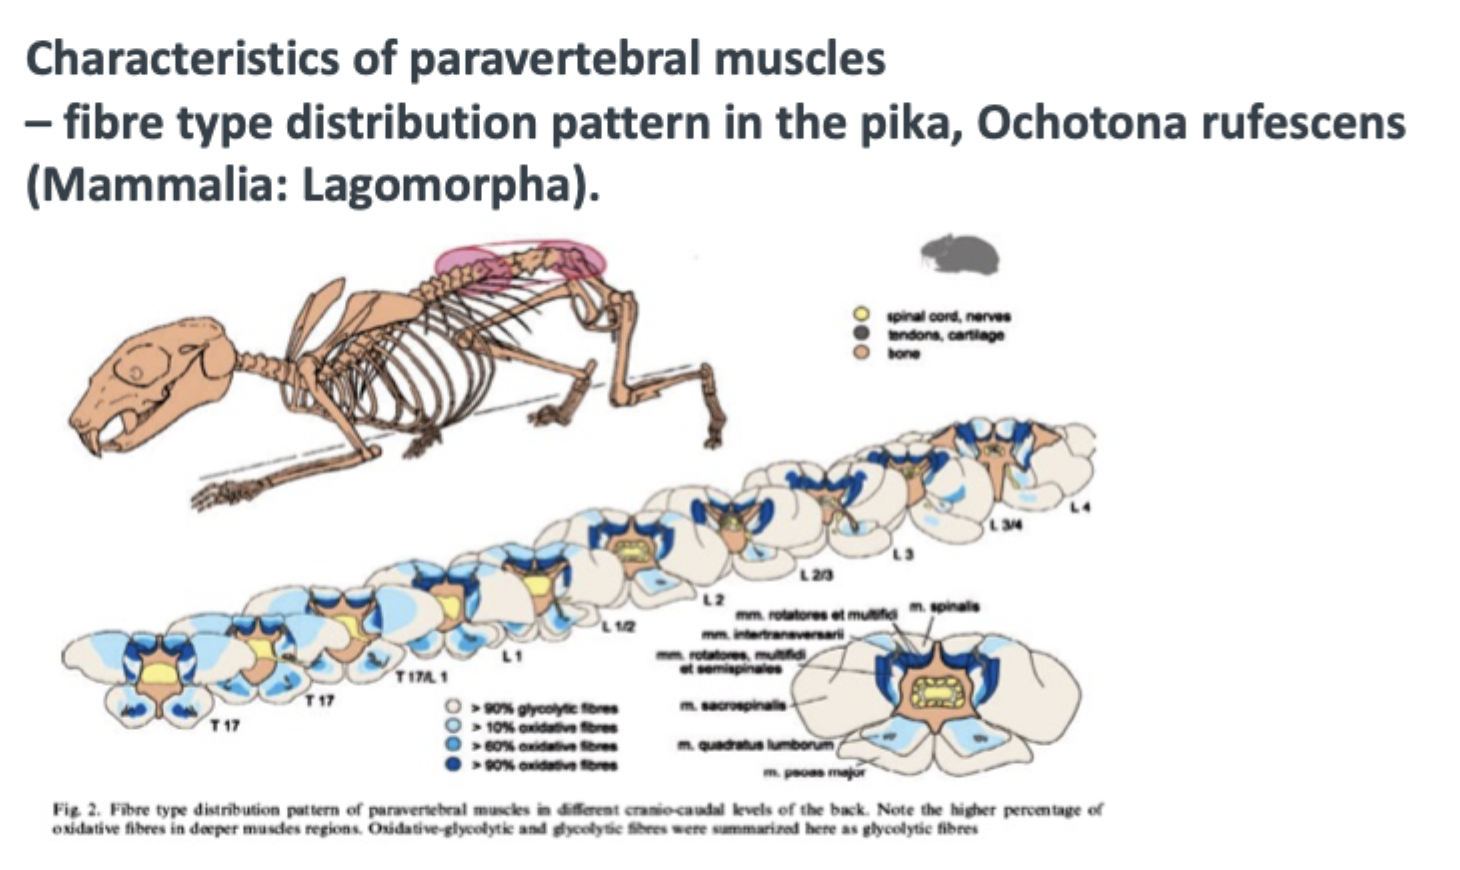
What fibre type distribution pattern is found in paravertebral back muscles (Schilling, 2005)?
Deep Muscle Regions: Higher percentage of oxidative fibres (>90% oxidative) for posture stabilization.
Superficial Muscle Regions: Higher percentage of glycolytic fibres (>90% glycolytic) for rapid movement torques
How do the fast EDL (Extensor Digitorum Longus) and slow Soleus muscles compare in maximal shortening velocity (vmax), and why is velocity measured in L0/s?
EDL (Fast EDL): Reaches a high maximal contraction velocity of approx. 5-6, L0/s. (Small, very fast muscle, e.g. cat)
Soleus (Slow Soleus): Reaches a lower maximal contraction velocity of approx. 2.5-3, L0/s (large, slow postural muscle, e.g. elephant )
conclusion: The small, fast muscle (EDL) reaches twice as many own muscle lengths per second shortening as the large, slow muscle (soleus)
Meaning of L0/s: Muscle lengths per second (L0 = optimal muscle length). Normalizing by L0 allows fair comparison of intrinsic contraction speeds between muscles of different physical sizes

On the "force-velocity for slow and fast fibres" slide, what do the Y-axis intercepts at 0.5 L/s and 1.5 L/s represent when force P/P0=0?
0.5 L/s Intercept (Type 1 / Slow-Twitch): Represents the maximal unloaded shortening velocity (vmax) of slow-twitch fibres.
1.5 L/s Intercept (Type 2 / Fast-Twitch: 2A, 2B, 2X): Represents the maximal unloaded shortening velocity (vmax) of fast-twitch fibres.
Key Takeaway: Under zero load (P/P0 → 0), fast-twitch muscle fibres contract approx. 3 times faster (1.5 L/s) than slow-twitch fibres (0.5L/s)
