Ecology: Competing Individuals and Populations Part 2
 Call Kai
 Learn
 Practice Test
 Spaced Repetition
 Match
 Flashcards
 Knowt Play
1/27

There's no tags or description
Looks like no tags are added yet.
28 Terms

Lets do a quick review of the logistic equation pictured. Whats dN/dt represent?
rate of population change

Lets do a quick review of the logistic equation pictured. What does r, N, and K represent?
r= intrinsic growth rate
N=# of individuals in population
K= carrying capacity

Lets take rabbits and deers. The formulas for intra and interspecific competition for rabbits and deer are pictured. What does alpha and beta represent?
alpha= how much deer competes with rabbits
beta= how much rabbits compete with deer

Lets take rabbits and deers. If alpha is 0.5 and beta is 0.2 what does that mean?
Each deer counts as has 0.5 (50%) rabbits worth of competition. Each rabbit counts as 0.2 (20%) deer worth of competition.
Lets take rabbits and deer. Why does adding interspecific competitors mimic increasing a species abundance closer to carrying capacity?
adding deer increases competition for rabbits making resources feel more limited so they behave as if theyre closer to carrying capacity

What does the whole fraction in the parenthesis represent?
total competitive effect
what does the total competitive effect tell us?
how much of the carrying capacity is being used by by competition

In a community of just 16 rabbits, whats the total competitive effect? What does this number mean biologically? Alpha is 2. K is 120.
0.13→ 13%
without deer rabbits experience 13% of their carrying capacity
In a community of 16 rabbits and 4 deer, whats the total competitive effect for rabbits? What does this number mean biologically? K for rabbits is 120 and deer is 50. Alpha is 2.
0.2→ 20%
when rabbits are with deer they experience 20% of their carrying capacity since competition increased
In a community of 16 rabbits and 4 deer, whats the total competitive effect for deer? What does this number mean biologically? K for rabbits is 120 and deer is 50. Alpha is 2. Beta is 0.4.
0.21→ 21%
the deer are using 21% of their carrying capacity when accounting for competition from rabbits
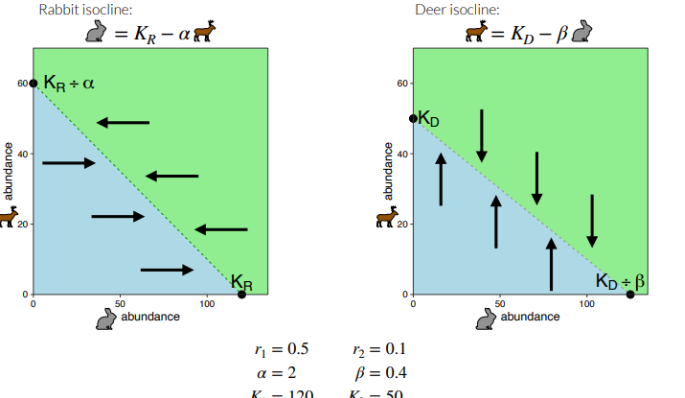
Similar to predator-prey phase plots, competitors also have isoclines. Pictured are the rabbit and deer isoclines. Why are the isoclines slanted?
since the two species compete for resources, increasing one species means the other species must decrease
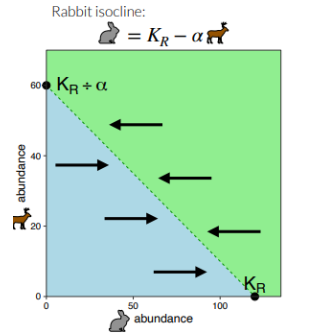
Pictured is the rabbit isocline. What trends do you notice? Why is this?
Below the line rabbits increase. This is because there are less deer so less competition. Above the line rabbits decrease. This is because there are more deer so more competition.
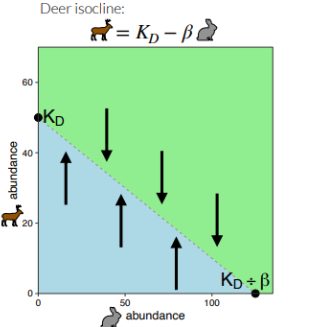
Pictured is the deer isocline. What trends do you notice? Why is this?
Below the line deer increase. This is because there is less competition from rabbits. Above the line deer decrease. This is because there’s more competition from rabbits.
From both graphs of deer and rabbit isoclines, whats the general common pattern we see?
above the line species decrease while below the line species increase

This graph shows both species isoclines together. What does the black star represent?
joint equilibrium meaning rabbits and deer have zero population growth

This graph shows both species isoclines together. Whats happening to the deer and rabbits in the yellow space? Why?
Both are increasing because the yellow region is below both lines

This graph shows both species isoclines together. Whats happening to the deer and rabbits in the green space? Why?
both are decreasing because the green region is above both lines

This graph shows both species isoclines together. Whats happening to the deer and rabbits in the blue space before joint equilibrium? Why?
Rabbits increase because blue is below rabbit isocline. Deer decrease because blue is above deer isocline.

This graph shows both species isoclines together. Whats happening to the deer and rabbits in the blue space after joint equilibrium? (hint: make sure to follow respective lines of each species separately)
Rabbits decrease because blue is above rabbit isocline. Deer increase because blue is below deer isocline.
whats a stable coexistence? Use rabbits and deer.
Even if the rabbit and deer populations fluctuate, they eventually return to a balance.
whats unstable coexistence? Use rabbits and deer.
If rabbits get more abundant they may gain competitive advantage and eliminate deer or vice versa

Does this graph represent stable or unstable coexistence? Why?
Stable because K1 and K2 are in the middle. When species 1, species 2 can still increase. When species 2 is at its carrying capacity, species 1 can still increase.

Does this graph represent stable or unstable coexistence? Why?
Unstable because K1 and K2 are the farthest points away. When species 1 is at carrying capacity, species 2 cant increase. When species 2 is at carrying capacity, species 1 can’t increase.
Whats a shortcut in determining if a graph is stable?
K1 ÷ α > K2
K2 ÷ β > K1
In other words, K is not at farthest points.
what happens if they don’t cross each other in a graph?
they are going to competively exclude each other

In this graph of competitive exclusion, who wins and why?
Species 1 wins because their carrying capacity is farthest from the origin so species 2 can’t keep growing when species 1 is at K.
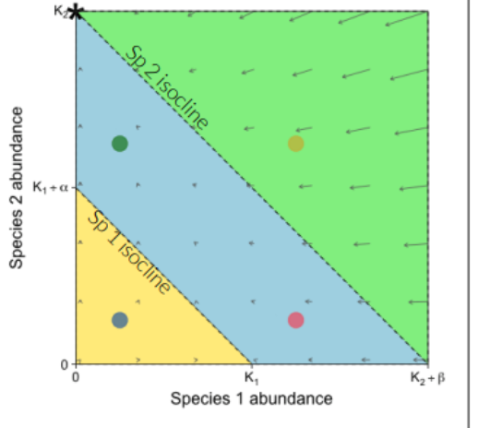
In this graph of competitive exclusion, who wins and why?
Species 2 wins because their carrying capacity is farthest from the origin so species 1 can’t keep growing when species 2 is at K.
Whats a shortcut in determining who will outcompete another species in a graph?
The species with the higher isocline always wins