EEB 2245 EXAM 2 UCONN
 Call Kai
 Learn
 Practice Test
 Spaced Repetition
 Match
 Flashcards
 Knowt Play
1/43

Earn XP
Description and Tags
Lectures 8-13 + Quiz 3-5
44 Terms
Breeder's Equation
The quantitative genetics equation R=h2S, which predicts evolutionary response (R) as the product of narrow-sense heritability (h2) and the selection differential (S).
Selection Differential (S)
The difference between the average phenotype of selected breeding individuals (t∗) and the average phenotype of the entire parental population (t), defined by the formula S=t∗−t.
Selection Gradient
A measure of the strength of selection obtained from the regression slope of relative fitness plotted against a quantitative trait, allowing simultaneous analysis of multiple traits without assuming truncation selection.
Directional Selection
A form of selection that favors phenotypes at one extreme of a trait distribution, shifting the population mean trait value and reducing phenotypic variation over generations.
Stabilizing Selection
A form of selection that favors intermediate phenotypes over extremes, keeping the population mean trait value unchanged while decreasing phenotypic variance.
Disruptive Selection
A form of selection that simultaneously favors both phenotypic extremes over intermediate individuals, increasing phenotypic variance in the population.
Common Garden Experiment
An experimental approach where individuals of different origins or genotypes are grown in a uniform environment to partition phenotypic variance (VP) into genetic variance (VG) and environmental variance (VE).
Gene Pool
The metaphor representing the total collection of all alleles and gametes (eggs and sperm) produced by reproductive individuals across a population.
Hardy-Weinberg Equilibrium
The theoretical state in which allele frequencies (p+q=1) and genotype frequencies (p2+2pq+q2=1) remain constant across generations in a non-evolving diploid population.
Hardy-Weinberg Assumptions
The five essential conditions required for a population to remain in Hardy-Weinberg equilibrium: no selection, no mutation, no gene flow or migration, infinitely large population size (no genetic drift), and random mating.
Average Population Fitness (W)
The mean relative fitness of a population, calculated as the sum of genotype frequencies weighted by their respective relative fitnesses: W=p2(w11)+2pq(w12)+q2(w22).
Post-Selection Genotype Frequency
The proportion of a genotype among surviving adults following viability selection, calculated by multiplying its initial genotype frequency by its relative fitness and dividing by the average population fitness (W).
Recessive Lethal Allele
An allele that causes embryonic or pre-reproductive mortality when present in the homozygous state, altering surviving Mendelian phenotypic ratios from 3:1 to 2:1 (such as the yellow coat allele in mice).
Overdominance
Heterozygote advantage, a condition where the heterozygous genotype has higher fitness than either homozygous genotype, maintaining both alleles in the population at stable equilibrium frequencies.
Negative Frequency-Dependent Selection
A selective process where the relative fitness of a phenotype decreases as its frequency in the population rises, favoring rare morphs and maintaining genetic diversity.

Rover and Sitter Polymorphism
A genetically based larval foraging polymorphism in Drosophila where rovers travel extensive paths to find food and sitters remain localized, with both morphs displaying highest fitness when rare (frequency of 0.25).

Long-Term Evolution Experiment (LTEE)
An ongoing experimental evolution study initiated by Richard Lenski tracking 12 asexual Escherichia coli populations propagated by daily serial transfer for over 65,000 generations, with samples archived every 500 generations.
Historical Contingency
The evolutionary requirement that specific precursor or potentiating mutations must accumulate before a key adaptive mutation can produce a new phenotype, demonstrated by Cit+ adaptation evolving only after 20,000 generations in E. coli.
Genetic Drift
A non-adaptive evolutionary force that causes random fluctuations in allele frequencies across generations due to sampling error in finite populations.
Founder Effect
The loss of genetic variation that happens when a new population is established by a small number of colonizing individuals carrying only a sample of the genetic diversity found in the ancestral population.
Genetic Bottleneck
A dramatic reduction in population size caused by environmental events or exploitation that sharply reduces allelic diversity and heterozygosity within an existing population (such as Northern elephant seals).
Allelic Richness
A measure of genetic diversity calculated as the total count of distinct alleles observed at a specific locus across a population, regardless of their individual frequencies.
Sewall Wright's Heterozygosity Decay Equation
The formula Hg+1=Hg[1−2N1], which describes the expected rate at which observed heterozygosity (H) declines per generation due to genetic drift in a finite population of size N.
Inbreeding Depression
A reduction in fitness traits (such as litter size or survival) caused by mating between close relatives, which increases overall homozygosity and exposes deleterious recessive alleles to selection.
Gene Flow
The transfer and incorporation of alleles between distinct populations through the migration of individuals or gametes, acting primarily as a homogenizing evolutionary force.
Fixation Index (FST)
A population genetics statistic ranging from 0 to 1 that quantifies genetic divergence between populations based on allele frequencies, where 0 indicates identical frequencies and 1 indicates complete fixation for alternate alleles.
Isolation by Distance
A biogeographical and genetic pattern defined by a positive correlation between pairwise genetic differentiation (FST/(1−FST)) and geographic distance between populations.
FST Outlier Analysis
A genome-scan method that identifies loci showing significantly elevated FST values compared to the genomic background, pinpointing candidate genes driving local adaptation without requiring common garden trials.
Lactase Persistence
The evolutionary adaptation allowing lactose digestion into adulthood via persistent lactase enzyme expression, caused by independent convergent mutations in intron 13 and intron 9 of the neighboring MCM6 gene.
Selective Sweep
The reduction in genetic variation among surrounding genomic loci linked to a strongly favored beneficial mutation as it sweeps rapidly toward fixation, creating long runs of homozygosity and reduced nucleotide diversity (π).
Pairwise Nucleotide Diversity (π)
A population genetics metric defined as the average number of nucleotide differences per site between all possible pairwise combinations of homologous DNA sequences sampled from a population.
You suspect that leaf size is a quantitative trait in your species. You mate a small leaf and large leaf parent together to produce an F1 hybrid offspring that is intermediate in leaf size. That F1 hybrid is then self fertilized to produce an F2 population. You then measure leaf size in the F2 population and count up how many leaves are found in each size class. Which of the below datasets would be most consistent with leaf size variation being controlled by an extremely large amount of genes?
Each plant in the F2 population had ever so slightly different sized leaves so it was hard to put them into discrete categories
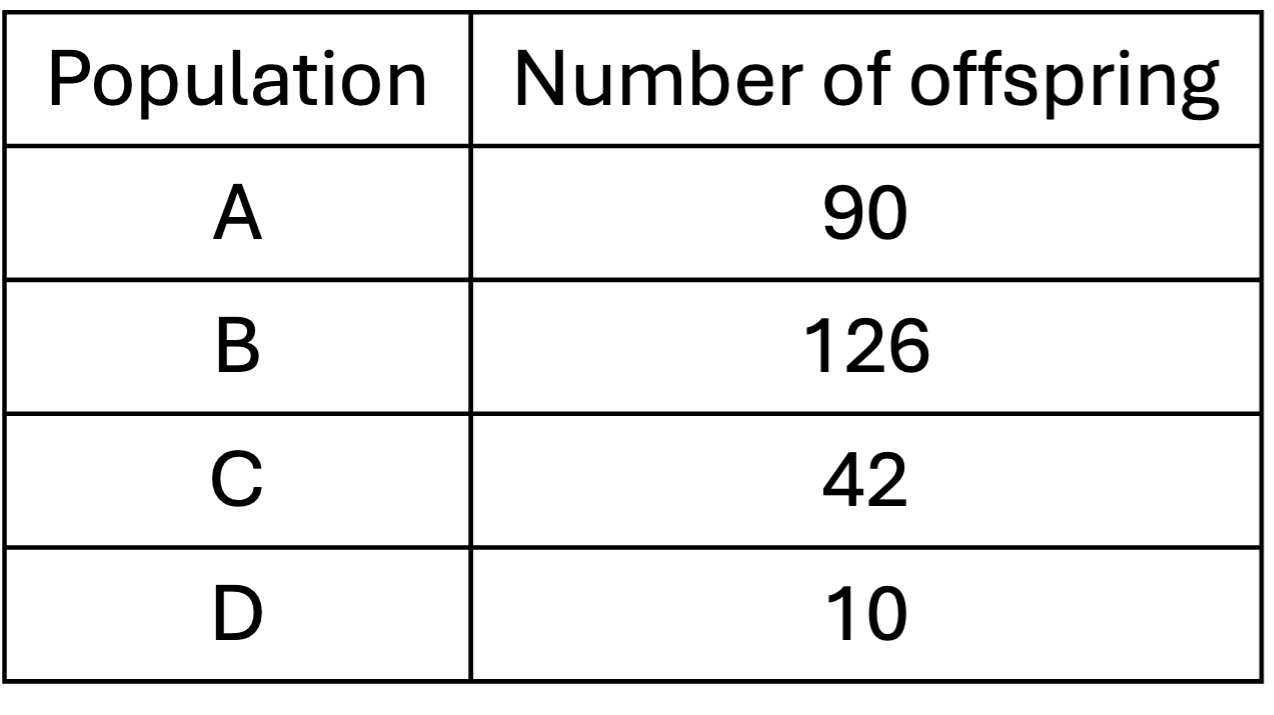
You raise four populations of beetles in controlled laboratory conditions. Those populations are then measured for the average number of offspring produced. Which statement (or statements) below are consistent with this experimental set up AND the results found in the table?
This is a common garden experiment and it is unclear whether population B is locally adapted to its home environment
You are studying a species of bacterium that has variation in cell size. In your lab, you have a population of bacteria that all have the exact same genome (no mutations). However, some cells are larger due to supplemental nutrients and some are smaller due to the withholding of important nutrients. Which of the below statements is/are true regarding the variation in this population?
There is no genetic variation in this population
There is environmental variation in this population
There is phenotypic variation in this population

The attached excel spreadsheet (also shown as an image below) shows data on a population of 20 butterflies. Based on their pigmentation score, butterflies are either killed by predators or survive. Survival is noted by a "Y" in the third column. In this population, only the survivors are able to mate. Calculate what the strength of selection (S) would be in this scenario.
29.25
You are studying a bird population where the average wing length is 30 cm and the narrow-sense heritability is 0.2. Natural selection occurs and in the next generation the offspring have a wing length average of 28.5 cm. What was the strength of selection (S)?
-7.5
Growth rate is a quantitative trait in plants. In certain environments, plant populations are being naturally selected to grow very quickly in spring so that they complete their life cycle before summer droughts occur. What kind of selection is this and what impact does it have on trait variation?
directional; decreased variation
In a population of snails you expected there to be a frequency of 0.3 ee genotypes but instead the observed frequency was 0.5 ee genotypes. This is a significant difference. Which of the following can we say about this population? Select all correct answers.
Evolution has occurred
You are studying clam populations and obtain the following counts of genotypes: 46 FF, 103 Ff, 88 ff. What is the allele frequency of f?
0.5886
A population is in Hardy-Weinberg equilibrium. It has the allele frequencies of H = 0.55 and h = 0.45. Which of the following is/are true? Select all correct answers
The allele frequency of H will be 0.55 in the next generation
The population is not evolving
The expected genotype frequency of HH is approximately 0.30

Here is graph showing allele frequency changes for three different alleles that all started at low frequencies. Which allele shows a pattern consistent with being under the strongest selection? Choose the best answer.
A
A population of 100 individuals has the following genotype counts: 49 EE, 42 Ee, and 9 ee. The fitness values for three genotypes are: wEE = 0.85, wEe = 0.95, wee = 0.7. What is the average fitness (W bar; W with a line over it) for this popluation?
0.8785
Which of the following are associated with maintaining genetic diversity in a population? Select all correct answers.
Heterozygote advantage
Negative frequency-dependent selection
We are monitoring three populations that have different population sizes: A = 40, B = 400, and C = 4,000 individuals. A random event causes the same number of individuals to die in each population (deaths = 23). Based on their population sizes, which population would be expected to experience the strongest effects of genetic drift? Choose the best answer
Population A